Sheffield City Council election, 1990
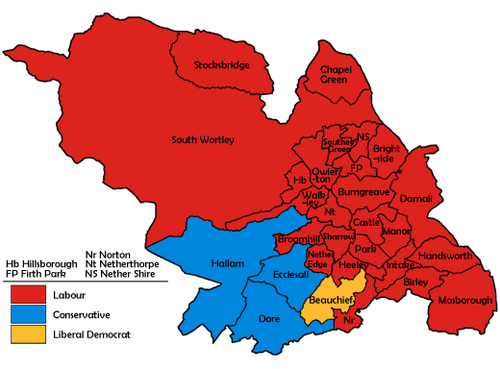
Map of the results for the 1990 Sheffield council election.
Elections to Sheffield City Council were held on 4 May 1990. One third of the council was up for election.
Election result
| Sheffield Local Election Result 1990 |
| Party |
Seats |
Gains |
Losses |
Net gain/loss |
Seats % |
Votes % |
Votes |
+/− |
| |
Labour |
29 |
3 |
0 |
+3 |
87.9 |
62.2 |
105,937 |
+3.3% |
| |
Conservative |
3 |
0 |
1 |
-1 |
9.1 |
17.8 |
30,437 |
-4.3% |
| |
Liberal Democrat |
1 |
1 |
3 |
-2 |
3.0 |
17.0 |
29,041 |
+0.6% |
| |
Green |
0 |
0 |
0 |
0 |
0.0 |
2.8 |
4,738 |
+2.2% |
|
No Poll Tax |
0 |
0 |
0 |
0 |
0.0 |
0.0 |
96 |
+0.0% |
| |
Alternative Development, Small is Beautiful |
0 |
0 |
0 |
0 |
0.0 |
0.0 |
92 |
+0.0% |
|
International Communist |
0 |
0 |
0 |
0 |
0.0 |
0.0 |
56 |
+0.0% |
This result had the following consequences for the total number of seats on the Council after the elections:
| Party |
Previous council |
New council |
|
Labour |
66 |
69 |
|
Conservatives |
12 |
11 |
|
Liberal Democrats |
9 |
7 |
| Total |
87 |
87 |
| Working majority |
45 |
51 |
Ward results
| Beauchief [1] |
| Party |
Candidate |
Votes |
% |
±% |
|
Liberal Democrat |
Peter Moore |
4,126 |
46.8 |
+13.7 |
|
Labour |
Anne Sheehan |
2,780 |
31.5 |
+0.9 |
|
Conservative |
Caroline Gracey |
1,905 |
21.6 |
-12.8 |
| Majority |
1,346 |
15.3 |
+14.0 |
| Turnout |
8,811 |
58.4 |
+11.6 |
|
Liberal Democrat gain from Conservative |
Swing |
+6.4 |
|
| Birley [1] |
| Party |
Candidate |
Votes |
% |
±% |
|
Labour |
Donald Gow |
5,061 |
75.5 |
+4.2 |
|
Conservative |
Gordon Millward |
925 |
13.8 |
-3.8 |
|
Liberal Democrat |
Andrea Morris |
715 |
10.7 |
-0.3 |
| Majority |
4,136 |
61.7 |
+8.0 |
| Turnout |
6,701 |
42.0 |
+9.1 |
|
Labour hold |
Swing |
+4.0 |
|
| Brightside[1] |
| Party |
Candidate |
Votes |
% |
±% |
|
Labour |
Rae Whitfield |
3,716 |
80.4 |
-0.6 |
|
Green |
Richard Griffiths |
366 |
7.9 |
+7.9 |
|
Liberal Democrat |
John Wilcock |
281 |
6.1 |
-2.1 |
|
Conservative |
Mary Hyatt |
257 |
5.5 |
-5.2 |
| Majority |
3,360 |
72.5 |
+2.2 |
| Turnout |
4,620 |
35.9 |
+11.0 |
|
Labour hold |
Swing |
-4.2 |
|
| Broomhill[1] |
| Party |
Candidate |
Votes |
% |
±% |
|
Labour |
Richard Eastall |
2,101 |
41.0 |
+1.0 |
|
Labour |
Mukesh Sevani |
1,950 |
|
|
|
Conservative |
Henry Cornford |
1,697 |
33.1 |
-4.2 |
|
Conservative |
Marjorie Kirby |
1,651 |
|
|
|
Green |
Bernard Little |
802 |
15.6 |
+9.0 |
|
Green |
Michael Mallen |
718 |
|
|
|
Liberal Democrat |
Andrew Milton |
523 |
10.2 |
-3.9 |
|
Liberal Democrat |
Allan Wisbey |
461 |
|
|
| Majority |
253 |
7.9 |
+5.2 |
| Turnout |
5,123 |
38.5 |
+0.5 |
|
Labour hold |
Swing |
|
|
|
Labour hold |
Swing |
+2.6 |
|
| Chapel Green[1] |
| Party |
Candidate |
Votes |
% |
±% |
|
Labour |
Laurence Kingham |
4,358 |
52.9 |
+7.9 |
|
Liberal Democrat |
Graham Oxley |
3,424 |
41.5 |
-5.9 |
|
Conservative |
John Davey |
458 |
5.5 |
-0.5 |
| Majority |
934 |
11.4 |
+9.0 |
| Turnout |
8,240 |
45.1 |
+8.0 |
|
Labour gain from Liberal Democrat |
Swing |
+6.9 |
|
| Darnall[1] |
| Party |
Candidate |
Votes |
% |
±% |
|
Labour |
Mohammed Walayat |
3,393 |
65.3 |
-7.8 |
|
Conservative |
Colin Cavill |
701 |
13.5 |
-2.0 |
|
Liberal Democrat |
Sheila Rehman |
570 |
10.9 |
-0.5 |
|
Green |
Gordon Ferguson |
532 |
10.2 |
+10.2 |
| Majority |
2,692 |
51.8 |
-5.8 |
| Turnout |
5,196 |
34.9 |
+5.7 |
|
Labour hold |
Swing |
-2.9 |
|
| Dore[1] |
| Party |
Candidate |
Votes |
% |
±% |
|
Conservative |
Diana Leech |
3,930 |
50.9 |
-6.3 |
|
Labour |
Glenn Ellis |
2,694 |
34.9 |
+6.2 |
|
Liberal Democrat |
Anthony Richmond |
1,089 |
14.1 |
+3.9 |
| Majority |
1,236 |
16.0 |
-12.5 |
| Turnout |
7,713 |
46.6 |
+8.0 |
|
Conservative hold |
Swing |
-6.2 |
|
| Ecclesall[1] |
| Party |
Candidate |
Votes |
% |
±% |
|
Conservative |
Stuart Dawson |
3,526 |
49.0 |
-5.3 |
|
Labour |
Timothy Plant |
1,985 |
27.6 |
+4.9 |
|
Liberal Democrat |
Colin Ross |
1,078 |
15.0 |
-1.1 |
|
Green |
Leela Spencer |
601 |
8.3 |
+4.0 |
| Majority |
1,541 |
21.4 |
-10.2 |
| Turnout |
7,192 |
45.5 |
+4.5 |
|
Conservative hold |
Swing |
-5.1 |
|
| Firth Park[1] |
| Party |
Candidate |
Votes |
% |
±% |
|
Labour |
Joan Barton |
4,693 |
84.7 |
+2.0 |
|
Liberal Democrat |
Andrew McKerrow |
467 |
8.4 |
+2.8 |
|
Conservative |
Andrew Cook |
380 |
6.8 |
-1.9 |
| Majority |
4,226 |
76.3 |
+2.3 |
| Turnout |
5,540 |
40.4 |
+9.9 |
|
Labour hold |
Swing |
-0.4 |
|
| Hallam[1] |
| Party |
Candidate |
Votes |
% |
±% |
|
Conservative |
Graham Lawson |
3,508 |
46.6 |
-4.2 |
|
Labour |
Andrew Nicolson |
2,293 |
30.4 |
+4.8 |
|
Liberal Democrat |
John Knight |
1,212 |
16.1 |
-3.5 |
|
Green |
Peter Scott |
518 |
6.9 |
+6.9 |
| Majority |
1,215 |
16.2 |
-9.0 |
| Turnout |
7,531 |
51.6 |
+7.9 |
|
Conservative hold |
Swing |
-4.5 |
|
| Handsworth[1] |
| Party |
Candidate |
Votes |
% |
±% |
|
Labour |
Kenneth Hartley |
4,054 |
71.4 |
+7.7 |
|
Liberal Democrat |
Anita Morris |
935 |
16.5 |
-6.9 |
|
Conservative |
Shirley Clayton |
592 |
10.4 |
-0.3 |
|
Alternative Development, Small is Beautiful |
Roger Dunn |
92 |
1.6 |
+1.6 |
| Majority |
3,119 |
54.9 |
+14.6 |
| Turnout |
5,673 |
38.2 |
+0.4 |
|
Labour hold |
Swing |
+7.3 |
|
| Heeley[1] |
| Party |
Candidate |
Votes |
% |
±% |
|
Labour |
Roy Darke |
4,361 |
73.1 |
+4.5 |
|
Conservative |
Elizabeth Bradbury |
871 |
14.6 |
-5.1 |
|
Liberal Democrat |
Stephen Ayris |
733 |
12.3 |
+4.3 |
| Majority |
3,490 |
58.5 |
+9.6 |
| Turnout |
5,965 |
40.9 |
+9.5 |
|
Labour hold |
Swing |
+4.8 |
|
| Hillsborough[1] |
| Party |
Candidate |
Votes |
% |
±% |
|
Labour |
Patricia Waugh |
3,639 |
57.7 |
+7.3 |
|
Liberal Democrat |
Lynette Jackson |
1,450 |
23.0 |
-6.4 |
|
Conservative |
Michael Warner |
828 |
13.1 |
-4.7 |
|
Green |
Peter Wood |
391 |
6.2 |
+3.8 |
| Majority |
2,189 |
34.7 |
+13.7 |
| Turnout |
6,308 |
42.1 |
+2.0 |
|
Labour hold |
Swing |
+6.8 |
|
| Intake[1] |
| Party |
Candidate |
Votes |
% |
±% |
|
Labour |
Katherine Sheldrick |
4,346 |
72.7 |
+5.0 |
|
Labour |
James Steinke |
3,864 |
|
|
|
Conservative |
Robert Atha |
1,012 |
16.9 |
-5.8 |
|
Conservative |
Steven Fulbrook |
840 |
|
|
|
Liberal Democrat |
Susan Alston |
619 |
10.3 |
+4.1 |
|
Liberal Democrat |
Katherine Milsom |
535 |
|
|
| Majority |
2,852 |
55.8 |
+10.8 |
| Turnout |
5,977 |
39.7 |
+9.9 |
|
Labour hold |
Swing |
|
|
|
Labour hold |
Swing |
+5.4 |
|
| Manor[1] |
| Party |
Candidate |
Votes |
% |
±% |
|
Labour |
Howard Capelin |
3,485 |
86.5 |
+0.4 |
|
Conservative |
Paul Anderton |
299 |
7.4 |
-1.9 |
|
Liberal Democrat |
Leonard Middleton |
245 |
6.1 |
+1.5 |
| Majority |
3,186 |
79.1 |
+2.3 |
| Turnout |
4,029 |
42.9 |
+12.9 |
|
Labour hold |
Swing |
+1.1 |
|
| Mosborough[1] |
| Party |
Candidate |
Votes |
% |
±% |
|
Labour |
Ian Saunders |
6,063 |
73.7 |
+6.0 |
|
Conservative |
Philip Kirby |
1,330 |
16.1 |
-6.1 |
|
Liberal Democrat |
Louise Truman |
834 |
10.1 |
+3.8 |
| Majority |
4,733 |
57.6 |
+12.1 |
| Turnout |
8,227 |
34.9 |
+5.9 |
|
Labour hold |
Swing |
+6.0 |
|
| Nether Edge[1] |
| Party |
Candidate |
Votes |
% |
±% |
|
Labour |
Qurban Hussain |
2,477 |
45.2 |
-3.7 |
|
Conservative |
Anne Smith |
1,260 |
23.0 |
-9.1 |
|
Liberal Democrat |
Gregory Connor |
1,103 |
20.1 |
+5.0 |
|
Green |
Jill Margaret |
547 |
10.0 |
+10.0 |
|
No Poll Tax |
Simon Rawlins |
96 |
1.7 |
+1.7 |
| Majority |
1,217 |
22.2 |
+5.4 |
| Turnout |
5,483 |
39.6 |
-0.7 |
|
Labour hold |
Swing |
+2.7 |
|
| Netherthorpe[1] |
| Party |
Candidate |
Votes |
% |
±% |
|
Labour |
Michael Bower |
3,232 |
71.8 |
-4.0 |
|
Conservative |
David Knight |
530 |
11.8 |
-1.8 |
|
Green |
Barry New |
436 |
9.7 |
+9.7 |
|
Liberal Democrat |
David Cloke |
300 |
6.6 |
-1.1 |
| Majority |
2,702 |
60.0 |
-2.2 |
| Turnout |
4,498 |
36.5 |
+7.8 |
|
Labour hold |
Swing |
-1.1 |
|
| Norton[1] |
| Party |
Candidate |
Votes |
% |
±% |
|
Labour |
James Moore |
4,245 |
70.9 |
+3.5 |
|
Conservative |
Albert Marsden |
1,133 |
18.9 |
-4.8 |
|
Liberal Democrat |
Christopher Tutt |
609 |
10.2 |
+1.4 |
| Majority |
3,112 |
52.0 |
+8.3 |
| Turnout |
5,987 |
46.2 |
+7.8 |
|
Labour hold |
Swing |
+4.1 |
|
| Owlerton[1] |
| Party |
Candidate |
Votes |
% |
±% |
|
Labour |
George Mathews |
3,848 |
80.3 |
-4.7 |
|
Liberal Democrat |
Kathryn Taylor |
474 |
9.9 |
-2.4 |
|
Conservative |
Jane Harries |
469 |
9.8 |
+7.1 |
| Majority |
3,374 |
70.4 |
-2.3 |
| Turnout |
4,791 |
37.4 |
+8.3 |
|
Labour hold |
Swing |
-1.1 |
|
| Park[1] |
| Party |
Candidate |
Votes |
% |
±% |
|
Labour |
Doris Mulhearn |
4,176 |
87.3 |
+1.9 |
|
Liberal Democrat |
Sheila Hughes |
311 |
6.5 |
+0.2 |
|
Conservative |
Clare Fenner |
297 |
6.2 |
-2.1 |
| Majority |
3,865 |
80.8 |
+3.7 |
| Turnout |
4,784 |
35.7 |
+9.5 |
|
Labour hold |
Swing |
+0.8 |
|
| Sharrow[1] |
| Party |
Candidate |
Votes |
% |
±% |
|
Labour |
Catherine Whitty |
3,058 |
76.2 |
+3.5 |
|
Liberal Democrat |
Kathleen Brown |
492 |
12.2 |
+4.5 |
|
Conservative |
Paul Makin |
464 |
11.5 |
-3.1 |
| Majority |
2,566 |
64.0 |
+5.9 |
| Turnout |
4,014 |
34.6 |
+6.4 |
|
Labour hold |
Swing |
-0.5 |
|
| South Wortley[1] |
| Party |
Candidate |
Votes |
% |
±% |
|
Labour |
John Webster |
3,691 |
43.6 |
+5.3 |
|
Liberal Democrat |
Trevor Bagshaw |
3,424 |
40.5 |
+0.9 |
|
Conservative |
Lynn Wilson |
1,339 |
15.8 |
-6.2 |
| Majority |
267 |
3.1 |
+1.8 |
| Turnout |
8,454 |
45.7 |
+7.6 |
|
Labour gain from Liberal Democrat |
Swing |
+2.2 |
|
| Southey Green[1] |
| Party |
Candidate |
Votes |
% |
±% |
|
Labour |
Patricia Nelson |
4,511 |
88.8 |
-0.1 |
|
Liberal Democrat |
Nic Chilton |
328 |
6.4 |
+1.3 |
|
Conservative |
Robert Usher |
242 |
4.7 |
-1.2 |
| Majority |
4,183 |
82.4 |
-0.6 |
| Turnout |
5,081 |
40.8 |
+8.5 |
|
Labour hold |
Swing |
-0.7 |
|
| Stocksbridge[1] |
| Party |
Candidate |
Votes |
% |
±% |
|
Labour |
Alred Meade |
2,459 |
50.4 |
+6.9 |
|
Liberal Democrat |
Maureen Brelsford |
1,997 |
40.9 |
-2.8 |
|
Conservative |
Russell Crane |
425 |
8.7 |
-1.9 |
| Majority |
462 |
9.5 |
+9.3 |
| Turnout |
4,881 |
46.3 |
+10.6 |
|
Labour gain from Liberal Democrat |
Swing |
+4.8 |
|
| Walkley[1] |
| Party |
Candidate |
Votes |
% |
±% |
|
Labour |
Carol Bullement |
4,336 |
70.2 |
-4.3 |
|
Conservative |
Christine Blundell |
714 |
11.6 |
-1.8 |
|
Liberal Democrat |
Penelope Baker |
576 |
9.3 |
+1.9 |
|
Green |
Nicola Watson |
545 |
8.8 |
+8.8 |
| Majority |
3,622 |
58.6 |
-2.5 |
| Turnout |
6,171 |
42.7 |
+5.6 |
|
Labour hold |
Swing |
-1.2 |
|
References