Sheffield City Council election, 1988
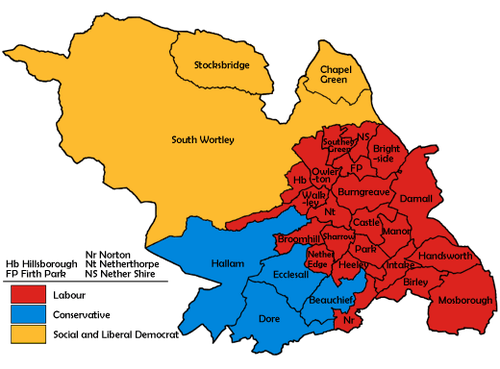
Map of the results for the 1988 Sheffield council election.
Elections to Sheffield City Council were held on 5 May 1988. One third of the council was up for election.
Election result
| Sheffield Local Election Result 1988 |
| Party |
Seats |
Gains |
Losses |
Net gain/loss |
Seats % |
Votes % |
Votes |
+/− |
| |
Labour |
23 |
1 |
0 |
+1 |
76.6 |
58.9 |
84,640 |
+7.8% |
| |
Conservative |
4 |
0 |
1 |
-1 |
13.3 |
22.1 |
31,685 |
+1.1% |
| |
Social and Liberal Democrats |
3 |
0 |
0 |
0 |
10.0 |
16.4 |
23,579 |
-11.3% |
| |
Social Democrat |
0 |
0 |
0 |
0 |
0.0 |
1.8 |
2,591 |
+1.8% |
| |
Green |
0 |
0 |
0 |
0 |
0.0 |
0.6 |
900 |
+0.5% |
| |
Communist |
0 |
0 |
0 |
0 |
0.0 |
0.1 |
161 |
+0.1% |
This result had the following consequences for the total number of seats on the Council after the elections:
| Party |
Previous council |
New council |
|
Labour |
65 |
66 |
|
Conservatives |
13 |
12 |
|
Social and Liberal Democrats |
9 |
9 |
| Total |
87 |
87 |
| Working majority |
43 |
45 |
Ward results
| Birley [1] |
| Party |
Candidate |
Votes |
% |
±% |
|
Labour |
Val Shepherd |
3,804 |
71.3 |
+11.5 |
|
Conservative |
Gordon Millward |
938 |
17.6 |
-0.4 |
|
Social and Liberal Democrats |
Cyril Skipworth |
588 |
11.0 |
-11.2 |
| Majority |
2,866 |
53.7 |
+16.1 |
| Turnout |
5,330 |
32.9 |
-6.3 |
|
Labour hold |
Swing |
+5.9 |
|
| Brightside[1] |
| Party |
Candidate |
Votes |
% |
±% |
|
Labour |
Peter Price |
2,658 |
81.0 |
+9.9 |
|
Conservative |
Jeremy Richardson |
350 |
10.7 |
-1.0 |
|
Social and Liberal Democrats |
Peter McNutt |
270 |
8.2 |
-8.9 |
| Majority |
2,308 |
70.3 |
+16.3 |
| Turnout |
3,278 |
24.9 |
-6.8 |
|
Labour hold |
Swing |
+5.4 |
|
| Castle[1] |
| Party |
Candidate |
Votes |
% |
±% |
|
Labour |
Thomas Bower |
2,795 |
84.3 |
+6.8 |
|
Conservative |
Joan Graham |
344 |
10.4 |
-0.3 |
|
Social and Liberal Democrats |
Donald Smith |
176 |
5.3 |
-6.4 |
| Majority |
2,451 |
73.9 |
+8.1 |
| Turnout |
3,315 |
25.6 |
-5.3 |
|
Labour hold |
Swing |
+3.5 |
|
| Chapel Green[1] |
| Party |
Candidate |
Votes |
% |
±% |
|
Social and Liberal Democrats |
David Chadwick |
3,161 |
47.4 |
-6.8 |
|
Labour |
Eldon Hanson |
3,005 |
45.0 |
+6.0 |
|
Conservative |
Cecilia Holt |
403 |
6.0 |
-0.7 |
|
Social Democrat |
David Richie |
103 |
1.5 |
+1.5 |
| Majority |
156 |
2.4 |
-12.8 |
| Turnout |
6,672 |
37.1 |
-9.8 |
|
Social and Liberal Democrats hold |
Swing |
-6.4 |
|
| Darnall[1] |
| Party |
Candidate |
Votes |
% |
±% |
|
Labour |
Sandra Robinson |
3,194 |
73.1 |
+9.8 |
|
Conservative |
Philip Kirby |
676 |
15.5 |
-0.8 |
|
Social and Liberal Democrats |
Dennis Boothroyd |
497 |
11.4 |
-9.0 |
| Majority |
2,518 |
57.6 |
+14.7 |
| Turnout |
4,367 |
29.2 |
-5.9 |
|
Labour hold |
Swing |
+5.3 |
|
| Ecclesall[1] |
| Party |
Candidate |
Votes |
% |
±% |
|
Conservative |
Bobbie Fleming |
3,515 |
54.3 |
+2.3 |
|
Labour |
Timothy Plant |
1,468 |
22.7 |
+3.3 |
|
Social and Liberal Democrats |
Christine Freeman |
1,044 |
16.1 |
-12.5 |
|
Green |
Clare Jenkins |
280 |
4.3 |
+4.3 |
|
Social Democrat |
Peter Sorby |
165 |
2.5 |
+2.5 |
| Majority |
2,047 |
31.6 |
+8.2 |
| Turnout |
6,472 |
41.0 |
-7.9 |
|
Conservative hold |
Swing |
-0.5 |
|
| Handsworth[1] |
| Party |
Candidate |
Votes |
% |
±% |
|
Labour |
Harold Lambert |
3,588 |
63.7 |
+12.1 |
|
Social and Liberal Democrats |
Alice Smith |
1,317 |
23.4 |
-15.4 |
|
Conservative |
Shirley Clayton |
602 |
10.7 |
+1.5 |
|
Green |
Roger Dunn |
126 |
2.2 |
+1.9 |
| Majority |
2,271 |
40.3 |
+27.5 |
| Turnout |
5,633 |
37.8 |
-6.4 |
|
Labour hold |
Swing |
+13.7 |
|
| Heeley[1] |
| Party |
Candidate |
Votes |
% |
±% |
|
Labour |
Edward Lamb |
3,255 |
68.6 |
+10.7 |
|
Conservative |
Elizabeth Bradbury |
935 |
19.7 |
-1.3 |
|
Social and Liberal Democrats |
Valerie King |
381 |
8.0 |
-13.0 |
|
Social Democrat |
John Hetherington |
170 |
3.6 |
+3.6 |
| Majority |
2,320 |
48.9 |
+12.0 |
| Turnout |
4,741 |
31.4 |
-7.4 |
|
Labour hold |
Swing |
+6.0 |
|
| Hillsborough[1] |
| Party |
Candidate |
Votes |
% |
±% |
|
Labour |
Peter Duff |
3,107 |
50.4 |
+3.6 |
|
Social and Liberal Democrats |
David Swarbrick |
1,813 |
29.4 |
-3.9 |
|
Conservative |
Michael Warner |
1,098 |
17.8 |
-2.0 |
|
Green |
Jacqueline O'Neill |
147 |
2.4 |
+2.4 |
| Majority |
1,294 |
21.0 |
+7.5 |
| Turnout |
6,165 |
40.1 |
-6.8 |
|
Labour hold |
Swing |
+3.7 |
|
| Intake[1] |
| Party |
Candidate |
Votes |
% |
±% |
|
Labour |
Philip Moscrop |
3,181 |
67.7 |
+8.7 |
|
Conservative |
Elizabeth Bradbury |
1,067 |
22.7 |
+1.6 |
|
Social and Liberal Democrats |
Douglas Oldfield |
293 |
6.2 |
-13.6 |
|
Social Democrat |
David Dean |
153 |
3.2 |
+3.2 |
| Majority |
2,114 |
45.0 |
+7.1 |
| Turnout |
4,694 |
29.8 |
-7.7 |
|
Labour hold |
Swing |
+3.5 |
|
| Manor[1] |
| Party |
Candidate |
Votes |
% |
±% |
|
Labour |
Bill Jordan |
2,715 |
86.1 |
+6.9 |
|
Conservative |
Paul Anderton |
293 |
9.3 |
+0.2 |
|
Social and Liberal Democrats |
Leonard Middleton |
146 |
4.6 |
-7.0 |
| Majority |
2,422 |
76.8 |
+9.2 |
| Turnout |
3,154 |
30.0 |
|
|
Labour hold |
Swing |
+3.3 |
|
| Mosborough[1] |
| Party |
Candidate |
Votes |
% |
±% |
|
Labour |
Dorothy Walton |
4,328 |
67.7 |
+8.4 |
|
Conservative |
Caroline Gracey |
1,420 |
22.2 |
+0.7 |
|
Social and Liberal Democrats |
Kevin Smith |
402 |
6.3 |
-12.9 |
|
Social Democrat |
Roger Davison |
239 |
3.7 |
+3.7 |
| Majority |
2,908 |
45.5 |
+7.7 |
| Turnout |
6,389 |
29.0 |
-6.6 |
|
Labour hold |
Swing |
+3.8 |
|
| Nether Edge[1] |
| Party |
Candidate |
Votes |
% |
±% |
|
Labour |
Jan Flore |
2,772 |
48.9 |
+10.4 |
|
Conservative |
Henry Cornford |
1,816 |
32.1 |
+3.4 |
|
Social and Liberal Democrats |
George Manley |
858 |
15.1 |
-14.3 |
|
Social Democrat |
Stephen Ruttle |
216 |
3.8 |
+3.8 |
| Majority |
956 |
16.8 |
+7.7 |
| Turnout |
5,662 |
40.3 |
-6.0 |
|
Labour hold |
Swing |
+3.5 |
|
| Netherthorpe[1] |
| Party |
Candidate |
Votes |
% |
±% |
|
Labour |
Jennifer Harvey |
2,883 |
75.8 |
+6.5 |
|
Conservative |
David Knight |
519 |
13.6 |
-1.2 |
|
Social and Liberal Democrats |
David Cloke |
293 |
7.7 |
-8.1 |
|
Social Democrat |
Rachel Ritchie |
106 |
2.8 |
+2.8 |
| Majority |
2,364 |
62.2 |
+8.7 |
| Turnout |
3,801 |
28.7 |
-9.6 |
|
Labour hold |
Swing |
+3.8 |
|
| Norton[1] |
| Party |
Candidate |
Votes |
% |
±% |
|
Labour |
John Butler |
3,468 |
67.4 |
+8.0 |
|
Conservative |
Russell Crane |
1,221 |
23.7 |
+1.2 |
|
Social and Liberal Democrats |
Ian Auckland |
454 |
8.8 |
-9.3 |
| Majority |
2,247 |
43.7 |
+6.8 |
| Turnout |
5,143 |
38.4 |
-6.5 |
|
Labour hold |
Swing |
+3.4 |
|
| Owlerton[1] |
| Party |
Candidate |
Votes |
% |
±% |
|
Labour |
George Burrows |
3,165 |
85.0 |
+16.4 |
|
Social and Liberal Democrats |
Francis Pierce |
459 |
12.3 |
-6.3 |
|
Conservative |
Malcolm Smith |
100 |
2.7 |
-10.0 |
| Majority |
2,706 |
72.7 |
+22.7 |
| Turnout |
3,724 |
29.1 |
-7.1 |
|
Labour hold |
Swing |
+11.3 |
|
| Park[1] |
| Party |
Candidate |
Votes |
% |
±% |
|
Labour |
Alice Sargent |
3,172 |
85.4 |
+6.9 |
|
Conservative |
Mary Hyatt |
309 |
8.3 |
-2.0 |
|
Social and Liberal Democrats |
John Mayes |
233 |
6.3 |
-4.9 |
| Majority |
2,863 |
77.1 |
+9.8 |
| Turnout |
3.714 |
26.2 |
-5.0 |
|
Labour hold |
Swing |
+4.4 |
|
| Sharrow[1] |
| Party |
Candidate |
Votes |
% |
±% |
|
Labour |
Mike Pye |
2,619 |
72.7 |
+9.4 |
|
Conservative |
Jane Godber |
525 |
14.6 |
-4.2 |
|
Social and Liberal Democrats |
Kathleen Brown |
279 |
7.7 |
-8.0 |
|
Social Democrat |
Patricia Major |
93 |
2.6 |
+2.6 |
|
Communist |
Walter Hartley |
85 |
2.3 |
+0.1 |
| Majority |
2,094 |
58.1 |
+13.6 |
| Turnout |
3,601 |
28.2 |
-5.7 |
|
Labour hold |
Swing |
+6.8 |
|
| South Wortley[1] |
| Party |
Candidate |
Votes |
% |
±% |
|
Social and Liberal Democrats |
Alan Memmott |
2,796 |
39.6 |
-9.1 |
|
Labour |
Roy Darke |
2,708 |
38.3 |
+7.3 |
|
Conservative |
Lynn Wilson |
1,556 |
22.0 |
+1.8 |
| Majority |
88 |
1.3 |
-16.4 |
| Turnout |
7,060 |
38.1 |
-8.8 |
|
Social and Liberal Democrats hold |
Swing |
-8.2 |
|
| Southey Green[1] |
| Party |
Candidate |
Votes |
% |
±% |
|
Labour |
Jimmy Boyce |
3,609 |
88.9 |
+7.6 |
|
Conservative |
Robert Usher |
242 |
5.9 |
+5.9 |
|
Social and Liberal Democrats |
Raymond Mellor |
209 |
5.1 |
-13.6 |
| Majority |
3,367 |
83.0 |
+20.4 |
| Turnout |
4,060 |
32.3 |
-3.6 |
|
Labour hold |
Swing |
+0.8 |
|
| Stocksbridge[1] |
| Party |
Candidate |
Votes |
% |
±% |
|
Social and Liberal Democrats |
June Hibberd-Cooke |
1,636 |
43.7 |
-9.3 |
|
Labour |
Alf Meade |
1,630 |
43.5 |
+7.6 |
|
Conservative |
Stephen Gladman |
399 |
10.6 |
-0.4 |
|
Social Democrat |
George Wilson |
81 |
2.1 |
+2.1 |
| Majority |
6 |
0.2 |
-16.9 |
| Turnout |
3,746 |
35.7 |
-10.6 |
|
Social and Liberal Democrats hold |
Swing |
-8.4 |
|
| Walkley[1] |
| Party |
Candidate |
Votes |
% |
±% |
|
Labour |
Jean Cromar |
3,997 |
74.5 |
+18.8 |
|
Conservative |
Patricia Barnsley |
719 |
13.4 |
+3.2 |
|
Social and Liberal Democrats |
Penelope Smith |
399 |
7.4 |
-26.6 |
|
Social Democrat |
Margaret Ritchie |
249 |
4.6 |
+4.6 |
| Majority |
3,278 |
61.1 |
+39.4 |
| Turnout |
5,364 |
37.1 |
-6.6 |
|
Labour hold |
Swing |
+7.8 |
|
References
|
|---|
| | Metropolitan boroughs | |
|---|
| | District councils (England) | |
|---|
| | District councils (Scotland) |
- Aberdeen
- Angus
- Annandale and Eskdale
- Argyll and Bute
- Badenoch and Strathspey
- Banff and Buchan
- Bearsden and Milngavie
- Berwickshire
- Caithness
- Clackmannan
- Clydebank
- Clydesdale
- Cumbernauld and Kilsyth
- Cumnock and Doon Valley
- Cunninghame
- Dumbarton
- Dundee
- Dunfermline
- East Kilbride
- East Lothian
- Eastwood
- Edinburgh
- Ettrick and Lauderdale
- Falkirk
- Glasgow
- Gordon
- Hamilton
- Inverclyde
- Inverness
- Kilmarnock and Loudoun
- Kincardine and Deeside
- Kirkcaldy
- Kyle and Carrick
- Lochaber
- Midlothian
- Monklands
- Moray
- Motherwell
- Nairn
- Nithsdale
- North East Fife
- Perth and Kinross
- Renfrew
- Ross and Cromarty
- Roxburgh
- Skye and Lochalsh
- Stewartry
- Stirling
- Strathkelvin
- Sutherland
- Tweeddale
- West Lothian
- Wigtown
|
|---|
|