Sheffield City Council election, 1983
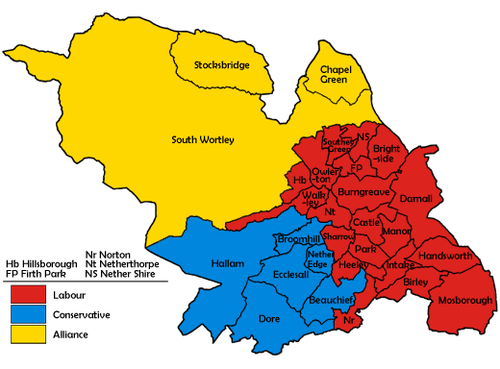
Map of the results for the 1983 Sheffield council election.
Elections to Sheffield City Council were held on 5 May 1983. One third of the council was up for election.
Election result
| Sheffield Local Election Result 1983 | ||||||||||
|---|---|---|---|---|---|---|---|---|---|---|
| Party | Seats | Gains | Losses | Net gain/loss | Seats % | Votes % | Votes | +/− | ||
| Labour | 20 | 1 | 1 | 0 | 71.4 | 51.3 | 88,974 | +3.3% | ||
| Conservative | 6 | 0 | 0 | 0 | 21.4 | 29.4 | 51,041 | +6.1% | ||
| SDP–Liberal Alliance | 2 | 1 | 1 | 0 | 7.1 | 19.1 | 33,226 | -9.2% | ||
| Communist | 0 | 0 | 0 | 0 | 0.0 | 0.1 | 234 | -0.1% | ||
This result had the following consequences for the total number of seats on the Council after the elections:
| Party | Previous council | New council | |||
|---|---|---|---|---|---|
| Labour | 60 | 60 | |||
| Conservatives | 18 | 18 | |||
| SDP–Liberal Alliance | 9 | 9 | |||
| Total | 87 | 87 | |||
| Working majority | 33 | 33 | |||
Ward results
| Beauchief [1] | |||||
|---|---|---|---|---|---|
| Party | Candidate | Votes | % | ±% | |
| Conservative | Cliff Godber | 4,087 | 53.2 | +11.7 | |
| Labour | Val Shepherd | 2,186 | 28.5 | +2.6 | |
| SDP–Liberal Alliance (Social Democratic) | N. Knox | 1,403 | 18.3 | -13.2 | |
| Majority | 2,684 | 24.7 | +14.7 | ||
| Turnout | 7,676 | ||||
| Conservative hold | Swing | +4.5 | |||
| Birley [1] | |||||
|---|---|---|---|---|---|
| Party | Candidate | Votes | % | ±% | |
| Labour | Frank White | 4,130 | 59.7 | +5.1 | |
| Conservative | Shirely Rhodes | 1,776 | 25.7 | +8.1 | |
| SDP–Liberal Alliance (Social Democratic) | Roger Davison | 1,011 | 14.6 | -13.2 | |
| Majority | 2,354 | 34.0 | +7.2 | ||
| Turnout | 6,917 | ||||
| Labour hold | Swing | -1.5 | |||
| Brightside[1] | |||||
|---|---|---|---|---|---|
| Party | Candidate | Votes | % | ±% | |
| Labour | Bill Michie | 3,092 | 67.7 | +6.0 | |
| SDP–Liberal Alliance (Social Democratic) | George Wilson | 805 | 17.6 | -12.3 | |
| Conservative | Ian Saunders | 667 | 14.6 | +6.3 | |
| Majority | 2,287 | 50.1 | +18.3 | ||
| Turnout | 4,564 | ||||
| Labour hold | Swing | +9.1 | |||
| Broomhill[1] | |||||
|---|---|---|---|---|---|
| Party | Candidate | Votes | % | ±% | |
| Conservative | Graham Cheetham | 2,461 | 48.2 | +4.4 | |
| Labour | M. Mitchell | 1,533 | 30.0 | +2.5 | |
| SDP–Liberal Alliance (Social Democratic) | Patrick Smith | 1,110 | 21.7 | -7.0 | |
| Majority | 928 | 18.2 | +3.1 | ||
| Turnout | 5,104 | ||||
| Conservative hold | Swing | +0.9 | |||
| Burngreave[1] | |||||
|---|---|---|---|---|---|
| Party | Candidate | Votes | % | ±% | |
| Labour | James Jamison | 3,508 | 52.6 | +1.8 | |
| SDP–Liberal Alliance (Liberal) | Malcolm Johnson | 2,744 | 41.1 | -1.4 | |
| Conservative | Stuart Dawson | 389 | 5.8 | 0.0 | |
| Communist | Paul Mackey | 32 | 0.5 | -0.2 | |
| Majority | 764 | 11.5 | +3.2 | ||
| Turnout | 6,673 | ||||
| Labour gain from SDP–Liberal Alliance | Swing | +1.6 | |||
| Castle[1] | |||||
|---|---|---|---|---|---|
| Party | Candidate | Votes | % | ±% | |
| Labour | David Skinner | 3,804 | 76.8 | +4.8 | |
| Conservative | Thomas Seaton | 690 | 13.9 | +3.4 | |
| SDP–Liberal Alliance (Social Democratic) | Tony Pearce | 417 | 8.4 | -8.2 | |
| Communist | Violet Gill | 44 | 0.9 | +0.1 | |
| Majority | 3,114 | 62.9 | +7.5 | ||
| Turnout | 4,955 | ||||
| Labour hold | Swing | +0.7 | |||
| Chapel Green[1] | |||||
|---|---|---|---|---|---|
| Party | Candidate | Votes | % | ±% | |
| SDP–Liberal Alliance (Liberal) | Geoffrey Griffiths | 3,954 | 52.8 | +3.3 | |
| Labour | Henry Hanwell | 2,742 | 36.6 | -4.0 | |
| Conservative | J. Edwards | 785 | 10.5 | +0.7 | |
| Majority | 1,212 | 16.2 | +7.3 | ||
| Turnout | 7,481 | ||||
| SDP–Liberal Alliance hold | Swing | +3.6 | |||
| Darnall[1] | |||||
|---|---|---|---|---|---|
| Party | Candidate | Votes | % | ±% | |
| Labour | David Brown | 3,408 | 61.2 | +4.1 | |
| Conservative | Colin Cavill | 1,284 | 23.1 | +4.7 | |
| SDP–Liberal Alliance (Liberal) | Dennis Boothroyd | 871 | 15.6 | -8.8 | |
| Majority | 2,124 | 38.1 | +5.4 | ||
| Turnout | 5,563 | ||||
| Labour hold | Swing | -0.3 | |||
| Dore[1] | |||||
|---|---|---|---|---|---|
| Party | Candidate | Votes | % | ±% | |
| Conservative | Patricia Davey | 4,786 | 59.1 | +7.2 | |
| Labour | A. Morgan | 1,926 | 23.8 | +1.1 | |
| SDP–Liberal Alliance (Social Democratic) | W. Lawrie | 1,382 | 17.1 | -8.3 | |
| Majority | 2,860 | 35.3 | +8.8 | ||
| Turnout | 8,094 | ||||
| Conservative hold | Swing | +3.0 | |||
| Ecclesall[1] | |||||
|---|---|---|---|---|---|
| Party | Candidate | Votes | % | ±% | |
| Conservative | John Neill | 4,761 | 60.4 | +7.7 | |
| SDP–Liberal Alliance (Liberal) | Arthur Fawthrop | 1,895 | 24.0 | -9.4 | |
| Labour | L. Skinner | 1,228 | 15.6 | +1.7 | |
| Majority | 2,866 | 36.4 | +17.1 | ||
| Turnout | 7,884 | ||||
| Conservative hold | Swing | +8.5 | |||
| Firth Park[1] | |||||
|---|---|---|---|---|---|
| Party | Candidate | Votes | % | ±% | |
| Labour | Terry Butler | 3,941 | 72.6 | +0.3 | |
| SDP–Liberal Alliance (Liberal) | D. Wagland | 824 | 15.2 | -3.7 | |
| Conservative | Lorna Banham | 661 | 12.2 | +3.5 | |
| Majority | 3,117 | 57.4 | -4.0 | ||
| Turnout | 5,426 | ||||
| Labour hold | Swing | +2.0 | |||
| Hallam[1] | |||||
|---|---|---|---|---|---|
| Party | Candidate | Votes | % | ±% | |
| Conservative | R. Hobson | 4,319 | 59.4 | +5.8 | |
| SDP–Liberal Alliance (Liberal) | Peter McNutt | 1,739 | 23.9 | -6.3 | |
| Labour | Dorothy Podlesny | 1,205 | 16.6 | +0.5 | |
| Majority | 2,580 | 35.5 | +12.1 | ||
| Turnout | 7,263 | ||||
| Conservative hold | Swing | +6.0 | |||
| Handsworth[1] | |||||
|---|---|---|---|---|---|
| Party | Candidate | Votes | % | ±% | |
| Labour | Elsie Smith | 3,654 | 61.5 | +4.5 | |
| Conservative | Dorothy Kennedy | 1,395 | 23.5 | +6.6 | |
| SDP–Liberal Alliance (Social Democratic) | Hilary Gooch | 892 | 15.0 | -10.9 | |
| Majority | 2,259 | 38.0 | +6.9 | ||
| Turnout | 5,941 | ||||
| Labour hold | Swing | -1.0 | |||
| Heeley[1] | |||||
|---|---|---|---|---|---|
| Party | Candidate | Votes | % | ±% | |
| Labour | S. Clarke | 3,744 | 56.0 | +6.8 | |
| Conservative | A. Byron | 2,047 | 30.6 | +4.5 | |
| SDP–Liberal Alliance (Social Democratic) | Robert Scholfield | 889 | 13.3 | -10.2 | |
| Majority | 1,697 | 25.4 | +2.3 | ||
| Turnout | 6,680 | ||||
| Labour hold | Swing | +1.1 | |||
| Hillsborough[1] | |||||
|---|---|---|---|---|---|
| Party | Candidate | Votes | % | ±% | |
| Labour | D. Morgan | 3,578 | 45.7 | +2.3 | |
| Conservative | William Travis | 2,745 | 35.1 | +10.0 | |
| SDP–Liberal Alliance (Liberal) | Patrick Smith | 1,500 | 19.2 | -12.2 | |
| Majority | 833 | 10.6 | -1.4 | ||
| Turnout | 7,823 | ||||
| Labour hold | Swing | -3.8 | |||
| Intake[1] | |||||
|---|---|---|---|---|---|
| Party | Candidate | Votes | % | ±% | |
| Labour | Mike Bower | 3,684 | 57.6 | +4.0 | |
| Conservative | Farrell Rollitt | 1,754 | 27.4 | +7.5 | |
| SDP–Liberal Alliance (Social Democratic) | A. Lyon | 957 | 14.9 | -11.5 | |
| Majority | 1,930 | 30.2 | +3.0 | ||
| Turnout | 6,395 | ||||
| Labour hold | Swing | -1.7 | |||
| Manor[1] | |||||
|---|---|---|---|---|---|
| Party | Candidate | Votes | % | ±% | |
| Labour | Paul Colk | 3,564 | 79.4 | +8.1 | |
| Conservative | Frank Brookes | 521 | 11.6 | +3.3 | |
| SDP–Liberal Alliance (Social Democratic) | Joan Dallamore | 376 | 8.4 | -11.2 | |
| Communist | B. Oldale | 27 | 0.6 | -0.1 | |
| Majority | 3,043 | 67.8 | +16.1 | ||
| Turnout | 4,488 | ||||
| Labour hold | Swing | +2.4 | |||
| Mosborough[1] | |||||
|---|---|---|---|---|---|
| Party | Candidate | Votes | % | ±% | |
| Labour | S. Dootson | 3,993 | 57.5 | +1.4 | |
| Conservative | Christopher Goldsmith | 1,908 | 27.5 | +9.5 | |
| SDP–Liberal Alliance (Social Democratic) | I. Addison | 1,043 | 15.0 | -10.9 | |
| Majority | 2,085 | 30.0 | -0.2 | ||
| Turnout | 6,944 | ||||
| Labour hold | Swing | -4.0 | |||
| Nether Edge[1] | |||||
|---|---|---|---|---|---|
| Party | Candidate | Votes | % | ±% | |
| Conservative | Paul Verhaert | 2,843 | 44.9 | +2.6 | |
| Labour | J. Hesketh | 2,456 | 38.7 | +3.0 | |
| SDP–Liberal Alliance (Social Democratic) | Paul Metcalfe | 1,037 | 16.3 | -5.6 | |
| Majority | 387 | 6.2 | -0.4 | ||
| Turnout | 6,336 | ||||
| Conservative hold | Swing | -0.2 | |||
| Nether Shire[1] | |||||
|---|---|---|---|---|---|
| Party | Candidate | Votes | % | ±% | |
| Labour | Stephen Jones | 3,706 | 68.3 | +2.3 | |
| SDP–Liberal Alliance (Social Democratic) | Robert Shillito | 907 | 16.7 | -5.9 | |
| Conservative | Patricia Oldfield | 810 | 14.9 | +6.1 | |
| Majority | 2,799 | 51.6 | +8.2 | ||
| Turnout | 5,423 | ||||
| Labour hold | Swing | +4.1 | |||
| Netherthorpe[1] | |||||
|---|---|---|---|---|---|
| Party | Candidate | Votes | % | ±% | |
| Labour | Harold Lambert | 3,231 | 66.8 | +6.6 | |
| Conservative | G. Ranson | 1,007 | 20.8 | +5.5 | |
| SDP–Liberal Alliance (Liberal) | S. Matthewman | 542 | 11.2 | -12.0 | |
| Communist | Gordon Ashberry | 57 | 1.2 | -0.1 | |
| Majority | 2,224 | 46.0 | +9.0 | ||
| Turnout | 4,837 | ||||
| Labour hold | Swing | +0.5 | |||
| Norton[1] | |||||
|---|---|---|---|---|---|
| Party | Candidate | Votes | % | ±% | |
| Labour | B. Glenn | 3,880 | 59.5 | +1.9 | |
| Conservative | B. Farnsworth | 1,907 | 29.2 | +6.6 | |
| SDP–Liberal Alliance (Liberal) | Robert Mumford | 731 | 11.2 | -8.6 | |
| Majority | 1,973 | 30.3 | -4.7 | ||
| Turnout | 6,518 | ||||
| Labour hold | Swing | -2.3 | |||
| Owlerton[1] | |||||
|---|---|---|---|---|---|
| Party | Candidate | Votes | % | ±% | |
| Labour | Helen Jackson | 3,464 | 68.6 | +5.6 | |
| Conservative | George Booth | 963 | 19.0 | +6.6 | |
| SDP–Liberal Alliance (Liberal) | Philip Taylor | 623 | 12.3 | -12.2 | |
| Majority | 2,501 | 49.6 | +11.1 | ||
| Turnout | 5,050 | ||||
| Labour hold | Swing | -0.5 | |||
| Park[1] | |||||
|---|---|---|---|---|---|
| Party | Candidate | Votes | % | ±% | |
| Labour | Vivienne Nicholson | 3,937 | 83.3 | +7.6 | |
| Conservative | Jeremy Richardson | 786 | 16.6 | +7.4 | |
| Majority | 3,151 | 66.7 | +5.0 | ||
| Turnout | 4,723 | ||||
| Labour hold | Swing | +0.1 | |||
| Sharrow[1] | |||||
|---|---|---|---|---|---|
| Party | Candidate | Votes | % | ±% | |
| Labour | Howard Knight | 2,934 | 63.3 | +0.5 | |
| Conservative | Anne Smith | 1,052 | 22.7 | +5.6 | |
| SDP–Liberal Alliance (Social Democratic) | E. Scott | 571 | 12.3 | -6.4 | |
| Communist | M. Heywood | 74 | 1.6 | +0.3 | |
| Majority | 1,882 | 40.6 | -4.5 | ||
| Turnout | 4,631 | ||||
| Labour hold | Swing | -2.5 | |||
| South Wortley[1] | |||||
|---|---|---|---|---|---|
| Party | Candidate | Votes | % | ±% | |
| SDP–Liberal Alliance (Liberal) | David Baker | 3,287 | 38.5 | -5.8 | |
| Conservative | Sylvia Cowley | 2,634 | 30.8 | +5.9 | |
| Labour | Patrick Heath | 2,618 | 30.6 | -0.1 | |
| Majority | 633 | 7.7 | -5.9 | ||
| Turnout | 8,539 | ||||
| SDP–Liberal Alliance gain from Labour | Swing | -5.8 | |||
| Southey Green[1] | |||||
|---|---|---|---|---|---|
| Party | Candidate | Votes | % | ±% | |
| Labour | Sandra Davies | 4,106 | 81.6 | +6.8 | |
| SDP–Liberal Alliance (Social Democratic) | Pamela Brown | 468 | 9.3 | -9.0 | |
| Conservative | Hedley Oldfield | 455 | 9.0 | +2.2 | |
| Majority | 3,638 | 72.3 | +15.8 | ||
| Turnout | 5,029 | ||||
| Labour hold | Swing | +7.9 | |||
| Walkley[1] | |||||
|---|---|---|---|---|---|
| Party | Candidate | Votes | % | ±% | |
| Labour | William Owen | 3,722 | 57.1 | +3.6 | |
| Conservative | Radcliffe Wilson-Wolfe | 1,548 | 23.7 | +7.3 | |
| SDP–Liberal Alliance (Social Democratic) | Dennis Brown | 1,248 | 19.1 | -10.9 | |
| Majority | 2,174 | 33.4 | +9.9 | ||
| Turnout | 6,518 | ||||
| Labour hold | Swing | -1.8 | |||
References
| ||||||||||||||||||
| ||||||||||||||||||||||||||