Sheffield City Council election, 1982
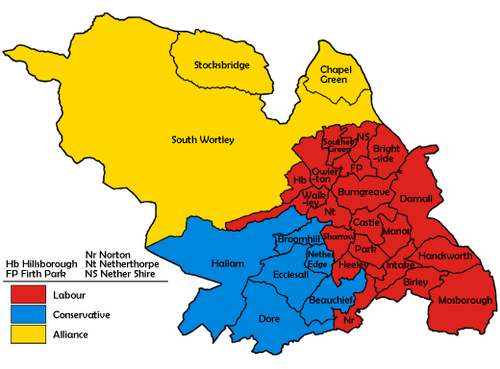
Map of the results for the 1982 Sheffield council election.
Elections to Sheffield City Council were held on 6 May 1982. One third of the council was up for election.
Election result
| Sheffield Local Election Result 1982 |
| Party |
Seats |
Gains |
Losses |
Net gain/loss |
Seats % |
Votes % |
Votes |
+/− |
| |
Labour |
20 |
1 |
1 |
0 |
68.9 |
48.0 |
79,719 |
-4.9% |
| |
Conservative |
6 |
0 |
0 |
0 |
20.7 |
23.3 |
38,765 |
-10.7% |
| |
SDP–Liberal Alliance |
3 |
1 |
1 |
0 |
10.3 |
28.3 |
46,997 |
+16.0% |
| |
Communist |
0 |
0 |
0 |
0 |
0.0 |
0.2 |
388 |
-0.4% |
| |
Independent |
0 |
0 |
0 |
0 |
0.0 |
0.1 |
163 |
+0.1% |
| |
Workers Revolutionary |
0 |
0 |
0 |
0 |
0.0 |
0.0 |
6 |
+0.0% |
This result had the following consequences for the total number of seats on the Council after the elections:
| Party |
Previous council |
New council |
|
Labour |
60 |
60 |
|
Conservatives |
18 |
18 |
|
SDP–Liberal Alliance |
9 |
9 |
| Total |
87 |
87 |
| Working majority |
33 |
33 |
Ward results
| Birley [1] |
| Party |
Candidate |
Votes |
% |
±% |
|
Labour |
John Marshall |
3,420 |
54.6 |
-11.9 |
|
SDP–Liberal Alliance |
Roger Davison |
1,740 |
27.8 |
+27.8 |
|
Conservative |
Glenda Leitch |
1,104 |
17.6 |
-15.9 |
| Majority |
1,680 |
26.8 |
-6.2 |
| Turnout |
6,264 |
|
|
|
Labour hold |
Swing |
-19.8 |
|
| Brightside[1] |
| Party |
Candidate |
Votes |
% |
±% |
|
Labour |
Rae Whitfield |
2,919 |
61.7 |
-14.1 |
|
SDP–Liberal Alliance |
George Wilson |
1,417 |
29.9 |
+29.9 |
|
Conservative |
Victoria Sellers |
393 |
8.3 |
-15.8 |
| Majority |
1,502 |
31.8 |
-19.9 |
| Turnout |
4,729 |
|
|
|
Labour hold |
Swing |
-22.0 |
|
| Broomhill[1] |
| Party |
Candidate |
Votes |
% |
±% |
|
Conservative |
Marvyn Moore |
2,058 |
43.8 |
-6.5 |
|
SDP–Liberal Alliance |
Martin Hayes-Allen |
1,346 |
28.7 |
+3.7 |
|
Labour |
Brian Fischer |
1,290 |
27.5 |
+2.8 |
| Majority |
712 |
15.1 |
-10.2 |
| Turnout |
4,694 |
|
|
|
Conservative hold |
Swing |
-5.1 |
|
| Castle[1] |
| Party |
Candidate |
Votes |
% |
±% |
|
Labour |
Peter Horton |
3,252 |
72.0 |
-3.0 |
|
SDP–Liberal Alliance |
Tony Pearce |
752 |
16.6 |
+11.0 |
|
Conservative |
Joan Graham |
474 |
10.5 |
-6.0 |
|
Communist |
Violet Gill |
36 |
0.8 |
-2.0 |
| Majority |
2,500 |
55.4 |
-3.1 |
| Turnout |
4,514 |
|
|
|
Labour hold |
Swing |
-7.0 |
|
| Chapel Green[1] |
| Party |
Candidate |
Votes |
% |
±% |
|
SDP–Liberal Alliance |
Roger Wilson |
3,236 |
49.5 |
-11.5 |
|
Labour |
Henry Hanwell |
2,658 |
40.6 |
+9.5 |
|
Conservative |
Francis Brookes |
645 |
9.8 |
+2.0 |
| Majority |
578 |
8.9 |
-21.0 |
| Turnout |
6,539 |
|
|
|
SDP–Liberal Alliance hold |
Swing |
-10.5 |
|
| Darnall[1] |
| Party |
Candidate |
Votes |
% |
±% |
|
Labour |
Roy Munn |
2,770 |
57.1 |
-5.6 |
|
SDP–Liberal Alliance |
Dennis Boothroyd |
1,185 |
24.4 |
+12.7 |
|
Conservative |
Colin Cavill |
895 |
18.4 |
-7.2 |
| Majority |
1,585 |
32.7 |
-4.4 |
| Turnout |
4,850 |
|
|
|
Labour hold |
Swing |
-9.1 |
|
| Dore[1] |
| Party |
Candidate |
Votes |
% |
±% |
|
Conservative |
Jack Joel Thompson |
3,870 |
51.9 |
-12.0 |
|
SDP–Liberal Alliance |
Edward Mullin |
1,894 |
25.4 |
+15.8 |
|
Labour |
Donald Lemons |
1,695 |
22.7 |
-3.8 |
| Majority |
1,976 |
26.5 |
-10.9 |
| Turnout |
7,459 |
|
|
|
Conservative hold |
Swing |
-13.9 |
|
| Ecclesall[1] |
| Party |
Candidate |
Votes |
% |
±% |
|
Conservative |
Jonathan Freeman |
3,827 |
52.7 |
-17.1 |
|
SDP–Liberal Alliance |
Arthur Fawthrop |
2,423 |
33.4 |
+19.1 |
|
Labour |
Anthony Sweeney |
1,009 |
13.9 |
-1.9 |
| Majority |
1,404 |
19.3 |
-34.7 |
| Turnout |
7,259 |
|
|
|
Conservative hold |
Swing |
-18.1 |
|
| Firth Park[1] |
| Party |
Candidate |
Votes |
% |
±% |
|
Labour |
Joan Barton |
3,710 |
72.3 |
-8.8 |
|
SDP–Liberal Alliance |
Christopher Fenn |
972 |
18.9 |
+11.0 |
|
Conservative |
Lorna Banham |
447 |
8.7 |
-3.3 |
| Majority |
2,738 |
53.4 |
-15.7 |
| Turnout |
5,129 |
|
|
|
Labour hold |
Swing |
-9.9 |
|
| Hallam[1] |
| Party |
Candidate |
Votes |
% |
±% |
|
Conservative |
Gordon Wragg |
3,620 |
53.6 |
-13.7 |
|
SDP–Liberal Alliance |
Paul Metcalfe |
2,036 |
30.2 |
+18.0 |
|
Labour |
Dorothy Podlesny |
1,090 |
16.1 |
-4.4 |
| Majority |
1,584 |
23.4 |
-23.4 |
| Turnout |
6,746 |
|
|
|
Conservative hold |
Swing |
-15.8 |
|
| Handsworth[1] |
| Party |
Candidate |
Votes |
% |
±% |
|
Labour |
Leslie Mose |
3,092 |
57.0 |
-13.3 |
|
SDP–Liberal Alliance |
Hilary Gooch |
1,407 |
25.9 |
+25.9 |
|
Conservative |
Bernard Kennedy |
919 |
16.9 |
-12.7 |
| Majority |
1,685 |
31.1 |
-9.6 |
| Turnout |
5,418 |
|
|
|
Labour hold |
Swing |
-19.6 |
|
| Hillsborough[1] |
| Party |
Candidate |
Votes |
% |
±% |
|
Labour |
Gordon Mills |
3,363 |
43.4 |
-9.9 |
|
SDP–Liberal Alliance |
June Hibberd |
2,432 |
31.4 |
+31.4 |
|
Conservative |
William Travis |
1,943 |
25.1 |
-21.6 |
| Majority |
931 |
12.0 |
+5.4 |
| Turnout |
7,738 |
|
|
|
Labour hold |
Swing |
-20.6 |
|
| Intake[1] |
| Party |
Candidate |
Votes |
% |
±% |
|
Labour |
David Green |
3,174 |
53.6 |
-6.2 |
|
SDP–Liberal Alliance |
Ted Lyon |
1,560 |
26.4 |
+18.5 |
|
Conservative |
Farrell Rollitt |
1,181 |
19.9 |
-12.3 |
| Majority |
1,614 |
27.2 |
-0.4 |
| Turnout |
5,915 |
|
|
|
Labour hold |
Swing |
-12.3 |
|
| Manor[1] |
| Party |
Candidate |
Votes |
% |
±% |
|
Labour |
Howard Capelin |
2,912 |
71.3 |
-4.8 |
|
SDP–Liberal Alliance |
Joan Dallamore |
801 |
19.6 |
+13.4 |
|
Conservative |
Simon Briggs |
341 |
8.3 |
-5.9 |
|
Communist |
Arnold Archer |
28 |
0.7 |
-2.8 |
| Majority |
2,111 |
51.7 |
-9.1 |
| Turnout |
4,082 |
|
|
|
Labour hold |
Swing |
-9.1 |
|
| Mosborough[1] |
| Party |
Candidate |
Votes |
% |
±% |
|
Labour |
Sam Wall |
3,293 |
56.1 |
-15.8 |
|
SDP–Liberal Alliance |
Dennis Vernals |
1,519 |
25.9 |
+25.9 |
|
Conservative |
Christopher Goldsmith |
1,058 |
18.0 |
-10.0 |
| Majority |
1,774 |
30.2 |
-13.7 |
| Turnout |
5,870 |
|
|
|
Labour hold |
Swing |
-20.8 |
|
| Nether Edge[1] |
| Party |
Candidate |
Votes |
% |
±% |
|
Conservative |
Christine Smith |
2,434 |
42.3 |
-11.4 |
|
Labour |
Marilyn Tsiorvas |
2,054 |
35.7 |
-0.5 |
|
SDP–Liberal Alliance |
David Tummon |
1,258 |
21.9 |
+11.9 |
| Majority |
380 |
6.6 |
-10.9 |
| Turnout |
5,746 |
|
|
|
Conservative hold |
Swing |
-5.4 |
|
| Nether Shire[1] |
| Party |
Candidate |
Votes |
% |
±% |
|
Labour |
Alan Wigfield |
3,442 |
66.0 |
-11.1 |
|
SDP–Liberal Alliance |
Robert Shillito |
1,179 |
22.6 |
+22.6 |
|
Conservative |
Patricia Oldfield |
462 |
8.8 |
-11.1 |
|
Independent |
Joe Williams |
88 |
1.7 |
+1.7 |
|
Communist |
Paul Mackey |
41 |
0.8 |
-2.1 |
| Majority |
2,263 |
43.4 |
-13.8 |
| Turnout |
5,212 |
|
|
|
Labour hold |
Swing |
-16.8 |
|
| Netherthorpe[1] |
| Party |
Candidate |
Votes |
% |
±% |
|
Labour |
John Laurent |
2,865 |
60.2 |
-10.6 |
|
SDP–Liberal Alliance |
Peter Stubbs |
1,106 |
23.2 |
+19.6 |
|
Conservative |
Radcliffe Wilson-Wolfe |
727 |
15.3 |
-10.2 |
|
Communist |
Valerie Seabright |
62 |
1.3 |
+1.3 |
| Majority |
1,759 |
37.0 |
-8.3 |
| Turnout |
4,760 |
|
|
|
Labour hold |
Swing |
-15.1 |
|
| Norton[1] |
| Party |
Candidate |
Votes |
% |
±% |
|
Labour |
James Moore |
3,419 |
57.6 |
-4.0 |
|
Conservative |
Paul Mort |
1,341 |
22.6 |
-7.6 |
|
SDP–Liberal Alliance |
Robert Mumford |
1,173 |
19.8 |
+11.6 |
| Majority |
2,078 |
35.0 |
+3.6 |
| Turnout |
5,933 |
|
|
|
Labour hold |
Swing |
+1.8 |
|
| Owlerton[1] |
| Party |
Candidate |
Votes |
% |
±% |
|
Labour |
George Mathews |
3,000 |
63.0 |
-11.6 |
|
SDP–Liberal Alliance |
Robert Scholfield |
1,168 |
24.5 |
+24.5 |
|
Conservative |
Dorothy Kennedy |
591 |
12.4 |
-10.9 |
| Majority |
1,832 |
38.5 |
-12.8 |
| Turnout |
4,759 |
|
|
|
Labour hold |
Swing |
-18.0 |
|
| Park[1] |
| Party |
Candidate |
Votes |
% |
±% |
|
Labour |
Doris Mulhearn |
3,253 |
75.7 |
-8.5 |
|
SDP–Liberal Alliance |
Stephen Truslove |
601 |
14.0 |
+14.0 |
|
Conservative |
Thomas Seaton |
395 |
9.2 |
-3.8 |
|
Communist |
David Bruce |
45 |
1.0 |
-1.8 |
| Majority |
2,652 |
61.7 |
-9.5 |
| Turnout |
4,294 |
|
|
|
Labour hold |
Swing |
-11.2 |
|
| Sharrow[1] |
| Party |
Candidate |
Votes |
% |
±% |
|
Labour |
Tony Tigwell |
2,993 |
62.8 |
-1.8 |
|
SDP–Liberal Alliance |
Christopher Walker |
892 |
18.7 |
+18.7 |
|
Conservative |
George Booth |
815 |
17.1 |
-14.7 |
|
Communist |
Brian Turley |
62 |
1.3 |
-2.2 |
| Majority |
2,101 |
44.1 |
+11.3 |
| Turnout |
4,762 |
|
|
|
Labour hold |
Swing |
-10.2 |
|
| South Wortley[1] |
| Party |
Candidate |
Votes |
% |
±% |
|
SDP–Liberal Alliance |
Philip Howson |
3,774 |
44.3 |
+18.3 |
|
Labour |
Ruth Blunkett |
2,616 |
30.7 |
-8.2 |
|
Conservative |
Sylvia Cowley |
2,123 |
24.9 |
-10.1 |
| Majority |
1,158 |
13.6 |
+10.3 |
| Turnout |
8,513 |
|
|
|
SDP–Liberal Alliance gain from Labour |
Swing |
+13.2 |
|
| Southey Green[1] |
| Party |
Candidate |
Votes |
% |
±% |
|
Labour |
John Stent |
3,488 |
74.8 |
-12.9 |
|
SDP–Liberal Alliance |
Stewart Dalton |
854 |
18.3 |
+18.3 |
|
Conservative |
Hedley Oldfield |
318 |
6.8 |
-5.4 |
| Majority |
2,634 |
56.5 |
-19.0 |
| Turnout |
4,660 |
|
|
|
Labour hold |
Swing |
-15.6 |
|
| Stocksbridge[1] |
| Party |
Candidate |
Votes |
% |
±% |
|
SDP–Liberal Alliance |
Malcolm Brelsford |
2,166 |
44.7 |
-7.5 |
|
Labour |
Ann Proctor |
1,759 |
36.3 |
+11.8 |
|
Conservative |
Barrie Jones |
922 |
19.0 |
-4.3 |
| Majority |
407 |
8.4 |
-19.3 |
| Turnout |
4,847 |
|
|
|
SDP–Liberal Alliance hold |
Swing |
-9.6 |
|
| Walkley[1] |
| Party |
Candidate |
Votes |
% |
±% |
|
Labour |
Peter Wood |
3,444 |
53.5 |
-12.4 |
|
SDP–Liberal Alliance |
Jane Padget |
1,930 |
30.0 |
+30.0 |
|
Conservative |
Stuart Dawson |
1,059 |
16.4 |
-17.6 |
| Majority |
1,514 |
23.5 |
-8.4 |
| Turnout |
6,433 |
|
|
|
Labour hold |
Swing |
-21.2 |
|
References
|
|---|
| | London boroughs | |
|---|
| | Metropolitan boroughs | |
|---|
| | District councils (England) |
- Amber Valley
- Barrow-in-Furness
- Basildon
- Basingstoke and Deane
- Bassetlaw
- Blackburn
- Brentwood
- Broadland
- Broxbourne
- Burnley
- Cambridge
- Cherwell
- Chester
- Chorley
- Colchester
- Congleton
- Craven
- Crewe and Nantwich
- Daventry
- Derby
- East Devon
- Eastbourne
- Eastleigh
- Ellesmere Port and Neston
- Elmbridge
- Epping Forest
- Fareham
- Gloucester
- Gosport
- Great Yarmouth
- Halton
- Harlow
- Hartlepool
- Hart
- Hastings
- Havant
- Hertsmere
- Hull
- Huntingdon
- Hyndburn
- Lincoln
- Macclesfield
- Maidstone
- Milton Keynes
- Mole Valley
- North Hertfordshire
- Norwich
- Nuneaton and Bedworth
- Oadby and Wigston
- Oxford
- Pendle
- Penwith
- Preston
- Purbeck
- Reigate and Banstead
- Rochford
- Rossendale
- Rugby
- Runnymede
- Rushmoor
- South Bedfordshire
- South Cambridgeshire
- South Lakeland
- Southampton
- Southend-on-Sea
- St Albans
- Stevenage
- Stratford-on-Avon
- Swale
- Tandridge
- Three Rivers
- Thurrock
- Tonbridge and Malling
- Tunbridge Wells
- Watford
- Welwyn Hatfield
- West Lancashire
- West Lindsey
- West Oxfordshire
- Weymouth and Portland
- Winchester
- Woking
- Wokingham
- Worcester
- Wyre Forest
- York
|
|---|
| | Regional councils |
- Borders
- Central
- Dumfries and Galloway
- Fife
- Grampian
- Highland
- Lothian
- Orkney
- Shetland
- Strathclyde
- Tayside
- Western Isles
|
|---|
| | Ad-hoc election | |
|---|
|