Semivariance
- For the measure of downside risk, see Variance#Semivariance
In spatial statistics, the empirical semivariance is described by
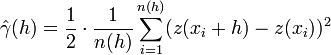
where z is a datum at a particular location, h is the distance between ordered data, and n(h) is the number of paired data at a distance of h. The semivariance is half the variance of the increments 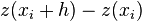 , but the whole variance of z-values at given separation distance h (Bachmaier and Backes, 2008).
A plot of semivariances versus distances between ordered data in a graph is known as a semivariogram rather than a variogram. Many authors call  a variogram, others use the terms variogram and semivariogram synonymously. However, Bachmaier and Backes (2008), who discussed this confusion, have shown that
  should be called a variogram, terms like semivariogram or semivariance should be avoided.
See also
- Variance
- Sampling variogram
- Geostatistics
- Kriging
- Post-Modern Portfolio Theory
References
- Bachmaier, M and Backes, M, 2008, "Variogram or semivariogram? Understanding the variances in a variogram". Article doi:10.1007/s11119-008-9056-2, Precision Agriculture, Springer-Verlag, Berlin, Heidelberg, New York.
- Clark, I, 1979, Practical Geostatistics, Applied Science Publishers
- David, M, 1978, Geostatistical Ore Reserve Estimation, Elsevier Publishing
- Hald, A, 1952, Statistical Theory with Engineering Applications, John Wiley & Sons, New York
- Journel, A G and Huijbregts, Ch J, 1978 Mining Geostatistics, Academic Press
External links
- Shine, J.A., Wakefield, G.I.: A comparison of supervised imagery classification using analyst-chosen and geostatistically-chosen training sets, 1999, http://www.geovista.psu.edu/sites/geocomp99/Gc99/044/gc_044.htm
| ||||||||||||||||||||||||||||||||||||||||||||||||||||||||||||||||||||||||||||||||||||||||||||||||||||||||||||||||||||||||||||||||||||||||||||||||||||||||||||||||||||||||||||||||||||||||||||||||||||||||||||||||||||||