Self-similarity matrix
In data analysis, the self-similarity matrix is a graphical representation of similar sequences in a data series.
Similarity can be explained by different measures, like spatial distance (distance matrix), correlation, or comparison of local histograms or spectral properties (e.g. IXEGRAM[1]). This technique is also applied for the search of a given pattern in a long data series as in gene matching. A similarity plot can be the starting point for dot plots or recurrence plots.
Definition
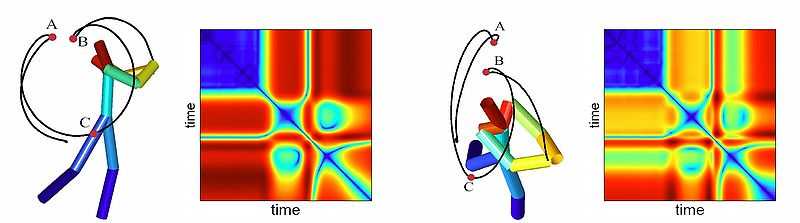
To construct a self-similarity matrix, one first transforms a data series into an ordered sequences of feature vectors 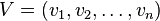 , where each vector
  describes the relevant features of a data series in a given local interval. Then the self-similarity matrix is formed by computing the similarity of pairs of feature vectors

where  is a function measuring the similarity of the two vectors, for instance, the inner product
 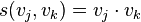 . Then similar segments of feature vectors will show up as path of high similarity along diagonals of the matrix.[2]
Example
See also
References
- ↑ M. A. Casey; A. Westner (July -00 2000). "Separation of mixed audio sources by independent subspace analysis". Proc. Int. Comput. Music Conf. Retrieved 2013-11-19. Check date values in:
|date=(help) - ↑ Müller, Meinard; Michael Clausen (2007). "Transposition-invariant self-similarity matrices". Proceedings of the 8th International Conference on Music Information Retrieval (ISMIR 2007): 47–50. Retrieved 2013-11-19.
- ↑ I.N. Junejo, E. Dexter, I. Laptev, Patrick Pérez (2008). "Cross-View Action Recognition from Temporal Self-Similarities". In Proc. European Conference on Computer Vision (ECCV), Marseille, France. doi:10.1007/978-3-540-88688-4_22.
- N. Marwan, M. C. Romano, M. Thiel, J. Kurths (2007). "Recurrence Plots for the Analysis of Complex Systems". Physics Reports 438 (5-6): 237. Bibcode:2007PhR...438..237M. doi:10.1016/j.physrep.2006.11.001.
- J. Foote (1999). "Visualizing Music and Audio using Self-Similarity". In: Proceedings of ACM Multimedia '99, Orlando, Florida. doi:10.1145/319463.319472.
- M. A. Casey (2002). B.S. Manjunath, P. Salembier and T. Sikora, ed. "Sound Classification and Similarity Tools". Introduction to MPEG-7: Multimedia Content Description Language (J. Wiley): 309–323. ISBN 978-0471486787.