Sea level
Sea level is generally used to refer to mean sea level (MSL), an average level for the surface of one or more of Earth's oceans from which heights such as elevations may be measured. MSL is a type of vertical datum – a standardised geodetic reference point – that is used, for example, as a chart datum in cartography and marine navigation, or, in aviation, as the standard sea level at which atmospheric pressure is measured in order to calibrate altitude and, consequently, aircraft flight levels. A common and relatively straightforward mean sea-level standard is the midpoint between a mean low and mean high tide at a particular location.[1]
Sea levels can be affected by many factors and are known to have varied greatly over geological time scales. The careful measurement of variations in mean sea levels can offer information about climate change and has been interpreted as evidence supporting the view that the current rise in sea levels is an indicator of global warming.[2]
The term above sea level generally refers actually to above mean sea level (AMSL).
Measurement
Precise determination of a "mean sea level" is a difficult problem because of the many factors that affect sea level.[3] Sea level varies quite a lot on several scales of time and distance. This is because the sea is in constant motion, affected by the tides, wind, atmospheric pressure, local gravitational differences, temperature, salinity and so forth. The best one can do is to pick a spot and calculate the mean sea level at that point and use it as a datum. For example, a period of 19 years of hourly level observations may be averaged and used to determine the mean sea level at some measurement point.
To an operator of a tide gauge, MSL means the "still water level"—the level of the sea with motions such as wind waves averaged out—averaged over a period of time such that changes in sea level, e.g., due to the tides, also get averaged out. One measures the values of MSL in respect to the land. Hence a change in MSL can result from a real change in sea level, or from a change in the height of the land on which the tide gauge operates.
In the UK, the Ordnance Datum (the 0 metres height on UK maps) is the mean sea level measured at Newlyn in Cornwall between 1915 and 1921. Prior to 1921, the datum was MSL at the Victoria Dock, Liverpool.
In France, the Marégraphe in Marseilles measures continuously the sea level since 1883 and offers the longest collapsed data about the sea level. It is used for a part of continental Europe and main part of Africa as official sea level.Elsewhere in Europe vertical elevation references (European Vertical Reference System) are made to the Amsterdam Pile elevation, which dates back to the 1690s.
Satellite altimeters have been making precise measurements of sea level since the launch of TOPEX/Poseidon in 1992. A joint mission of NASA and CNES, TOPEX/Poseidon was followed by Jason-1 in 2001 and the Ocean Surface Topography Mission on the Jason-2 satellite in 2008.
Height above mean sea level

Height above mean sea level (AMSL) is the elevation (on the ground) or altitude (in the air) of an object, relative to the average sea level datum. AMSL height is used extensively in radio (both in broadcasting and other telecommunications uses) to determine the coverage area a station will be able to reach. It is also used in aviation, where some heights are recorded and reported with respect to mean sea level (MSL) (contrast with flight level), and in the atmospheric sciences, and land surveying. An alternative is to base height measurements on an ellipsoid of the entire earth, which is what systems such as GPS do. In aviation, the ellipsoid known as World Geodetic System 84 is increasingly used to define heights, however, differences up to 100 metres (328 feet) exist between this ellipsoid height and mean tidal height. The alternative is to use a geoid based vertical datum such as NAVD88.
When referring to geographic features such as mountains on a topographic map, variations in elevation are shown by contour lines. The elevation of a mountain denotes the highest point or summit and is typically illustrated as a small circle on a topo map with the AMSL height shown in either metres or feet or both.
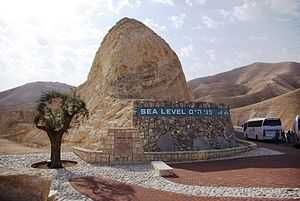
In the rare case that a location is below sea level, the elevation AMSL is negative. For one such case see Amsterdam Airport Schiphol.
Difficulties in utilization
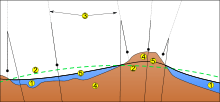
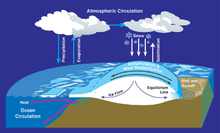
To extend this definition far from the sea means comparing the local height of the mean sea surface with a "level" reference surface, or datum, called the geoid. In a state of rest or absence of external forces, the mean sea level would coincide with this geoid surface, being an equipotential surface of the Earth's gravitational field. In reality, due to currents, air pressure variations, temperature and salinity variations, etc., this does not occur, not even as a long-term average. The location-dependent, but persistent in time, separation between mean sea level and the geoid is referred to as (stationary) ocean surface topography. It varies globally in a range of ± 2 m.
Historically, adjustments were made to sea-level measurements to take into account the effects of the 235 lunar month Metonic cycle and the 223-month eclipse cycle on the tides.
Sea level and dry land

Several terms are used to describe the changing relationships between sea level and dry land. When the term "relative" is used, it means change relative to a fixed point in the sediment pile. The term "eustatic" refers to global changes in sea level relative to a fixed point, such as the centre of the earth, for example as a result of melting ice-caps. The term "steric" refers to global changes in sea level due to thermal expansion and salinity variations. The term "isostatic" refers to changes in the level of the land relative to a fixed point in the earth, possibly due to thermal buoyancy or tectonic effects; it implies no change in the volume of water in the oceans. The melting of glaciers at the end of ice ages is one example of eustatic sea level rise. The subsidence of land due to the withdrawal of groundwater is an isostatic cause of relative sea level rise. Paleoclimatologists can track sea level by examining the rocks deposited along coasts that are very tectonically stable, like the east coast of North America. Areas like volcanic islands are experiencing relative sea level rise as a result of isostatic cooling of the rock which causes the land to sink.
On other planets that lack a liquid ocean, planetologists can calculate a "mean altitude" by averaging the heights of all points on the surface. This altitude, sometimes referred to as a "sea level", serves equivalently as a reference for the height of planetary features.
Sea level change
Local and eustatic sea level
Local mean sea level (LMSL) is defined as the height of the sea with respect to a land benchmark, averaged over a period of time (such as a month or a year) long enough that fluctuations caused by waves and tides are smoothed out. One must adjust perceived changes in LMSL to account for vertical movements of the land, which can be of the same order (mm/yr) as sea level changes. Some land movements occur because of isostatic adjustment of the mantle to the melting of ice sheets at the end of the last ice age. The weight of the ice sheet depresses the underlying land, and when the ice melts away the land slowly rebounds. Changes in ground-based ice volume also affect local and regional sea levels by the readjustment of the geoid and true polar wander. Atmospheric pressure, ocean currents and local ocean temperature changes can affect LMSL as well.
Eustatic change (as opposed to local change) results in an alteration to the global sea levels due to changes in either the volume of water in the world oceans or net changes in the volume of the ocean basins.[4]
Short term and periodic changes
There are many factors which can produce short-term (a few minutes to 14 months) changes in sea level.
| Periodic sea level changes | ||
|---|---|---|
| Diurnal and semidiurnal astronomical tides | 12–24 h P | 0.2–10+ m |
| Long-period tides | ||
| Rotational variations (Chandler wobble) | 14 month P | |
| Meteorological and oceanographic fluctuations | ||
| Atmospheric pressure | Hours to months | −0.7 to 1.3 m |
| Winds (storm surges) | 1–5 days | Up to 5 m |
| Evaporation and precipitation (may also follow long-term pattern) | Days to weeks | |
| Ocean surface topography (changes in water density and currents) | Days to weeks | Up to 1 m |
| El Niño/southern oscillation | 6 mo every 5–10 yr | Up to 0.6 m |
| Seasonal variations | ||
| Seasonal water balance among oceans (Atlantic, Pacific, Indian) | ||
| Seasonal variations in slope of water surface | ||
| River runoff/floods | 2 months | 1 m |
| Seasonal water density changes (temperature and salinity) | 6 months | 0.2 m |
| Seiches | ||
| Seiches (standing waves) | Minutes to hours | Up to 2 m |
| Earthquakes | ||
| Tsunamis (generate catastrophic long-period waves) | Hours | Up to 10 m |
| Abrupt change in land level | Minutes | Up to 10 m |
Long term changes
Various factors affect the volume or mass of the ocean, leading to long-term changes in eustatic sea level. The primary influence is that of temperature on seawater density and the amounts of water retained in rivers, aquifers, lakes, glaciers, polar ice caps and sea ice. Over much longer geological timescales, changes in the shape of the oceanic basins and in land/sea distribution will also affect sea level.
Observational and modelling studies of mass loss from glaciers and ice caps indicate a contribution to sea-level rise of 0.2 to 0.4 mm/yr averaged over the 20th century. Over this last million years, whereas it was higher most of the time before then, sea level was lower than today.
Sea level reached 120 meters below current sea level at the Last Glacial Maximum 19,000–20,000 years ago.
Glaciers and ice caps
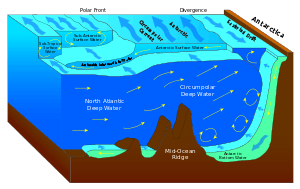
Each year about 8 mm (0.3 inches) of water from the entire surface of the oceans falls onto the Antarctica and Greenland ice sheets as snowfall. If no ice returned to the oceans, sea level would drop 8 mm (0.3 in) every year. To a first approximation, the same amount of water appeared to return to the ocean in icebergs and from ice melting at the edges. Scientists previously had estimated which is greater, ice going in or coming out, called the mass balance, important because it causes changes in global sea level. High-precision gravimetry from satellites in low-noise flight has since determined that in 2006, the Greenland and Antarctic ice sheets experienced a combined mass loss of 475 ± 158 Gt/yr, equivalent to 1.3 ± 0.4 mm/yr sea level rise. Notably, the acceleration in ice sheet loss from 1988–2006 was 21.9 ± 1 Gt/yr² for Greenland and 14.5 ± 2 Gt/yr² for Antarctica, for a combined total of 36.3 ± 2 Gt/yr². This acceleration is 3 times larger than for mountain glaciers and ice caps (12 ± 6 Gt/yr²).[5]
Ice shelves float on the surface of the sea and, if they melt, to first order they do not change sea level. Likewise, the melting of the northern polar ice cap which is composed of floating pack ice would not significantly contribute to rising sea levels. However, because floating ice pack is lower in salinity than seawater, their melting would cause a very small increase in sea levels, so small that it is generally neglected.
- Scientists previously lacked knowledge of changes in terrestrial storage of water. Surveying of water retention by soil absorption and by artificial reservoirs ("impoundment") show that a total of about 10,800 cubic kilometres (2,591 cubic miles) of water (just under the size of Lake Huron) has been impounded on land to date. Such impoundment masked about 30 mm (1.2 in) of sea level rise in that time.[6]
- Conversely estimates of excess global groundwater extraction during 1900–2008 totals ∼4,500 km3, equivalent to a sea-level rise of 12.6 mm (0.50 in) (>6% of the total). Furthermore, the rate of groundwater depletion has increased markedly since about 1950, with maximum rates occurring during the most recent period (2000–2008), when it averaged ∼145 km3/yr (equivalent to 0.40 mm/yr of sea-level rise, or 13% of the reported rate of 3.1 mm/yr during this recent period).[7]
- If small glaciers and polar ice caps on the margins of Greenland and the Antarctic Peninsula melt, the projected rise in sea level will be around 0.5 m (1 ft 7.7 in). Melting of the Greenland ice sheet would produce 7.2 m (23.6 ft) of sea-level rise, and melting of the Antarctic ice sheet would produce 61.1 m (200.5 ft) of sea level rise.[8] The collapse of the grounded interior reservoir of the West Antarctic Ice Sheet would raise sea level by 5 m (16.4 ft) - 6 m (19.7 ft).[9]
- The snowline altitude is the altitude of the lowest elevation interval in which minimum annual snow cover exceeds 50%. This ranges from about 5,500 metres (18,045 feet) above sea-level at the equator down to sea level at about 70° N&S latitude, depending on regional temperature amelioration effects. Permafrost then appears at sea level and extends deeper below sea level polewards.
- As most of the Greenland and Antarctic ice sheets lie above the snowline and/or base of the permafrost zone, they cannot melt in a timeframe much less than several millennia; therefore it is likely that they will not, through melting, contribute significantly to sea level rise in the coming century. They can, however, do so through acceleration in flow and enhanced iceberg calving.
- Climate changes during the 20th century are estimated from modelling studies to have led to contributions of between −0.2 and 0.0 mm/yr from Antarctica (the results of increasing precipitation) and 0.0 to 0.1 mm/yr from Greenland (from changes in both precipitation and runoff).
- Estimates suggest that Greenland and Antarctica have contributed 0.0 to 0.5 mm/yr over the 20th century as a result of long-term adjustment to the end of the last ice age.
The current rise in sea level observed from tide gauges, of about 1.8 mm/yr, is within the estimate range from the combination of factors above[10] but active research continues in this field. The terrestrial storage term, thought to be highly uncertain, is no longer positive, and shown to be quite large.
Geological influences

At times during Earth's long history, the configuration of the continents and sea floor have changed due to plate tectonics. This affects global sea level by altering the depths of various ocean basins and also by altering glacier distribution with resulting changes in glacial-interglacial cycles. Changes in glacial-interglacial cycles are at least partially affected by changes glacier distributions across the Earth.
The depth of the ocean basins is a function of the age of oceanic lithosphere (the tectonic plates beneath the floors of the world's oceans). As older plates age, they becomes denser and sink, allowing newer plates to rise and take their place. Therefore, a configuration with many small oceanic plates that rapidly recycle the oceanic lithosphere would produce shallower ocean basins and (all other things being equal) higher sea levels. A configuration with fewer plates and more cold, dense oceanic lithosphere, on the other hand, would result in deeper ocean basins and lower sea levels.
When there was much continental crust near the poles, the rock record shows unusually low sea levels during ice ages, because there was much polar land mass on which snow and ice could accumulate. During times when the land masses clustered around the equator, ice ages had much less effect on sea level.
Over most of geologic time, the long-term mean sea level has been higher than today (see graph above). Only at the Permian-Triassic boundary ~250 million years ago was the long-term mean sea level lower than today. Long term changes in the mean sea level are the result of changes in the oceanic crust, with a downward trend expected to continue in the very long term.[11]
During the glacial-interglacial cycles over the past few million years, the mean sea level has varied by somewhat more than a hundred metres. This is primarily due to the growth and decay of ice sheets (mostly in the northern hemisphere) with water evaporated from the sea.
The Mediterranean Basin's gradual growth as the Neotethys basin, begun in the Jurassic, did not suddenly affect ocean levels. While the Mediterranean was forming during the past 100 million years, the average ocean level was generally 200 metres above current levels. However, the largest known example of marine flooding was when the Atlantic breached the Strait of Gibraltar at the end of the Messinian Salinity Crisis about 5.2 million years ago. This restored Mediterranean sea levels at the sudden end of the period when that basin had dried up, apparently due to geologic forces in the area of the Strait.
| Long-term causes | Range of effect | Vertical effect |
|---|---|---|
| Change in volume of ocean basins | ||
| Plate tectonics and seafloor spreading (plate divergence/convergence) and change in seafloor elevation (mid-ocean volcanism) | Eustatic | 0.01 mm/yr |
| Marine sedimentation | Eustatic | < 0.01 mm/yr |
| Change in mass of ocean water | ||
| Melting or accumulation of continental ice | Eustatic | 10 mm/yr |
| • Climate changes during the 20th century | ||
| •• Antarctica | Eustatic | 0.39 to 0.79 mm/yr[12] |
| •• Greenland (from changes in both precipitation and runoff) | Eustatic | 0.0 to 0.1 mm/yr |
| • Long-term adjustment to the end of the last ice age | ||
| •• Greenland and Antarctica contribution over 20th century | Eustatic | 0.0 to 0.5 mm/yr |
| Release of water from earth's interior | Eustatic | |
| Release or accumulation of continental hydrologic reservoirs | Eustatic | |
| Uplift or subsidence of Earth's surface (Isostasy) | ||
| Thermal-isostasy (temperature/density changes in earth's interior) | Local effect | |
| Glacio-isostasy (loading or unloading of ice) | Local effect | 10 mm/yr |
| Hydro-isostasy (loading or unloading of water) | Local effect | |
| Volcano-isostasy (magmatic extrusions) | Local effect | |
| Sediment-isostasy (deposition and erosion of sediments) | Local effect | < 4 mm/yr |
| Tectonic uplift/subsidence | ||
| Vertical and horizontal motions of crust (in response to fault motions) | Local effect | 1–3 mm/yr |
| Sediment compaction | ||
| Sediment compression into denser matrix (particularly significant in and near river deltas) | Local effect | |
| Loss of interstitial fluids (withdrawal of groundwater or oil) | Local effect | ≤ 55 mm/yr |
| Earthquake-induced vibration | Local effect | |
| Departure from geoid | ||
| Shifts in hydrosphere, aesthenosphere, core-mantle interface | Local effect | |
| Shifts in earth's rotation, axis of spin and precession of equinox | Eustatic | |
| External gravitational changes | Eustatic | |
| Evaporation and precipitation (if due to a long-term pattern) | Local effect | |
Changes through geologic time

Sea level has changed over geologic time. As the graph shows, sea level today is very near the lowest level ever attained (the lowest level occurred at the Permian-Triassic boundary about 250 million years ago).
During the most recent ice age (at its maximum about 20,000 years ago) the world's sea level was about 130 m lower than today, due to the large amount of sea water that had evaporated and been deposited as snow and ice, mostly in the Laurentide ice sheet. Most of this had melted by about 10,000 years ago.
Hundreds of similar glacial cycles have occurred throughout the Earth's history. Geologists who study the positions of coastal sediment deposits through time have noted dozens of similar basinward shifts of shorelines associated with a later recovery. This results in sedimentary cycles which in some cases can be correlated around the world with great confidence. This relatively new branch of geological science linking eustatic sea level to sedimentary deposits is called sequence stratigraphy.
The most up-to-date chronology of sea level change through the Phanerozoic shows the following long-term trends:[13]
- Gradually rising sea level through the Cambrian
- Relatively stable sea level in the Ordovician, with a large drop associated with the end-Ordovician glaciation
- Relative stability at the lower level during the Silurian
- A gradual fall through the Devonian, continuing through the Mississippian to long-term low at the Mississippian/Pennsylvanian boundary
- A gradual rise until the start of the Permian, followed by a gentle decrease lasting until the Mesozoic.
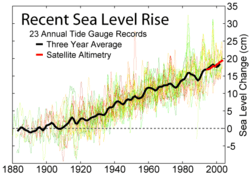
Recent changes
For at least the last 100 years, sea level has been rising at an average rate of about 1.8 mm (0.1 in) per year.[14] Most of this rise can be attributed to the increase in temperature of the sea and the resulting slight thermal expansion of the upper 500 metres (1,640 feet) of sea water. Additional contributions, as much as one-quarter of the total, come from water sources on land, such as melting snow and glaciers and extraction of groundwater for irrigation and other agricultural and human needs.[15]
Aviation
Using pressure to measure altitude results in two other types of altitude. Distance above true or MSL (mean sea level) is the next best measurement to absolute. Above mean sea level is abbreviated as AMSL. MSL altitude is the distance above where sea level would be if there were no land. If one knows the elevation of terrain, the distance above the ground is calculated by a simple subtraction.
An MSL altitude—called pressure altitude by pilots—is useful for predicting physiological responses in unpressurised aircraft (see hypoxia). It also correlates with engine, propeller and wing performance, which all decrease in thinner air.
Pilots can estimate height above terrain with an altimeter set to a defined barometric pressure. Generally, the pressure used to set the altimeter is the barometric pressure that would exist at MSL in the region being flown over. This pressure is referred to as either QNH or "altimeter" and is transmitted to the pilot by radio from air traffic control (ATC) or an Automatic Terminal Information Service (ATIS). Since the terrain elevation is also referenced to MSL, the pilot can estimate height above ground by subtracting the terrain altitude from the altimeter reading. Aviation charts are divided into boxes and the maximum terrain altitude from MSL in each box is clearly indicated. Once above the transition altitude (see below), the altimeter is set to the international standard atmosphere (ISA) pressure at MSL which is 1013.25 hPa or 29.92 inHg.[16]
Flight level
MSL is useful for aircraft to avoid terrain, but at high enough altitudes, there is no terrain to avoid. Above that level, pilots are primarily interested in avoiding each other, so they adjust their altimeter to standard temperature and pressure conditions (average sea level pressure and temperature) and disregard actual barometric pressure—until descending below transition level. To distinguish from MSL, such altitudes are called flight levels. Standard terminology is to express flight level as hundreds of feet, so FL 240 is 24,000 feet (7,300 m). Pilots use the international standard pressure setting of 1013.25 hPa (29.92 inHg) when referring to flight levels. The altitude at which aircraft are mandated to set their altimeter to flight levels is called "transition altitude". It varies from country to country. For example in the U.S. it is 18,000 feet, in many European countries it is 3,000 or 5,000 feet.
See also
- Above ground level
- Before Present
- Extreme points of Earth
- Geopotential height
- Height above average terrain
- List of places on land with elevations below sea level
- Marine terrace
- Meltwater pulse 1A
- Metres above the Adriatic
- Normal height
- Normaal Amsterdams Peil
- Normalhöhennull
- North West Shelf Operational Oceanographic System
- Ordnance datum (UK)
- Orthometric height
- World Geodetic System
References
- ↑ What is "Mean Sea Level"? (Proudman Oceanographic Laboratory).
- ↑ Solomon et al., Technical Summary, Section 3.4 Consistency Among Observations in IPCC AR4 WG1 2007; Hegerl et al., Executive summary, Section 1.3: Consistency of changes in physical and biological systems with warming in IPCC AR4 SYR 2007.
- ↑ US National Research Council, Bulletin of the National Research Council 1932 page 270
- ↑ "Eustatic sea level". Oilfield Glossary. Schlumberger Limited. Retrieved 10 June 2011.
- ↑ Rignot, Eric; I. Velicogna, M. R. van den Broeke, A. Monaghan, J. T. M. Lenaerts (March 2011). "Acceleration of the contribution of the Greenland and Antarctic ice sheets to sea level rise". Geophysical Research Letters 38 (5). Bibcode:2011GeoRL..38.5503R. doi:10.1029/2011GL046583. Retrieved 25 April 2013.
- ↑ Chao, B. F.; Y. H. Wu; Y. S. Li (April 2008). "Impact of Artificial Reservoir Water Impoundment on Global Sea Level". Science 320 (5873): 212–214. Bibcode:2008Sci...320..212C. doi:10.1126/science.1154580. PMID 18339903.
- ↑ Konikow (September 2011). "Contribution of global groundwater depletion since 1900 to sea-level rise". Geophysical research letters 38 (17). Bibcode:2011GeoRL..3817401K. doi:10.1029/2011GL048604.
- ↑ "Climate Change 2001: The Scientific Basis".
|chapter=ignored (help) - ↑ Geologic Contral on Fast Ice Flow – West Antarctic Ice Sheet. by Michael Studinger, Lamont-Doherty Earth Observatory
- ↑ GRID-Arendal. "Climate Change 2001: The Scientific Basis". Retrieved 2005-12-19.
|chapter=ignored (help) - ↑ Müller, R. Dietmar et al. (2008-03-07). "Long-Term Sea-Level Fluctuations Driven by Ocean Basin Dynamics". Science 319 (5868): 1357–1362. Bibcode:2008Sci...319.1357M. doi:10.1126/science.1151540. PMID 18323446.
- ↑ Shepherd, Andrew; Ivins ER, A G, Barletta VR, Bentley MJ, Bettadpur S, Briggs KH, Bromwich DH, Forsberg R, Galin N, Horwath M, Jacobs S, Joughin I, King MA, Lenaerts JT, Li J, Ligtenberg SR, Luckman A, Luthcke SB, McMillan M, Meister R, Milne G, Mouginot J, Muir A, Nicolas JP, Paden J, Payne AJ, Pritchard H, Rignot E, Rott H, Sørensen LS, Scambos TA, Scheuchl B, Schrama EJ, Smith B, Sundal AV, van Angelen JH, van de Berg WJ, van den Broeke MR, Vaughan DG, Velicogna I, Wahr J, Whitehouse PL, Wingham DJ, Yi D, Young D, Zwally HJ. (Nov 30, 2012). "A reconciled estimate of ice-sheet mass balance.". Science 338 (6111): 1183–1189. Bibcode:2012Sci...338.1183S. doi:10.1126/science.1228102. Retrieved 23 Mar 2013.
- ↑ Haq, B. U.; Schutter, SR (2008). "A Chronology of Paleozoic Sea-Level Changes". Science 322 (5898): 64–8. Bibcode:2008Sci...322...64H. doi:10.1126/science.1161648. PMID 18832639.
- ↑ Bruce C. Douglas (1997). "Global Sea Rise: A Redetermination". Surveys in Geophysics 18 (2/3): 279–292. Bibcode:1997SGeo...18..279D. doi:10.1023/A:1006544227856.
- ↑ Bindoff, N.L.; Willebrand, J.; Artale, V.; Cazenave, A.; Gregory, J.; Gulev, S.; Hanawa, K.; Le Quéré, C.; Levitus, S.; Nojiri, Y.; Shum, C.K.; Talley, L.D.; Unnikrishnan, A. (2007). "Observations: Oceanic Climate Change and Sea Level" (PDF). In Solomon, S.; Qin, D.; Manning, M.; Chen, Z.; Marquis, M.; Averyt, K.B.; Tignor, M.; Miller, H.L. Climate Change 2007: The Physical Science Basis. Contribution of Working Group I to the Fourth Assessment Report of the Intergovernmental Panel on Climate Change. Cambridge University Press.
- ↑ US Federal Aviation Administration, Code of Federal Regulations Sec. 91.121
External links
| Wikimedia Commons has media related to Sea level. |
- Sea Level Rise:Understanding the past – Improving projections for the future
- Permanent Service for Mean Sea Level
- Global sea level change: Determination and interpretation
- Environment Protection Agency Sea level rise reports
- Properties of isostasy and eustasy
- Measuring Sea Level from Space
- Rising Tide Video: Scripps Institution of Oceanography
- Sea Levels Online: National Ocean Service (CO-OPS)
- Système d'Observation du Niveau des Eaux Littorales (SONEL)
- Sea level rise – How much and how fast will sea level rise over the coming centuries?

| ||||||||||||||||||||||||||||