Scottish District local elections, 1992
| | |||||||||||||||||||||||||||||||||||||||||||||||||||||||||||||||||||||||||||
| |||||||||||||||||||||||||||||||||||||||||||||||||||||||||||||||||||||||||||
| |||||||||||||||||||||||||||||||||||||||||||||||||||||||||||||||||||||||||||
|
| |||||||||||||||||||||||||||||||||||||||||||||||||||||||||||||||||||||||||||
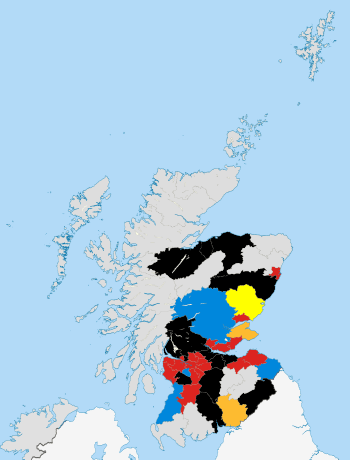
| Colours denote the winning party with outright control | |||||||||||||||||||||||||||||||||||||||||||||||||||||||||||||||||||||||||||
.jpg)

.JPG)

Local elections were held in Scotland in May 1992, to elect members to all 53 district councils. It was the last local election held under the Local Government (Scotland) Act 1973, which had established the two-tier system of regions and districts. Regional and district councils were abolished in 1996, and replaced with 29 new mainland unitary authorities under the terms of the Local Government etc. (Scotland) Act 1994.
National results
Summary of the 1992 Scottish district council election results[1]
| Parties | Votes | Votes % | Wards | |
|---|---|---|---|---|
| Labour | 34.0 | 468 | ||
| SNP | 24.3 | 150 | ||
| Conservative | 23.2 | 204 | ||
| Liberal Democrats | 9.5 | 94 | ||
| Independent | 7.4 | 228 | ||
| Other | 1.9 | 14 | ||
| Total | n/a | 1158 | ||
Results by council area
Borders
| Council | 1988 result | National control |
1992 result | Turnout | Details | ||
|---|---|---|---|---|---|---|---|
| Berwickshire | Conservative | Conservative | |||||
| Ettrick and Lauderdale | Independent | Independent | |||||
| Roxburghshire | Independent | Independent | |||||
| Tweeddale | Independent | Independent | |||||
Central
| Council | 1988 result | National control |
1992 result | Turnout | Details | ||
|---|---|---|---|---|---|---|---|
| Clackmannanshire | Labour | Labour | |||||
| Falkirk | Labour | No overall control | |||||
| Stirling | Labour | No overall control | |||||
Dumfries and Galloway
| Council | 1988 result | National control |
1992 result | Turnout | Details | ||
|---|---|---|---|---|---|---|---|
| Annandale and Eskdale | Liberal Democrat | Liberal Democrat | |||||
| Merrick | Independent | Independent | |||||
| Nithsdale | Labour | No overall control | |||||
| Stewartry of Kirkcudbright | Independent | Independent} | |||||
Fife
| Council | 1988 result | National control |
1992 result | Turnout | Details | ||
|---|---|---|---|---|---|---|---|
| Dunfermline | Labour | Labour | |||||
| Kirkcaldy | Labour | Labour | |||||
| North-East Fife | Liberal Democrat | Liberal Democrat | |||||
Grampian
| Council | 1988 result | National control |
1992 result | Turnout | Details | ||
|---|---|---|---|---|---|---|---|
| Banff and Buchan | Independent | Independent | |||||
| City of Aberdeen | No overall control | Labour | |||||
| Gordon | No overall control | Independent | |||||
| Kincardine and Deeside | Independent | No overall control | |||||
| Moray | Independent | No overall control | |||||
Highland
| Council | 1988 result | National control |
1992 result | Turnout | Details | ||
|---|---|---|---|---|---|---|---|
| Badenoch and Strathspey | Independent | Independent | |||||
| Caithness | Independent | Independent | |||||
| Inverness | Independent | No overall control | |||||
| Lochaber | Independent | No overall control | |||||
| Nairn | Independent | Independent | |||||
| Ross and Cromarty | Independent | Independent | |||||
| Skye and Lochalsh | Independent | Independent | |||||
| Sutherland | Independent | Independent | |||||
Lothian
| Council | 1988 result | National control |
1992 result | Turnout | Details | ||
|---|---|---|---|---|---|---|---|
| City of Edinburgh | Labour | No overall control | |||||
| East Lothian | Labour | Labour | |||||
| Midlothian | Labour | Labour | |||||
| West Lothian | Labour | No overall control | |||||
Strathclyde
| Council | 1988 result | National control |
1992 result | Turnout | Details | ||
|---|---|---|---|---|---|---|---|
| Argyll | Independent | Independent | |||||
| Bearsden and Milngavie | Conservative | No overall control | |||||
| Cumbernauld | No overall control | Labour | |||||
| Clydebank | Labour | Labour | |||||
| Cunninghame | Labour | Labour | |||||
| Cumnock and Doon Valley | Labour | Labour | |||||
| Dumbarton | No overall control | No overall control | |||||
| East Kilbride | Labour | Labour | |||||
| Eastwood | Conservative | Conservative | |||||
| City of Glasgow | Labour | Labour | |||||
| Hamilton | Labour | Labour | |||||
| Inverclyde | Labour | Labour | |||||
| Kilmarnock and Loudoun | Labour | No overall control | |||||
| Kyle and Carrick | Labour | Conservative | |||||
| Lanark | Labour | No overall control | |||||
| Motherwell | Labour | Labour | |||||
| Monklands | Labour | Labour | |||||
| Strathkelvin | Labour | Labour | |||||
Tayside
| Council | Labour | Conservative | SNP | Liberal & SDP | Independent | Others | Control | |
|---|---|---|---|---|---|---|---|---|
| Angus | 0 | 7 (+1) | 11 (-2) | 1 | 2 (+1) | 0 | SNP hold | |
| City of Dundee | Labour hold | |||||||
| Perth and Kinross | Conservative gain from NOC | |||||||
| Preceded by Scottish local Regional elections, 1990 |
Scottish local elections | Succeeded by Scottish local Regional elections, 1994 |
Notes and references
- ↑ Denver, David; Bochel, Hugh (Winter 2000), "The Forgotten Elections: The Scottish Council Elections of 1999", Scottish Affairs (PDF) 30McConnell, Alan (2004), Scottish Local Government, Edinburgh University Press, ISBN 978-0-7486-2005-0
See also
| ||||||||||||||||||||||
| ||||||||||||||||||