Scottish District local elections, 1980
Scottish District local elections, 1980

|
|
|
|
|
|
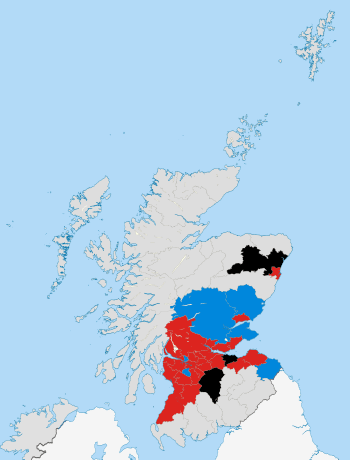
| Colours denote the winning party with outright control |
There were elections for the Scottish district councils in 1980.
These were the third elections held to the 53 district councils established by the Local Government (Scotland) Act 1973. The previous elections had been held in 1977. The elections took place a year after the Conservative government of Margaret Thatcher had come to power. The local elections, which also took place in England and Wales, were seen as the first electoral test of the Thatcher ministry.[1]
Background
The poll was held on 1 May and all 1,182 district council seats were to be filled.[2] Districts formed the second tier in local government in Scotland under the 1975 reorganisation, with regional councils forming the upper tier. It was intended that elections would normally take place on a four-year cycle. Regional elections were also to be on a four-year cycle, held midway between district elections.
Party performance
Labour had a very good electoral performance, more than regaining the ground they had lost at the 1977 elections. They gained 18 councils: 3 from the Scottish National Party, one from Liberals and 14 from no overall control. Notable gains were the cities of Aberdeen, Dundee and Glasgow.[3] The Conservatives suffered the loss of Edinburgh but held another six councils. The SNP vote collapsed and they lost control of the three councils they controlled. In a number of councils all of the party's sitting councillors were defeated, most notably in Glasgow where they lost all 16 seats they held. The Liberal Party lost the only council they controlled.[3]
Summary of the 1977 Scottish District local council election results[4]
Results by council area
The seats on each council before and after the election were as follows:[2] [3]
Borders
Central
| Council |
Labour |
Conservative |
SNP |
Liberal |
Independent |
Other |
Control
|
|---|
| Clackmannan |
7 (+3) |
1 |
4 (-3) |
0 |
0 |
0 |
|
Labour gain from SNP |
| Falkirk |
27 (+19) |
2 |
4 (-17) |
0 |
2 (-1) |
Independent Labour 1
Independent Scottish Nationalist 0 (-1) |
|
Labour gain from SNP |
| Stirling |
10 (+3) |
9 |
0 (-3) |
0 |
1 (+1) |
Independent Conservative 0 (-1) |
|
Labour gain from NOC |
Dumfries and Galloway
Fife
Grampian
| Council |
Labour |
Conservative |
SNP |
Liberal |
Independent |
Control
|
|---|
| Banff and Buchan |
1 (+1) |
0 |
5 (+4) |
0 |
12 (-5) |
|
Independent hold |
| City of Aberdeen |
27 (+5) |
13 (-2) |
0 (-2) |
8 (-1) |
0 |
|
Labour gain from NOC |
| Gordon |
0 |
3 |
0 |
3 |
6 |
|
No overall control |
| Kincardine and Deeside |
0 |
2 (-1) |
0 |
1 (+1) |
9 |
|
Independent hold |
| Moray |
0 |
0 |
3 (-1) |
0 |
15 (+1) |
|
Independent hold |
Highland
| Council |
Labour |
Conservative |
SNP |
Liberal |
Independent |
Control
|
|---|
| Badenoch and Strathspey |
0 |
0 |
2 (+2) |
0 |
8 (-2) |
|
Independent hold |
| Caithness‡ |
1 |
0 |
0 |
1 |
13 |
|
Independent hold |
| Inverness‡ |
8 |
0 |
1 |
2 |
17 |
|
Independent hold |
| Lochaber |
4 (+1) |
0 |
0 (-1) |
0 |
8 |
|
Independent hold |
| Nairn |
0 |
0 |
0 (-2) |
0 |
10 |
|
Independent hold |
| Ross and Cromarty |
0 |
1 |
0 |
0 |
19 |
|
Independent hold |
Skye and Lochalsh
2 vacancies |
0 |
0 |
0 |
0 |
9 |
|
Independent hold |
Sutherland
1 vacancy |
0 |
0 |
0 |
0 |
13 |
|
Independent hold |
‡ Changes in ward boundaries
Lothian
| Council |
Labour |
Conservative |
SNP |
Liberal |
Independent |
Control
|
|---|
| City of Edinburgh‡ |
25 |
31 |
2 |
2 |
2 |
|
Conservatives lose to NOC |
| East Lothian |
10 |
7 |
0 |
0 |
0 |
|
Labour hold |
| Midlothian |
13 (+6) |
1 (-1) |
0 (-4) |
0 |
1 (-1) |
|
Labour gain from NOC |
| West Lothian |
15 (+7) |
0 |
4 (-6) |
0 |
2 (-1) |
|
Labour gain from NOC |
‡ Changes in ward boundaries
Strathclyde
Tayside
| Council |
Labour |
Conservative |
SNP |
Liberal |
Independent |
Others |
Control
|
|---|
| Angus |
3 |
12 (+1) |
0 |
0 |
7 (-1) |
0 |
|
Conservative hold |
| City of Dundee |
25 (+4) |
26 (-2) |
0 |
0 |
1 (-1) |
Ratepayer-Conservatives 11 (-1)
Independent Ratepayers-Conservatives 1 (+1)
Progressive Conservatives 0 (-1) |
|
Labour gain from NOC |
| Perth and Kinross |
5 (+2) |
19 (-2) |
1 |
1 (+1) |
3 (-1) |
0 |
|
Conservative hold |
References
- ↑ Warman, Christopher (1 May 1980). "Poll 'chance to pass judgment'". The Times. p. 2.
- ↑ 2.0 2.1 "Labour makes gains throughout Britain in local government elections". The Times. 2 May 1980. p. 4.
- ↑ 3.0 3.1 3.2 Warman, Christopher (5 May 1980). "Labour wins stronger voice to fight against cuts in local services". The Times. p. 3.
- ↑ Rallings, Colin; Thrasher, Michael (2013). Local Elections in Britain. Routledge. pp. Table 7.5.