SCaViS
 | |
| Developer(s) | Primary developer Dr. S.Chekanov |
|---|---|
| Stable release | 2.3 / 2015-03-08 |
| Written in | Java, Jython |
| Operating system | Cross-platform |
| Type | Data analysis |
| License | Mixed: The core engine is GPL, but installer, documentation and other components are free for non-commercial purposes. |
| Website |
jwork |
SCaViS (Scientific Computation and Visualization Environment) is an interactive framework for scientific computation, data analysis and data visualization designed for scientists, engineers and students. SCaViS is multiplatform since it is written in Java, thus it runs on any operating system where the Java virtual machine can be installed.
The program is designed for interactive scientific plots in 2D and 3D and contains numerical scientific libraries implemented in Java for mathematical functions, random numbers, statistical analysis, curve fitting and other data mining algorithms. SCaViS uses high-level programming languages, such as Jython (Python implemented in Java), Groovy, JRuby, but Java coding can also be used to call SCaViS numerical and graphical libraries.
SCaViS is an attempt to create a data-analysis environment using open-source packages with a coherent user interface and tools competitive to commercial programs. The idea behind the project is to incorporate open-source mathematical and numerical software packages with GUI-type of user interfaces into a coherent program in which the main user interface is based on short-named Java/Python classes. This was required to build an analysis environment using Java scripting concept. A typical example will be shown below.
SCaVis runs on any platforms (Windows, Mac, Linux, etc.) where Java can be installed. Scripts and Java code (in case of the Java programming) can be run either in a GUI editor of SCaViS or as batch programs. The graphical libraries of SCaViS can be used to create applets. All charts (or "Canvases") used for data representation can be embedded into Web browsers.
SCaViS can be used everywhere where an analysis of large numerical data volumes, data mining, statistical data analysis and mathematics are essential. The program can be used in natural sciences, engineering, modeling and analysis of financial markets. While the program falls into the category of open source software, it is not completely free for commercial usage (see below).
Overview
SCaViS has several features useful for data analysis:
- uses Jython, BeanShell, Groovy, JRuby scripting, or the standard Java. The GNU Octave mode is also available for symbolic calculations;
- can be integrated with the Web in forms of applets or Java Web-start applications, thus it is suited for distributed analysis environment via the Internet;
- SCaViS is designed from the ground up to support programming with multiple threads;
- has a full-featured IDE with syntax highlighting, syntax checker, code completion and analyser. It includes a version of IDE for small-screen devices;
- includes a help system with a code completion based on the Java reflection technology;
- uses a platform-neutral I/O based on Google's Protocol Buffers. Data can be written in C++ and analyzed using Java/Jython.
- databases (object databases and SQL-based databases)
- has a browser for serialized objects and objects created using Google Protocol Buffers;
- includes packages for statistical calculations;
- error (uncertainty) propagation using a linear expansion or a Monte Carlo approach for arbitrary function
- symbolic calculations similar to those found in the GNU Octave project or MATLAB, but rewritten in Java (jMathLab project).
Data-analysis features
The package supports several mathematical, data-analysis and data mining features:
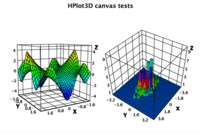
- 2D and 3D interactive visualization of data, functions, histograms, charts.
- analytic calculations using Matlab or Octave syntax
- histograms in 2D and 3D, as well as profile histograms
- random numbers and statistical samples
- functions, including parametric equations in 3D
- contour plots, scatter plots
- neural networks
- linear regression and curve fitting using several minimization techniques
- Cluster analysis (K-means clustering analysis (single and multi pass), Fuzzy (C-means) algorithm, agglomerative hierarchical clustering)
- input/output for all data objects (arrays, functions, histograms) are based on Java serialization. There is also a support for I/O from/to C++ and other languages using the Google's Protocol buffer format. Several databases are supported (Java-object databases and SQL-based)
- Cellular automaton
- output to high-quality Vector graphics. Support for PostScript, EPS, PDF and raster formats
Symbolic and numeric calculations
Symbolic calculations use GNU Octave scripting language. The following methods are available:
- Systems of polynomial equations solving
- vectors and matrix algebra
- Factorization
- derivatives
- integrals (rational functions)
- boolean algebra
- simplification
- geometric algebra
Input and output
SCaViS includes the native Java and Python methods for file input and outputs. In addition, it allows to write data in the following formats:
- The HFile format based on Java serialization. Optionally, compression and XML serialization are supported. Data can be written sequentially or using the key-value maps.
- The PFile format based on the Protocol Buffers engine for multiplatform input output
- The HBook format, which is a simplified XML format to write large data structures without XML tags
- Arbitrary data structure can be written into object databases with file system as back-end. This allows writing large data collections to files which normally do not fit into the computer memory.
- Several SQL database engines are included as external packages
- AIDA (computing) file format (read only)
- ROOT file format (read only)
Data stored in external files can be viewed using browsers for convenient visualization.
History
SCaViS has its roots in particle physics where data mining is a primary task. It was created as jHepWork project in 2005 and it was initially written for data analysis for particle physics[1] using the Java software concept for International Linear Collider project developed at SLAC. Later versions of jHepWork were modified for general public use (for scientists, engineers, students for educational purpose) since the International Linear Collider project has stalled. In 2013, jHepWork was renamed to SCaViS and become a general-purpose community-supported project. The main source of reference is the book "Scientific Data analysis using Jython Scripting and Java"[2] which discusses in depth data analysis methods using Java and Jython scripting. More recently, SCaVis was discussed in German Java SPEKTRUM journal.[3]
The string "HEP" in the project name "jHepWork" abbreviates "High-Energy Physics". But due to a wide popularity outside this area of physics, it was renamed to SCaViS (Scientific Computation and Visualization Environment).
SCaViS is hosted by jWork.ORG portal [4]
Supported platforms
SCaViS runs on Windows, Linux, Mac and the Android platforms. The package for the Android is called AWork.
License terms
The core source code of the numerical and graphical libraries is licensed by the GNU General Public License. The interactive development environment (IDE) used by SCaViS has some restrictions for commercial usage since language files, documentation files, examples, installer, code-assist databases, interactive help are licensed by the creative-common license. Full members of the SCaViS project have several benefits, such as: the license for a commercial usage, access to the source repository, an extended help system, a user script repository and an access to the complete documentation.
Examples
Jython scripts
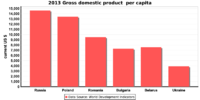
Here is an example of how to show 2D bar graphs by reading a CVS file downloaded from the World Bank web site.
from jhplot.io.csv import *
from java.io import *
from jhplot import *

dict={}
reader =CSVReader(FileReader("ny.gdp.pcap.cd_Indicator_en_csv_v2.csv"));
while True:
      nextLine = reader.readNext()
      if nextLine== None: break
      xlen=len(nextLine)
      if  xlen<50: continue
      dict[nextLine[0]]=nextLine[xlen-2] # key: country, vaue=DGP
c1 = HChart("2013",800,400)
#c1.setGTitle("2013 Gross domestic product  per capita")
c1.visible()
c1.setChartBar()
c1.setNameY("current US $")
c1.setNameX("")
c1.setName("2013 Gross domestic product  per capita")
name1="Data Source: World Development Indicators"
name="Russia"; c1.valueBar(float(dict[name]) ,name,name1)
name="Poland"; c1.valueBar(float(dict[name]) ,name,name1)
name="Romania"; c1.valueBar(float(dict[name]) ,name,name1)
name="Bulgaria"; c1.valueBar(float(dict[name]) ,name,name1)
name="Belarus"; c1.valueBar(float(dict[name]) ,name,name1)
name="Ukraine"; c1.valueBar(float(dict[name]) ,name,name1)
c1.update()
The execution of this script plots a bar chart as shown below. The image can be saved in a number of formats.
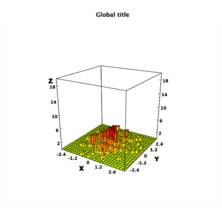
Here is another simple example which illustrates how to fill a 2D histogram and display it on a canvas. The script also creates a figure in the PDF format. This script illustrates how to glue and mix the native JAVA classes (from the package java.util) and SCaViS classes (the package jhplot) inside a script written using the Python syntax.
from java.util import Random
from jhplot  import *

c1 = HPlot3D("Canvas") # create an interactive canvas
c1.setGTitle("Global title")
c1.setNameX("X")
c1.setNameY("Y")
c1.visible()
c1.setAutoRange()

h1 = H2D("2D histogram",25,-3.0, 3.0,25,-3.0, 3.0)
rand = Random()
for i in range(200):
     h1.fill(rand.nextGaussian(),rand.nextGaussian())
c1.draw(h1)
c1.export("jhplot3d.eps") # export to EPS Vector Graphics
This script can be run either using SCaViS IDE or using a stand-alone Jython after specifying classpath to SCaViS libraries. The output is shown bellow:
Groovy scripts
The same example can also be coded using Groovy programming language which is supported by SCaVis.
import java.util.Random
import jhplot.*

c1 = new HPlot3D("Canvas")  //  create an interactive canvas
c1.setGTitle("Global title")
c1.setNameX("X")
c1.setNameY("Y")
c1.visible()
c1.setAutoRange()

h1 = new H2D("2D histogram",25,-3.0, 3.0,25,-3.0, 3.0)
rand = Random()
for (i=0; i<200; i++){
     h1.fill(rand.nextGaussian(),rand.nextGaussian())
}
c1.draw(h1);
c1.export("jhplot3d.eps") // export to EPS Vector Graphics
Groovy is better integrated with Java and can be a factor three faster for long loops over primitives compared to Jython.
See also
- ROOT – C++ data analysis framework developed at CERN
- Java Analysis Studio — a Java-based AIDA-compliant data analysis system
References
- ↑ HEP data analysis using jHepWork and Java. arXiv:0809.0840v2, ANL-HEP-CP-08-53 preprint. CERN preprint
- ↑ S.V.Chekanov, Scientific Data analysis using Jython Scripting and Java. Book. 497p. (Springer-Verlag, 2010, ISBN 978-1-84996-286-5)
- ↑ Klaus Rohe. "SCaVis – Werkbank für technisch-wissenschaftliche Berechnungen und Visualisierungen mit Java und Jython", Java SPEKTRUM Journal, 5/2013 (page 25-28)
- ↑ jWork.ORG Community Portal focused on Java scientific software
Publications
- Scientific Data analysis using Jython Scripting and Java. Book. 497 pp, by S.V.Chekanov (Springer-Verlag, 2010, ISBN 978-1-84996-286-5)
- SCaVis – Werkbank für technisch-wissenschaftliche Berechnungen und Visualisierungen mit Java und Jython (in German) Klaus Rohe, Java SPEKTRUM 5/2013 journal (page 26-28).