Ruislip-Northwood (UK Parliament constituency)
| Ruislip-Northwood | |
|---|---|
|
Former Borough constituency for the House of Commons | |
|
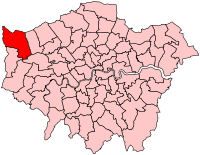
Boundary of Ruislip-Northwood in Greater London for the 2005 general election. | |
| County | Greater London |
| 1950–2010 | |
| Number of members | One |
| Replaced by | Ruislip, Northwood and Pinner, Uxbridge and South Ruislip |
| Created from | Uxbridge |
Ruislip-Northwood was a borough constituency represented in the House of Commons of the Parliament of the United Kingdom. It elected one Member of Parliament (MP) by the first past the post system of election. It was centred on the districts of Ruislip and Northwood in the London Borough of Hillingdon, and existed from 1950 until 2010.
History
This represented the northern half of the earlier Uxbridge constituency which was divided into two following house-building in the area in 1950.
Ruislip-Northwood was constituency that as such covered slightly elevated and gently hilly outskirts of West London, beginning 12 miles (19 km) WNW of Charing Cross.[1]
All three of its successive Members of Parliament were Old Etonians and as the majorities they received were non-marginal, with their contributions the seat was throughout its elections a safe seat.
Almost all of its area has been succeeded by Ruislip, Northwood and Pinner.
Boundaries
The constituency consisted of the northern part of the London Borough of Hillingdon.
Boundary review
Following their review of parliamentary representation in North London, the Boundary Commission for England created a modified Ruislip constituency, first fought at the 2010 General Election. This is called Ruislip, Northwood and Pinner, and includes some areas from the pre-2010 Harrow West constituency. Meanwhile, parts of Ruislip-Northwood moved in 2010 to a newly created Uxbridge and South Ruislip constituency.
Members of Parliament
| Election | Member[2] | Party | |
|---|---|---|---|
| 1950 | Petre Crowder | Conservative | |
| 1979 | John Wilkinson | Conservative | |
| 2005 | Nick Hurd | Conservative | |
| 2010 | Constituency abolished: see Ruislip, Northwood and Pinner and Uxbridge and South Ruislip | ||
Elections
Elections in the 2000s
| General Election 2005: Ruislip-Northwood | |||||
|---|---|---|---|---|---|
| Party | Candidate | Votes | % | ±% | |
| Conservative | Nick Hurd | 18,939 | 47.7 | −1.1 | |
| Liberal Democrat | Mike Cox | 10,029 | 25.3 | +6.0 | |
| Labour | Ashley Riley | 8,323 | 21.0 | −7.5 | |
| Green | Graham Lee | 892 | 2.2 | +0.3 | |
| National Front | Ian Edward | 841 | 2.1 | ||
| UKIP | Roland Courtenay | 646 | 1.6 | ||
| Majority | 8,910 | 22.5 | +2.2 | ||
| Turnout | 39,670 | 65.3 | +4.2 | ||
| Conservative hold | Swing | −3.5 | |||
| General Election 2001: Ruislip-Northwood | |||||
|---|---|---|---|---|---|
| Party | Candidate | Votes | % | ±% | |
| Conservative | John Wilkinson | 18,115 | 48.8 | −1.5 | |
| Labour | Gillian Travers | 10,578 | 28.5 | −4.4 | |
| Liberal Democrat | Mike Cox | 7,177 | 19.3 | +3.1 | |
| Green | Graham Lee | 724 | 1.9 | ||
| BNP | Ian Edward | 547 | 1.5 | ||
| Majority | 7,537 | 20.3 | |||
| Turnout | 37,141 | 61.1 | −13.1 | ||
| Conservative hold | Swing | ||||
Elections in the 1990s
| General Election 1997: Ruislip-Northwood[3][4][5] | |||||
|---|---|---|---|---|---|
| Party | Candidate | Votes | % | ±% | |
| Conservative | John Wilkinson | 22,526 | 50.2 | −12.7 | |
| Labour | P Barker | 14,732 | 32.9 | +13.0 | |
| Liberal Democrat | C Edwards | 7,279 | 16.2 | −0.5 | |
| Natural Law | C Griffin | 296 | 0.8 | +0.3 | |
| Majority | 7,794 | 17.4 | |||
| Turnout | 44,833 | 74.2 | |||
| Conservative hold | Swing | −12.8 | |||
| General Election 1992: Ruislip-Northwood[6] | |||||
|---|---|---|---|---|---|
| Party | Candidate | Votes | % | ±% | |
| Conservative | John Wilkinson | 28,097 | 63.3 | +0.7 | |
| Labour | Miss RM Brooks | 8,306 | 18.7 | +5.2 | |
| Liberal Democrat | H Davies | 7,739 | 17.4 | −6.4 | |
| Natural Law | MG Sheehan | 214 | 0.5 | +0.5 | |
| Majority | 19,791 | 44.6 | +5.9 | ||
| Turnout | 44,356 | 82.1 | +4.4 | ||
| Conservative hold | Swing | −2.3 | |||
Elections in the 1980s
| General Election 1987: Ruislip-Northwood | |||||
|---|---|---|---|---|---|
| Party | Candidate | Votes | % | ±% | |
| Conservative | John Wilkinson | 27,418 | 62.63 | ||
| Liberal | D. Darby | 10,447 | 23.86 | ||
| Labour | H.A. Smith | 5,913 | 13.51 | ||
| Majority | 16,971 | 38.77 | |||
| Turnout | 77.67 | ||||
| Conservative hold | Swing | ||||
| General Election 1983: Ruislip-Northwood | |||||
|---|---|---|---|---|---|
| Party | Candidate | Votes | % | ±% | |
| Conservative | John Wilkinson | 24,498 | 59.58 | ||
| Liberal | R. Stephenson | 11,516 | 28.01 | ||
| Labour | Mike O'Brien | 5,105 | 12.42 | ||
| Majority | 12,982 | 31.57 | |||
| Turnout | 72.93 | ||||
| Conservative hold | Swing | ||||
Elections in the 1970s
| General Election 1979: Ruislip-Northwood | |||||
|---|---|---|---|---|---|
| Party | Candidate | Votes | % | ±% | |
| Conservative | John Wilkinson | 26,748 | 61.30 | ||
| Labour | M.E. Lloyd | 9,541 | 21.87 | ||
| Liberal | R. Stephenson | 6,867 | 15.74 | ||
| National Front | A. Martin | 477 | 1.09 | ||
| Majority | 17,207 | 39.44 | |||
| Turnout | 78.61 | ||||
| Conservative hold | Swing | ||||
| General Election October 1974: Ruislip-Northwood | |||||
|---|---|---|---|---|---|
| Party | Candidate | Votes | % | ±% | |
| Conservative | Petre Crowder | 20,779 | 51.50 | ||
| Labour | D.A.G. Race | 10,490 | 26.00 | ||
| Liberal | Joyce Arram | 8,621 | 21.37 | ||
| United Democratic | W.P. Hobday | 458 | 1.14 | ||
| Majority | 10,289 | 25.50 | |||
| Turnout | 74.55 | ||||
| Conservative hold | Swing | ||||
| General Election February 1974: Ruislip-Northwood | |||||
|---|---|---|---|---|---|
| Party | Candidate | Votes | % | ±% | |
| Conservative | Petre Crowder | 21,995 | 49.63 | ||
| Labour | D.A.G. Race | 10,574 | 23.86 | ||
| Liberal | Joyce Arram | 10,311 | 23.27 | ||
| Independent Conservative | W.P. Hobday | 458 | 1.14 | ||
| Majority | 11,421 | 25.77 | |||
| Turnout | 82.65 | ||||
| Conservative hold | Swing | ||||
| General Election 1970: Ruislip-Northwood | |||||
|---|---|---|---|---|---|
| Party | Candidate | Votes | % | ±% | |
| Conservative | Petre Crowder | 24,247 | 60.65 | ||
| Labour | B.H. Silverman | 11,541 | 28.87 | ||
| Liberal | Joyce M. Arram | 4,188 | 10.48 | ||
| Majority | 12,706 | 31.78 | |||
| Turnout | 73.04 | ||||
| Conservative hold | Swing | ||||
Elections in the 1960s
| General Election 1966: Ruislip-Northwood | |||||
|---|---|---|---|---|---|
| Party | Candidate | Votes | % | ±% | |
| Conservative | Petre Crowder | 20,731 | 51.42 | ||
| Labour | P.L.N. Smith | 13,455 | 33.38 | ||
| Liberal | R.A. Walker | 6,128 | 15.20 | ||
| Majority | 7,276 | 18.05 | |||
| Turnout | 81.72 | ||||
| Conservative hold | Swing | ||||
| General Election 1964: Ruislip-Northwood | |||||
|---|---|---|---|---|---|
| Party | Candidate | Votes | % | ±% | |
| Conservative | Petre Crowder | 21,036 | 52.36 | ||
| Labour | P.T.A. Marlowe | 11,331 | 28.21 | ||
| Liberal | R.A. Walker | 7,806 | 19.43 | ||
| Majority | 9,705 | 24.16 | |||
| Turnout | 81.39 | ||||
| Conservative hold | Swing | ||||
Elections in the 1950s
| General Election 1959: Ruislip-Northwood | |||||
|---|---|---|---|---|---|
| Party | Candidate | Votes | % | ±% | |
| Conservative | Petre Crowder | 23,480 | 56.99 | ||
| Labour | J.L. King | 10,424 | 25.30 | ||
| Liberal | R.A. Walker | 7,295 | 17.71 | ||
| Majority | 13,056 | 31.69 | |||
| Turnout | 83.74 | ||||
| Conservative hold | Swing | ||||
| General Election 1955: Ruislip-Northwood | |||||
|---|---|---|---|---|---|
| Party | Candidate | Votes | % | ±% | |
| Conservative | Petre Crowder | 24,806 | 65.18 | ||
| Labour | G.S. Burden | 13,251 | 34.82 | ||
| Majority | 11,555 | 30.36 | |||
| Turnout | 79.79 | ||||
| Conservative hold | Swing | ||||
| General Election 1951: Ruislip-Northwood | |||||
|---|---|---|---|---|---|
| Party | Candidate | Votes | % | ±% | |
| Conservative | Petre Crowder | 25,295 | 63.58 | ||
| Labour | T.J. Parker | 14,491 | 36.42 | ||
| Majority | 10,804 | 27.16 | |||
| Turnout | 84.62 | ||||
| Conservative hold | Swing | ||||
| General Election 1950: Ruislip-Northwood | |||||
|---|---|---|---|---|---|
| Party | Candidate | Votes | % | ±% | |
| Conservative | Petre Crowder | 23,077 | 57.51 | ||
| Labour | A.L. Birk | 13,568 | 33.81 | ||
| Liberal | Gwendoline Rosser McGregor Wood | 3,482 | 8.68 | ||
| Majority | 9,509 | 23.70 | |||
| Turnout | 88.05 | ||||
| Conservative hold | Swing | ||||
See also
- List of Parliamentary constituencies in Greater London
Notes and references
- ↑ Ordnance survey website
- ↑ Leigh Rayment's Historical List of MPs – Constituencies beginning with "R" (part 2)
- ↑ "Politics Resources". Election 1997. Politics Resources. 1 May 1997. Retrieved 5 Jan 2011.
- ↑ C. Rallings & M. Thrasher, The Media Guide to the New Parliamentary Constituencies, p.141 (Plymouth: LGC Elections Centre, 1995).
- ↑ The 1997 election result has swings relative to the notional, not the actual, 1992 result.
- ↑ "Politics Resources". Election 1992. Politics Resources. 9 April 1992. Retrieved 6 Dec 2010.
Coordinates: 51°35′20″N 0°26′06″W / 51.589°N 0.435°W