Rugby (UK Parliament constituency)
| Rugby | |
|---|---|
|
County constituency for the House of Commons | |
|
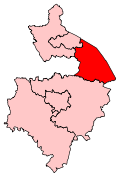
Boundary of Rugby in Warwickshire for the 2010 general election. | |
|
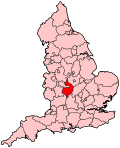
Location of Warwickshire within England. | |
| County | Warwickshire |
| Electorate | 69,932 (December 2010)[1] |
| Current constituency | |
| Created | 2010 |
| Member of parliament | Mark Pawsey (Conservative) |
| Number of members | One |
| Created from | Rugby & Kenilworth |
| 1885–1983 | |
| Number of members | One |
| Replaced by | Rugby & Kenilworth |
| Created from | North Warwickshire |
| Overlaps | |
| European Parliament constituency | West Midlands |
Rugby is a constituency[n 1] represented in the House of Commons of the UK Parliament since its 2010 recreation by Mark Pawsey, a Conservative.[n 2]
History
- 1885–1983
This constituency was created in a larger form under the Redistribution of Seats Act 1885 and lasted until 1983, seeing in the lifetime of that creation boundary modifications. Thereafter it was joined with Kenilworth in a combined seat.
- 2010-date
The Boundary Commission for England re-created a Rugby constituency as part of their review of parliamentary representation in Warwickshire. This was used for the first time at the 2010 general election.[n 3]
Boundaries
- Historic boundaries
When first created in 1885, the Rugby division consisted of the Petty Sessional Divisions of Rugby, Southam, Burton Dassett and Kington, and Kenilworth except the parishes of Lillington and Milverton. The division as recommended by the Boundary Commissioners had a population of 49,291 in the 1881 Census.[2]
Boundary changes in 1918 expanded the constituency to the south, while removing some areas near Leamington Spa. The constituency was defined as consisting of the Urban District of Rugby, the Rural Districts of Farnborough, Monks Kirby, Rugby and Southam, together with the majority of Brailes Rural district (excepting only the two parishes of Ilmington and Stretton-on-Fosse which were in a detached part of Warwickshire). Finally, the division included several parishes which were in the east of Stratford-on-Avon Rural District: Charlcote, Combrook, Compton Verney, Eatington, Kineton, Loxley, Moreton Morrell, Newbold Pacey, Wellesbourne Hastings and Wellesbourne Mountford.[3]
When changes were made to constituency boundaries in 1945 to split up some extremely large constituencies, Rugby was affected by the recommendations made as a result of the growth in electorate in the Coventry constituency. It gained some areas to the east of Coventry which had already been added to Rugby Rural District but were previously part of Nuneaton division. This change added about 2,000 voters.[4] The constituency was considerably reduced in area in boundary changes which came into effect in 1950, being reduced to simply the Municipal Borough of Rugby and the Rural District of Rugby.[5] No alteration in boundaries was made as part of the First Periodical Review of Boundaries in 1954,[6] and in the Second Periodical Review which came into effect in 1974, the definition remained the same although changes in local government boundaries meant that a minor change was made.[7]
The Third Periodical Review of constituency boundaries expanded the Rugby constituency to the west. The constituency lost 6,545 of its 60,909 electors, in and around the villages of Ansty and Wolvey, to Nuneaton. It then gained 16,600 electors from Kenilworth, resulting in its renaming as Rugby and Kenilworth.[8]
- Current boundaries
Parliament accepted the Boundary Commission's Fifth Periodic Review of Westminster constituencies which slightly altered this constituency for the 2010 general election since which it has electoral wards:
- Admirals; Avon and Swift; Benn; Bilton; Brownsover North; Brownsover South; Caldecott; Earl Craven and Wolston; Eastlands; Fosse; Hillmorton; Lawford and King’s Newnham; New Bilton; Newbold; Overslade; Paddox; Wolvey. in Rugby Borough
- Bulkington in the Borough of Nuneaton and Bedworth.[9][10]
Constituency profile
The constituency consists of Census Output Areas of two local government districts with similar characteristics and that forming the bulk has a working population whose income is slightly above to the national average and lower than average reliance upon social housing.[11] At the end of 2012 the unemployment rate in the constituency stood as 2.3% of the population claiming jobseekers allowance, compared to the regional average of 4.4%.[12]
The borough contributing to the bulk of the seat has a quite low 17.5% of its population without a car, 19.6% of the population without qualifications contrasted with a high 28.2% with level 4 qualifications or above by way of illustration. In terms of tenure 69.5% of homes are owned outright or on a mortgage as at the 2011 census across the district.[13]
Members of Parliament
MPs 1885–1983
| Event | Member[14] | Party | |
|---|---|---|---|
| 1885 | Henry Peyton Cobb | Liberal | |
| 1895 | Richard Greville Verney[n 4] | Conservative | |
| 1900 | Corrie Grant | Liberal | |
| Jan 1910 | John Lawrence Baird | Conservative | |
| 1922 | Euan Wallace | Conservative | |
| 1923 | Ernest Brown | Liberal | |
| 1924 | David Margesson | Conservative | |
| 1942 by-election | William Brown | Independent | |
| 1950 | James Johnson | Labour | |
| 1959 | Roy Wise | Conservative | |
| 1966 | William Price | Labour | |
| 1979 | Jim Pawsey | Conservative | |
| 1983 | constituency abolished | ||
MPs since 2010
| Election | Member[14] | Party | |
|---|---|---|---|
| 2010 | Mark Pawsey | Conservative | |
Elections
Elections in the 2010s
| General Election 2015: Rugby[15] | |||||
|---|---|---|---|---|---|
| Party | Candidate | Votes | % | ±% | |
| UKIP | Gordon Davies[16] | ||||
| Labour | Claire Edwards | ||||
| Liberal Democrat | Ed Goncalves | ||||
| TUSC | Pete McLaren | ||||
| Conservative | Mark Pawsey | ||||
| Green | Terry White | ||||
| Election | Political result | Candidate | Party | Votes | % | ±% | ||
|---|---|---|---|---|---|---|---|---|
| General Election 2010 [17] Electorate: 65,407 Turnout: 47,468 (68.9%) +1.5 | Conservative gain from Labour Majority: 6,000 (12.6%) +17.8 Swing: +8.9% from Lab to Con | Mark Pawsey | Conservative | 20,901 | 44.0 | +5.7 | ||
| Andy King | Labour | 14,901 | 31.4 | −12.1 | ||||
| Jerry Roodhouse | Liberal Democrat | 9,434 | 19.9 | +4.9 | ||||
| Mark Badrick | BNP | 1,375 | 2.9 | N/A | ||||
| Roy Sandison | Green | 451 | 1.0 | N/A | ||||
| Barry Milford | UKIP | 406 | 0.9 | −1.1 | ||||
Elections in the 1970s
| General Election 1979 | |||||
|---|---|---|---|---|---|
| Party | Candidate | Votes | % | ±% | |
| Conservative | Jim Pawsey | 24,417 | 47.3% | +10.0% | |
| Labour | William Price | 21,688 | 42.0% | -6.2% | |
| Liberal | B. Lomax | 4,945 | 9.6% | -4.7% | |
| National Front | A. Gresham | 551 | 1.0% | N/A | |
| Majority | 2,729 | 5.3% | -5.6% | ||
| Turnout | 51,603 | 83.9% | +4.1% | ||
| Conservative gain from Labour | Swing | ||||
| General Election October 1974 | |||||
|---|---|---|---|---|---|
| Party | Candidate | Votes | % | ±% | |
| Labour | William Price | 22,926 | 48.2% | -1.3% | |
| Conservative | Antony Rivers Marlow | 17,722 | 37.3% | -0.1% | |
| Liberal | A. Butcher | 6,775 | 14.3% | +1.4% | |
| Social Credit Party | A.S. Frost | 137 | 0.3% | +0.1% | |
| Majority | 5,204 | 10.9% | -1.2% | ||
| Turnout | 47,560 | 79.8% | -6.4% | ||
| Labour hold | Swing | ||||
| General Election February 1974 | |||||
|---|---|---|---|---|---|
| Party | Candidate | Votes | % | ±% | |
| Labour | William Price | 25,176 | 49.5% | -3.4% | |
| Conservative | Tim Boswell | 19,022 | 37.4% | -9.2% | |
| Liberal | J. Campbell | 6,560 | 12.9% | N/A | |
| Social Credit Party | A.S. Frost | 106 | 0.2% | -0.3% | |
| Majority | 6,154 | 12.1% | -5.9% | ||
| Turnout | 50,884 | 86.2% | +4.4% | ||
| Labour hold | Swing | ||||
| General Election 1970 | |||||
|---|---|---|---|---|---|
| Party | Candidate | Votes | % | ±% | |
| Labour | William Price | 25,041 | 52.8% | +2.8% | |
| Conservative | J.H.P. Griffith | 22,086 | 46.6% | -2.4% | |
| Social Credit Party | A.S. Frost | 254 | 0.5% | -0.4% | |
| Majority | 2,955 | 6.2% | +5.3% | ||
| Turnout | 47,381 | 81.8% | -3.1% | ||
| Labour hold | Swing | ||||
Elections in the 1960s
| General Election 1966 | |||||
|---|---|---|---|---|---|
| Party | Candidate | Votes | % | ±% | |
| Labour | William Price | 21,797 | 50.0% | +8.8% | |
| Conservative | Roy Wise | 21,388 | 49.0% | +3.9% | |
| Social Credit Party | A.S. Frost | 397 | 0.9% | +0.2% | |
| Majority | 409 | 0.9% | -3.1% | ||
| Turnout | 43,579 | 84.9% | +0.3% | ||
| Labour gain from Conservative | Swing | ||||
| General Election 1964 | |||||
|---|---|---|---|---|---|
| Party | Candidate | Votes | % | ±% | |
| Conservative | Roy Wise | 19,221 | 45.1 | +2.5 | |
| Labour | D.H. Childs | 17,532 | 41.2 | -0.2 | |
| Liberal | Simon Goldblatt | 5,522 | 13.0 | -2.7 | |
| Social Credit Party | A.S. Frost | 304 | 0.7 | N/A | |
| Majority | 1,689 | 4.0 | +2.8 | ||
| Turnout | 42,580 | 84.6 | -1.0 | ||
| Conservative hold | Swing | ||||
Elections in the 1950s
| General Election 1959 | |||||
|---|---|---|---|---|---|
| Party | Candidate | Votes | % | ±% | |
| Conservative | Roy Wise | 17,429 | 42.6 | -4.0 | |
| Labour | James Johnson | 16,959 | 41.4 | -8.7 | |
| Liberal | Simon Goldblatt | 6,413 | 15.7 | N/A | |
| Independent | A.S. Frost | 142 | 0.4 | N/A | |
| Majority | 470 | 1.2 | -2.3 | ||
| Turnout | 40,924 | 85.6 | +0.2 | ||
| Conservative gain from Labour | Swing | ||||
| General Election 1955 | |||||
|---|---|---|---|---|---|
| Party | Candidate | Votes | % | ±% | |
| Labour | James Johnson | 19,709 | 50.1% | -0.2% | |
| Conservative | H.B. Soref | 18,331 | 46.6% | -3.2% | |
| Independent | E.H. Shafer | 1,274 | 3.2% | N/A | |
| Majority | 1,378 | 3.5% | +3.0% | ||
| Turnout | 39,293 | 85.4% | -2.3% | ||
| Labour hold | Swing | ||||
| General Election 1951 | |||||
|---|---|---|---|---|---|
| Party | Candidate | Votes | % | ±% | |
| Labour | James Johnson | 19,995 | 50.3% | +0.3% | |
| Conservative | C.A.G. Dance | 19,796 | 49.7% | +11.4% | |
| Majority | 199 | 0.5% | -2.2% | ||
| Turnout | 39,808 | 87.7% | -0.5% | ||
| Labour hold | Swing | ||||
| General Election 1950 [18]
Electorate 44,228 | |||||
|---|---|---|---|---|---|
| Party | Candidate | Votes | % | ±% | |
| Labour | James Johnson | 15,983 | 50.0 | +27.3 | |
| Conservative | J. Dance | 14,947 | 38.3 | +1.6 | |
| Independent | William John Brown | 8,080 | 20.7 | -19.7 | |
| Majority | 1,036 | 2.7 | -0.7 | ||
| Turnout | 39,009 | 88.2 | +14.6 | ||
| Labour gain from Independent | Swing | ||||
Elections in the 1940s
| General Election 1945: Rugby[19]
Electorate 62,696 | |||||
|---|---|---|---|---|---|
| Party | Candidate | Votes | % | ±% | |
| Independent | William John Brown | 18,615 | 40.4 | -11.4 | |
| Conservative | Lt-Col. John Lakin | 17,049 | 37.0 | -11.2 | |
| Labour | Ronald Howard Lewis | 10,470 | 22.7 | n/a | |
| Majority | 1,566 | 3.4 | -0.2 | ||
| Turnout | 46,144 | 73.6 | +35.1 | ||
| Independent hold | Swing | -0.1 | |||
| By-election, 29 April 1942[20]
Electorate 47,752 | |||||
|---|---|---|---|---|---|
| Party | Candidate | Votes | % | ±% | |
| Independent | William John Brown | 9,824 | 51.8 | n/a | |
| Conservative | Lt-Col. Sir Claude Holbrook | 9,145 | 48.2 | -13.3 | |
| Majority | 679 | 3.6 | n/a | ||
| Turnout | 18,969 | 38.5 | -35.3 | ||
| Independent gain from Conservative | Swing | ||||
General Election 1939/40: Another general election was required to take place before the end of 1940. The political parties had been making preparations for an election to take place from 1939 and by the end of this year, the following candidates had been selected; Conservative: David Margesson, Liberal: M E Avery, Labour: A E Millett.
Elections in the 1930s
| General Election 1935 | |||||
|---|---|---|---|---|---|
| Party | Candidate | Votes | % | ±% | |
| Conservative | David Margesson | 20,905 | 61.6% | ||
| Labour | H William Fenner | 13,061 | 38.5% | ||
| Majority | 7,844 | 23.1% | |||
| Turnout | 33,966 | 73.8% | |||
| Conservative hold | Swing | ||||
| General Election 1931
Electorate 43,515 | |||||
|---|---|---|---|---|---|
| Party | Candidate | Votes | % | ±% | |
| Conservative | Henry David Reginald Margesson | 24,493 | |||
| Labour | E J Pay | 10,523 | |||
| Majority | |||||
| Turnout | |||||
| Conservative hold | Swing | ||||
Elections in the 1920s
| General Election 1929
Electorate 43,515 | |||||
|---|---|---|---|---|---|
| Party | Candidate | Votes | % | ±% | |
| Unionist | Henry David Reginald Margesson | 15,147 | |||
| Labour | John Morgan | 11,588 | |||
| Liberal | Robert Hamilton Bernays | 10,158 | |||
| Majority | |||||
| Turnout | |||||
| Unionist hold | Swing | ||||
| General Election 1924
Electorate 33,903 | |||||
|---|---|---|---|---|---|
| Party | Candidate | Votes | % | ±% | |
| Unionist | Henry David Reginald Margesson | 14,434 | |||
| Liberal | Alfred Ernest Brown | 10,524 | |||
| Labour | H Yates | 3,768 | |||
| Majority | |||||
| Turnout | |||||
| Unionist gain from Liberal | Swing | ||||
| General Election 1923
Electorate | |||||
|---|---|---|---|---|---|
| Party | Candidate | Votes | % | ±% | |
| Liberal | Alfred Ernest Brown | 13,798 | |||
| Unionist | David Euan Wallace | 11,286 | |||
| Majority | |||||
| Turnout | |||||
| Liberal gain from Unionist | Swing | ||||
| General Election 1922
Electorate 32,646 | |||||
|---|---|---|---|---|---|
| Party | Candidate | Votes | % | ±% | |
| Unionist | David Euan Wallace | 11,934 | |||
| Liberal | Hon. Arthur George Villiers Peel | 8,196 | |||
| Labour | T H Holt-Hughes | 4,940 | |||
| Majority | |||||
| Turnout | |||||
| Unionist hold | Swing | ||||
Elections in the 1910s
| General Election 1918
Electorate 31,726 | |||||
|---|---|---|---|---|---|
| Party | Candidate | Votes | % | ±% | |
| Unionist | 11,325 | ||||
| Liberal | Oscar Frederick Maclagan | 7,399 | |||
| Majority | |||||
| Turnout | |||||
| Unionist hold | Swing | ||||
A # denotes candidate who was endorsed by the Coalition Government.
See also
References
Craig, F. W. S. (1983). British parliamentary election results 1918-1949 (3 ed.). Chichester: Parliamentary Research Services. ISBN 0-900178-06-X.
Notes and references
- Notes
- ↑ A county constituency (for the purposes of election expenses and type of returning officer)
- ↑ As with all constituencies, the constituency elects one Member of Parliament (MP) by the first past the post system of election at least every five years.
- ↑ Kenilworth is since 2010 paired with Southam to form Kenilworth and Southam.
- ↑ Before birthright succession to the Lords as Baron Willoughby de Broke
- References
- ↑ "Electorate Figures – Boundary Commission for England". 2011 Electorate Figures. Boundary Commission for England. 4 March 2011. Retrieved 13 March 2011.
- ↑ "County of Warwick" in "Report of the Boundary Commissioners for England Wales, 1885" (C.-4287), vol I p. 165-7.
- ↑ "39. County of Warwick" in "Report of the Boundary Commission (England and Wales)", Cd. 8757, vol II.
- ↑ "Report in regard to the division of abnormally large Constituencies named in the Second Schedule to the Act", Boundary Commission for England, Cmd. 6634, p. 35-37.
- ↑ Initial Report of the Boundary Commission for England, Cmd. 7260, p. 48.
- ↑ "First Periodical Report", Boundary Commission for England, Cmd. 9311, p. 37.
- ↑ F. W. S. Craig, "Boundaries of British Parliamentary Constituencies 1885–1972", Political Reference Publications, Chichester, 1972, p. 144.
- ↑ "The BBC/ITN Guide to the New Parliamentary Constituencies", Parliamentary Research Services, 1983, pp. 114, 214.
- ↑ Colin Rallings, Michael Thrasher, "Media Guide to the New Parliamentary Constituencies", University of Plymouth, 2007, p. 139.
- ↑ 2010 post-revision map non-metropolitan areas and unitary authorities of England
- ↑ 2001 Census
- ↑ Unemployment claimants by constituency The Guardian
- ↑ 2011 census interactive maps
- ↑ 14.0 14.1 Leigh Rayment's Historical List of MPs – Constituencies beginning with "R" (part 2)
- ↑ http://ukpollingreport.co.uk/2015guide/Rugby/
- ↑ http://ukpollingreport.co.uk/2015guide/rugby/
- ↑ "UK > England > West Midlands > Rugby". Election 2010. BBC. 7 May 2010. Retrieved 12 May 2010.
- ↑ F W S Craig, British Parliamentary Election Results 1950-1973; Political Reference Publications, Glasgow 1949
- ↑ F W S Craig, British Parliamentary Election Results 1918-1949; Political Reference Publications, Glasgow 1949
- ↑ F W S Craig, British Parliamentary Election Results 1918-1949; Political Reference Publications, Glasgow 1949