Rossendale and Darwen (UK Parliament constituency)
Coordinates: 53°42′29″N 2°14′24″W / 53.708°N 2.240°W
| Rossendale and Darwen | |
|---|---|
|
Borough constituency for the House of Commons | |
|
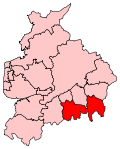
Boundary of Rossendale and Darwen in Lancashire. | |
|
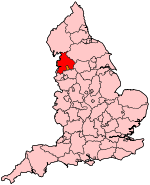
Location of Lancashire within England. | |
| County | Lancashire |
| Electorate | 73,443 (December 2010)[1] |
| Current constituency | |
| Created | 1983 |
| Member of parliament | Jake Berry (Conservative) |
| Number of members | One |
| Overlaps | |
| European Parliament constituency | North West England |
Rossendale and Darwen is a constituency[n 1] represented in the House of Commons of the UK Parliament since 2010 by Jake Berry, a Conservative.[n 2]
Boundaries
- 1983–2010
The constituency is made up as follows:
- The areas in and around Bacup and Rawtenstall
- The whole of the semi-rural 'district' of Darwen
- Grane, Helmshore & Ewood Bridge — part of the area surrounding Haslingden
- Buckhurst, Deeply Vale, Edenfield, Stubbins & Turn — part of the area in and around Ramsbottom
- The Belmont, Chapeltown, Edgworth and Entwistle — part of the area in and around Turton
- 2010-date
Following their review of parliamentary representation in the run-up to the United Kingdom general election, 2010, the Boundary Commission for England's accepted report by Parliament has led to revised boundaries. From the borough of Rossendale, twelve wards are used to create the seat: –
- Cribden, Eden, Facit and Shawforth, Goodshaw, Hareholme, Healey and Whitworth, Helmshore, Irwell, Longholme, Stacksteads and Whitewell.
Eight wards are as those used in local elections in the Blackburn with Darwen district: –
- Earcroft, East Rural, Fernhurst, Marsh House, North Turton with Tockholes, Sudell, Sunnyhurst and Whitehall.[2]
Constituency profile
The constituency consists of Census Output Areas of two local government districts with similar characteristics: a working population whose income is close to the national average but varying reliance upon social housing in relative terms to the national average.[3] At the end of 2012 the unemployment rate in the constituency stood as 3.5% of the population claiming jobseekers allowance, compared to the regional average of 4.2%.[4]
The borough of Rossendale that contributes to the bulk of the population has a 21.5% of its population without a car, whereas this is 30.5% in Blackburn and outside of the seat in Burnley is 32.3%. A relatively high 24% of Rossendale's population were in 2001 without qualifications and a high 25.1% were with level 4 qualifications or above. A higher share, 28.7% of Blackburn's population lacked qualifications, however 19.8% of its population had Level 4 qualifications or above.
In terms of tenure 69.6% of homes are owned outright or on a mortgage as at the 2011 census across the Rossendale district; this compares to a similar 63.7% across Blackburn. Whereas in Ribble Valley to the north 76.6% of homes fall within this category, in Leeds the figure is 58.2% and in Manchester just 37.8%.[5]
History
This constituency was created in 1983 and has alternated between the two largest parties MPs during this time; since 1997 the constituency has been a bellwether of the national result.
Members of Parliament
| Election | Member[6] | Party | |
|---|---|---|---|
| 1983 | David Trippier | Conservative | |
| 1992 | Janet Anderson | Labour | |
| 2010 | Jake Berry | Conservative | |
Elections
Elections in the 2010s
| General Election 2015: Rossendale and Darwen | |||||
|---|---|---|---|---|---|
| Party | Candidate | Votes | % | ±% | |
| Liberal Democrat | Afzal Anwar | ||||
| UKIP | Clive Robert Balchin | ||||
| Conservative | Jake Berry | ||||
| Northern Party | Shaun Hargreaves | N/A | |||
| Green | Karen Pollard-Rylance | N/A | |||
| Independent | Kevin Malcolm Scranage | N/A | |||
| Labour | Will Straw | ||||
| TUSC | Simon Thomas | ||||
| General Election 2010: Rossendale and Darwen[7] | |||||
|---|---|---|---|---|---|
| Party | Candidate | Votes | % | ±% | |
| Conservative | Jake Berry | 19,691 | 41.8 | +7.1 | |
| Labour | Janet Anderson | 15,198 | 32.2 | −10.7 | |
| Liberal Democrat | Bob Sheffield | 8,541 | 18.1 | +3.2 | |
| UKIP | David Duthie | 1,617 | 3.4 | +1.8 | |
| National Front | Kevin Bryan | 1,062 | 2.3 | N/A | |
| English Democrats | Michael Johnson | 663 | 1.4 | N/A | |
| Impact | Tony Melia | 243 | 0.5 | N/A | |
| Independent | Mike Siveri | 113 | 0.2 | N/A | |
| Majority | 4,493 | 9.5 | |||
| Turnout | 47,128 | 64.6 | +3.0 | ||
| Conservative gain from Labour | Swing | 8.9 | |||
Elections in the 2000s
| General Election 2005: Rossendale and Darwen | |||||
|---|---|---|---|---|---|
| Party | Candidate | Votes | % | ±% | |
| Labour | Janet Anderson | 19,073 | 42.9 | −5.8 | |
| Conservative | Nigel Adams | 15,397 | 34.6 | −2.1 | |
| Liberal Democrat | Mike Carr | 6,670 | 15.0 | +0.4 | |
| BNP | Anthony Wentworth | 1,736 | 3.9 | N/A | |
| Green | Graeme McIver | 821 | 1.8 | N/A | |
| UKIP | David Duthie | 740 | 1.7 | N/A | |
| Majority | 3,676 | 8.3 | |||
| Turnout | 44,437 | 61.5 | +2.8 | ||
| Labour hold | Swing | −1.9 | |||
| General Election 2001: Rossendale and Darwen | |||||
|---|---|---|---|---|---|
| Party | Candidate | Votes | % | ±% | |
| Labour | Janet Anderson | 20,251 | 49.0 | −4.6 | |
| Conservative | George Anderton Lee | 15,028 | 36.3 | +4.0 | |
| Liberal Democrat | Brian Frederick Dunning | 6,079 | 14.7 | +4.1 | |
| Majority | 5,223 | 12.6 | |||
| Turnout | 41,358 | 58.7 | −4.14.3 | ||
| Labour hold | Swing | −4.3 | |||
Elections in the 1990s
| General Election 1997: Rossendale and Darwen | |||||
|---|---|---|---|---|---|
| Party | Candidate | Votes | % | ±% | |
| Labour | Janet Anderson | 27,470 | 53.6 | +9.7 | |
| Conservative | Mrs. Patricia M. Buzzard | 16,521 | 32.3 | −11.4 | |
| Liberal Democrat | Brian Frederick Dunning | 5,435 | 10.6 | −0.7 | |
| Referendum Party | Roy R. Newstead | 1,108 | 2.2 | N/A | |
| BNP | Andrew Wearden | 674 | 1.3 | N/A | |
| Majority | 10,949 | 21.4 | |||
| Turnout | 51,208 | 73.0 | |||
| Labour hold | Swing | +10.6 | |||
| General Election 1992: Rossendale and Darwen[8] | |||||
|---|---|---|---|---|---|
| Party | Candidate | Votes | % | ±% | |
| Labour | Janet Anderson | 28,028 | 43.9 | +5.6 | |
| Conservative | David Trippier | 27,908 | 43.7 | −2.9 | |
| Liberal Democrat | Kevin Connor | 7,226 | 11.3 | −3.8 | |
| Green | Jim E. Gaffney | 596 | 0.9 | N/A | |
| Natural Law | Peter N. Gorrod | 125 | 0.2 | N/A | |
| Majority | 120 | 0.2 | −8.1 | ||
| Turnout | 63,883 | 83.0 | +2.8 | ||
| Labour gain from Conservative | Swing | +4.2 | |||
Elections in the 1980s
| General Election 1987: Rossendale and Darwen | |||||
|---|---|---|---|---|---|
| Party | Candidate | Votes | % | ±% | |
| Conservative | David Trippier | 28,056 | 46.6 | −0.4 | |
| Labour | Janet Anderson | 23,074 | 38.3 | +6.5 | |
| Liberal | Peter John Hulse | 9,097 | 15.1 | −6.1 | |
| Majority | 4,982 | 8.3 | |||
| Turnout | 60,227 | 80.3 | |||
| Conservative hold | Swing | −3.5 | |||
| General Election 1983: Rossendale and Darwen | |||||
|---|---|---|---|---|---|
| Party | Candidate | Votes | % | ±% | |
| Conservative | David Trippier | 27,214 | 47.0 | N/A | |
| Labour | Chris B. Robinson | 18,393 | 31.8 | N/A | |
| Liberal | Michael F. Taylor | 12,246 | 21.2 | N/A | |
| Majority | 8,821 | 15.2 | N/A | ||
| Turnout | 57,853 | 77.8 | N/A | ||
| Conservative win (new seat) | |||||
See also
Notes and references
- Notes
- References
- ↑ "Electorate Figures – Boundary Commission for England". 2011 Electorate Figures. Boundary Commission for England. 4 March 2011. Retrieved 13 March 2011.
- ↑ 2010 post-revision map Greater London and metropolitan areas of England
- ↑ 2001 Census
- ↑ Unemployment claimants by constituency The Guardian
- ↑ 2011 census interactive maps
- ↑ Leigh Rayment's Historical List of MPs – Constituencies beginning with "R" (part 2)
- ↑ Rossendale and Darwen, UKPollingReport
- ↑ "UK General Election results April 1992". Richard Kimber's Political Science Resources. Politics Resources. 9 April 1992. Retrieved 6 December 2010.

