Romsey (UK Parliament constituency)
Coordinates: 51°00′14″N 1°29′28″W / 51.004°N 1.491°W
| Romsey | |
|---|---|
|
Former County constituency for the House of Commons | |
|
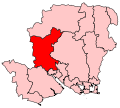
Boundary of Romsey in Hampshire for the 2005 general election. | |
|
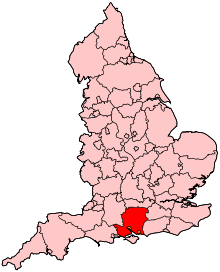
Location of Hampshire within England. | |
| County | Hampshire |
| 1983–2010 | |
| Number of members | One |
| Replaced by | Romsey and Southampton North |
| Created from | Eastleigh, New Forest |
Romsey was a parliamentary constituency represented in the House of Commons of the Parliament of the United Kingdom. It elected one Member of Parliament (MP) by the first past the post system of election.
Boundaries
The constituency was located in the Test Valley district of Hampshire, although it covered a smaller area with parts of the Test Valley to the north being part of the North West Hampshire constituency. The main town within the constituency was Romsey.
Boundary review
Following their review of parliamentary representation in Hampshire, the Boundary Commission for England created a modified Romsey constituency called Romsey and Southampton North, to reflect the fact that two wards of Southampton form part of the constituency (though one ward had in fact formed part of the constituency since 1997).
History
The constituency was created in 1983 from parts of the seats of Eastleigh and New Forest. It was originally named Romsey and Waterside and included areas such as Hythe and Fawley on the west side of Southampton Water. In 1997 it lost the Waterside area and gained the Bassett Ward of the City of Southampton, and new territory in the north of the Test Valley district, and was consequently renamed to just Romsey. The first MP, Michael Colvin, held the constituency from its creation until his death in 2000. This led to a by-election, which was won by Liberal Democrat Sandra Gidley, who held the seat in the two subsequent General Elections but lost to the Conservatives in the 2010 General Election where she contested the new Romsey and Southampton North constituency.
Members of Parliament
| Election | Member [1] | Party | |
|---|---|---|---|
| 1983 | constituency created as Romsey and Waterside | ||
| 1983 | Michael Colvin | Conservative | |
| 1997 | constituency renamed Romsey | ||
| 1997 | Michael Colvin | Conservative | |
| 2000 by-election | Sandra Gidley | Liberal Democrat | |
| 2010 | constituency abolished: see Romsey and Southampton North | ||
Elections
Elections in the 2000s
| General Election 2005: Romsey | |||||
|---|---|---|---|---|---|
| Party | Candidate | Votes | % | ±% | |
| Liberal Democrat | Sandra Gidley | 22,465 | 44.7 | −2.3 | |
| Conservative | Caroline Nokes | 22,340 | 44.4 | +2.3 | |
| Labour | Matthew Stevens | 4,430 | 8.8 | +0.6 | |
| UKIP | Michael Wigley | 1,076 | 2.1 | +0.6 | |
| Majority | 125 | 0.2 | |||
| Turnout | 50,311 | 69.7 | +2.5 | ||
| Liberal Democrat hold | Swing | −2.3 | |||
| General Election 2001: Romsey | |||||
|---|---|---|---|---|---|
| Party | Candidate | Votes | % | ±% | |
| Liberal Democrat | Sandra Gidley | 22,756 | 47.0 | +17.5 | |
| Conservative | Paul John Edward Raynes | 20,386 | 42.1 | -3.9 | |
| Labour | Stephen John Roberts | 3,986 | 8.2 | -10.3 | |
| UKIP | Anthony Martin McCabe | 730 | 1.5 | -2.0 | |
| Legalise Cannabis | Derrick Large | 601 | 1.2 | N/A | |
| Majority | 2,370 | 4.9 | |||
| Turnout | 48,459 | 67.2 | -9.2 | ||
| Liberal Democrat gain from Conservative | Swing | ||||
| By-election 2000: Romsey | |||||
|---|---|---|---|---|---|
| Party | Candidate | Votes | % | ±% | |
| Liberal Democrat | Sandra Gidley | 19,571 | 50.6 | +21.2 | |
| Conservative | Tim Palmer | 16,260 | 42.0 | −4.0 | |
| Labour | Andy Howard | 1,451 | 3.7 | −14.9 | |
| UKIP | Garry Rankin-Moore | 901 | 2.3 | −1.2 | |
| Legalise Cannabis | Derrick Large | 417 | 1.1 | +1.1 | |
| Independent (politician) | Thomas Lamont | 109 | 0.3 | +0.3 | |
| Majority | |||||
| Turnout | 55.4 | ||||
| Liberal Democrat gain from Conservative | Swing | ||||
Elections in the 1990s
| General Election 1997: Romsey | |||||
|---|---|---|---|---|---|
| Party | Candidate | Votes | % | ±% | |
| Conservative | Michael Colvin | 23,834 | 46.0 | ||
| Liberal Democrat | Mark Cooper | 15,249 | 29.4 | ||
| Labour | Joanne Ford | 9,623 | 18.6 | ||
| UKIP | Alan Sked | 1,824 | 3.5 | ||
| Referendum Party | Michael Wigley | 1,291 | 2.5 | ||
| Majority | 8,585 | 16.57 | |||
| Turnout | 76.36 | ||||
| Conservative hold | Swing | ||||
| General Election 1992: Romsey and Waterside | |||||
|---|---|---|---|---|---|
| Party | Candidate | Votes | % | ±% | |
| Conservative | Michael Colvin | 37,375 | 54.39 | ||
| Liberal Democrat | G Dawson | 22,071 | 32.12 | ||
| Labour | A Mawle | 8,688 | 12.64 | ||
| Green | J Spottiswood | 577 | 0.84 | ||
| Majority | 15,304 | 22.27 | |||
| Turnout | 83.16 | ||||
| Conservative hold | Swing | ||||
Elections in the 1980s
| General Election 1987: Romsey and Waterside | |||||
|---|---|---|---|---|---|
| Party | Candidate | Votes | % | ±% | |
| Conservative | Michael Colvin | 35,303 | 56.44 | ||
| Social Democratic | AT Bloss | 20,031 | 32.03 | ||
| Labour | SJ Roberts | 7,213 | 11.53 | ||
| Majority | 15,272 | 24.42 | |||
| Turnout | 79.04 | ||||
| Conservative hold | Swing | ||||
| General Election 1983: Romsey and Waterside | |||||
|---|---|---|---|---|---|
| Party | Candidate | Votes | % | ±% | |
| Conservative | Michael Colvin | 30,361 | 56.61 | ||
| Social Democratic | AT Bloss | 16,671 | 31.08 | ||
| Labour | M Knight | 6,604 | 12.31 | ||
| Majority | 13,690 | 25.52 | |||
| Turnout | 75.58 | ||||
| Conservative hold | Swing | ||||