Renewable energy in the United States


| Part of a series on Renewable energy |
|---|
Renewable energy in the United States accounted for 12.9 percent of the domestically produced electricity in 2013,[1] and 11.2 percent of total energy generation.[2] As of 2014, more than 143,000 people work in the solar industry and 43 states deploy net metering, where energy utilities buy back excess power generated by solar arrays.[3]
Renewable energy reached a major milestone in the first quarter of 2011, when it contributed 11.7 percent of total U.S. energy production (2.245 quadrillion BTUs of energy), surpassing energy production from nuclear power (2.125 quadrillion BTUs).[4] 2011 was the first year since 1997 that renewables exceeded nuclear in US total energy production.[5]
Hydroelectric power is currently the largest producer of renewable power in the U.S. It produced around 6.2% of the nation's total electricity in 2010 which was 60.2% of the total renewable power in the U.S.[6] The United States is the fourth largest producer of hydroelectricity in the world after China, Canada and Brazil. The Grand Coulee Dam is the 5th largest hydroelectric power station in the world.
U.S. wind power installed capacity now exceeds 60,000 MW and supplies 4% of the nation's electricity.[7][8] Texas is firmly established as the leader in wind power development, followed by Iowa and California.[9] Since the U.S. pioneered the technology with Solar One, several solar thermal power stations have also been built. The largest of these solar thermal power stations is the SEGS group of plants in the Mojave Desert with a total generating capacity of 354 MW, making the system the largest solar plant of any kind in the world.[10] The largest photovoltaic power plant in the world are the Desert Sunlight Solar Farm, a 550 MW solar power plant under construction in Riverside County, California[11] and the Topaz Solar Farm, a 550 MW photovoltaic power plant, being built in San Luis Obispo County, California.[12] The Geysers in Northern California is the largest complex of geothermal energy production in the world.
The development of renewable energy and energy efficiency marks "a new era of energy exploration" in the United States, according to President Barack Obama.[13] In a joint address to the Congress on February 24, 2009, President Obama called for doubling renewable energy within the next three years.[14] In his 2012 State of the Union address, President Barack Obama restated his commitment to renewable energy and mentioned the long-standing Interior Department commitment to permit 10,000 MW of renewable energy projects on public land in 2012.[15]
Rationale for renewables
Renewable energy technologies encompass a broad, diverse array of technologies, including solar photovoltaics, solar thermal power plants and heating/cooling systems, wind farms, hydroelectricity, geothermal power plants, and ocean power systems and the use of biomass.
The report Outlook On Renewable Energy In America explains that America needs renewable energy, for many reasons:
America needs energy that is secure, reliable, improves public health, protects the environment, addresses climate change, creates jobs, and provides technological leadership. America needs renewable energy. If renewable energy is to be developed to its full potential, America will need coordinated, sustained federal and state policies that expand renewable energy markets; promote and deploy new technology; and provide appropriate opportunities to encourage renewable energy use in all critical energy market sectors: wholesale and distributed electricity generation, thermal energy applications, and transportation.[16]
In 2009, President Barack Obama in the inaugural address called for the expanded use of renewable energy to meet the twin challenges of energy security and climate change. Those were the first references ever to the nation's energy use, to renewable resources, and to climate change in an inauguration speech of a U.S. president. President Obama looked to the near future, saying that as a nation, the United States will "harness the sun and the winds and the soil to fuel our cars and run our factories."[17]
The president's New Energy For America plan calls for a federal investment of $150 billion over the next decade to catalyze private efforts to build a clean energy future. Specifically, the plan calls for renewable energy to supply 10% of the nation's electricity by 2012, rising to 25% by 2025.[17]
In his joint address to Congress in 2009, Obama stated that: "We know the country that harnesses the power of clean, renewable energy will lead the 21st. century....Thanks to our recovery plan, we will double this nation’s supply of renewable energy in the next three years... It is time for America to lead again".[14]
According to Clean Edge, there's little doubt that the future of energy will be cleaner. The transition from carbon-intensive energy sources like wood, coal, and oil to natural gas and renewables, is well underway. For much of the developed world, and for developing nations, the "future looks increasingly like it will be built off of a mix of energy efficiency, renewables, the electrification of transport, and lower carbon fuels like natural gas".[18]
A 2010 survey conducted by Applied Materials shows that two-thirds of Americans believe solar technology should play a greater role in meeting the country's energy needs. In addition, "three-quarters of Americans feel that increasing renewable energy and decreasing U.S. dependence on foreign oil are the country's top energy priorities". According to the survey, "67 percent of Americans would be willing to pay more for their monthly utility bill if their utility company increased its use of renewable energy".[19]
In a 2010 Chicago Council on Global Affairs public opinion survey, an overwhelming 91 percent believed "investing in renewable energy" is important for the United States to remain economically competitive with other countries, with 62 percent considering this very important. The same poll found strong support for tax incentives to encourage development of renewable energy sources specifically as a way to reduce foreign energy imports. Eight in ten (80 percent) favored tax incentives, 47 percent strongly, and only 17 percent were opposed.[20]
As of 2011, new evidence has emerged that there are considerable risks associated with traditional energy sources, and that major changes to the mix of energy technologies is needed:
Several mining tragedies globally have underscored the human toll of the coal supply chain. New EPA initiatives targeting air toxics, coal ash, and effluent releases highlight the environmental impacts of coal and the cost of addressing them with control technologies. The use of fracking in natural gas exploration is coming under scrutiny, with evidence of groundwater contamination and greenhouse gas emissions. Concerns are increasing about the vast amounts of water used at coal-fired and nuclear power plants, particularly in regions of the country facing water shortages. Events at the Fukushima nuclear plant have renewed doubts about the ability to operate large numbers of nuclear plants safely over the long term. Further, cost estimates for “next generation” nuclear units continue to climb, and lenders are unwilling to finance these plants without taxpayer guarantees.[21]
Current trends

Renewable energy in the United States accounted for 12.87 percent of the domestically produced electricity in 2013.[22] California is a leading state and around 20 percent of California's electricity comes from RPS eligible renewable sources, and more if traditional hydropower sources are included.[23]
The United States has some of the best renewable energy resources in the world, which have the potential to meet a rising and significant share of the nation's energy demand. A quarter of the U.S. land area has winds strong enough to generate electricity at the same price as natural gas and coal.[24]
Many of the new technologies that harness renewables — including wind, solar, geothermal, and biofuels — are, or soon will be, economically competitive with the fossil fuels that meet 85 percent of U.S. energy needs. Dynamic growth rates are driving down costs and spurring rapid advances in technologies.[24] Energy technologies also receive government subsidies. In 2010, federal government subsidies for electricity production from renewables, fossil fuels, and nuclear were $6560 million, $1843 million and $2499 million respectively.[6]
All but four U.S. states now have incentives in place to promote renewable energy, while more than a dozen have enacted new renewable energy laws in recent years.[24]
Renewable energy suffered a political setback in the United States in September 2011 with the bankruptcy of Solyndra, a company that had received a $535 million federal loan guarantee.[25][26]
| Year | Hydro | Geothermal | Waste | Wood | CSP | Utility PV | Rooftop PV | Onshore Wind | Offshore Wind | Renewable Total | U.S. Total | % Renewable |
|---|---|---|---|---|---|---|---|---|---|---|---|---|
| 2002 | 264.33 | 14.49 | 15.04 | 38.66 | 0.555 | 10.34 | 0 | 343.44 | 3858.45 | 8.90% | ||
| 2003 | 275.81 | 14.24 | 15.81 | 37.53 | 0.534 | 11.19 | 0 | 355.29 | 3883.18 | 9.15% | ||
| 2004 | 268.42 | 14.81 | 15.42 | 38.12 | 0.575 | 14.14 | 0 | 351.48 | 3970.56 | 8.85% | ||
| 2005 | 270.32 | 14.69 | 15.42 | 38.86 | 0.550 | 17.81 | 0 | 357.65 | 4055.42 | 8.82% | ||
| 2006 | 289.25 | 14.57 | 16.10 | 38.76 | 0.508 | 26.59 | 0 | 385.77 | 4064.70 | 9.49% | ||
| 2007 | 247.51 | 14.64 | 16.52 | 39.01 | 0.612 | 34.45 | 0 | 352.75 | 4156.74 | 8.49% | ||
| 2008 | 254.83 | 14.84 | 17.73 | 37.30 | 0.864 | 55.36 | 0 | 417.72 | 4119.39 | 10.14% | ||
| 2009 | 273.44 | 15.01 | 18.16 | 36.05 | 0.74 | 0.16 | 1.93 | 74.12 | 0 | 419.59 | 3950.31 | 10.62% |
| 2010 | 257.08 | 15.67 | 18.59 | 37.61 | 0.82 | 0.46 | 3.21 | 94.95 | 0 | 428.38 | 4125.06 | 10.38% |
| 2011 | 325.07 | 16.70 | 19.79 | 36.95 | 1.82 | 5.64 | 119.75 | 0 | 520.07 | 4105.73 | 12.67% | |
| 2012 | 276.24 | 15.56 | 19.82 | 37.8 | 4.33 | 8.45 | 140.82 | 0 | 513.4 | 4047.76 | 12.22% | |
| 2013 | 269.14 | 16.52 | 19.96 | 39.94 | 9.25 | 167.66 | 0 | 522.46 | 4058.21 | 12.87% | ||
The United States uses about 4,000 billion kWh/year of electricity, in 2012, and about 98 Quadrillion btu/year (30,000 billion kWh). Due to efficiency improvements this is expected to drop to 15,000 billion kWh by 2050. The United States has the potential of installing 11 million MW of onshore wind power and 4 million MW of offshore wind power, capable of generating over 47,000 billion kWh. Solar has the potential of installing 10 to 20 million MW of concentrated solar power in the Southwest, capable of generating over 10,000 billion kWh. Other than geothermal, no other resources come close to providing the energy demands of the United States in a post fossil fuel world.[28]
| Monthly renewable data.[29] for 2012 shows the yearly profile of renewable energy generation. |  |
| Using data from Electric Power Annual 2012 [30] the expected renewable generating capabilities for different fuel sources is shown in the chart. A total of 173.45 Gigawatts of renewable would be available by 2017. This is up 17.65 Gigawatts from 2012. |  |
| Using this generating capability and the capacity factors from 2012 data
will result in a total of 540.14 Giga Kilowatt hours (G Kwhrs) of renewable electric energy in 2017. This is up 45.57 G Kwhrs from 2012. |
 |
| In 2012 the mix of each states renewable electric generation as a percentage of its total renewable energy generation is shown in the following chart.[31] |  2012 USA STATES RENEWABLE ELECTRICAL GENERATION |
Hydroelectricity

Hydroelectric power is currently the largest producer of renewable power in the U.S. It produced around 6.3% of the nation's total electricity in 2013 which was 51.5% of the total renewable power in the U.S.[6] The United States is the fourth largest producer of hydroelectricity in the world after China, Canada and Brazil. The Grand Coulee Dam is the 5th largest hydroelectric power station in the world and another six U.S. hydro plants are among the 50 largest in the world. The amount of hydroelectric power generated is strongly affected by changes in precipitation and surface runoff.
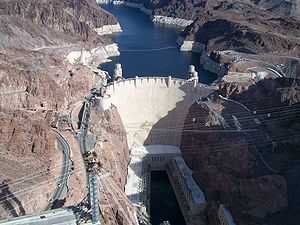
Hydroelectric plants exist in at least 34 US states. Hydroelectricity projects such as Hoover Dam, Grand Coulee Dam, and the Tennessee Valley Authority have become iconic large construction projects.
| Name | Year of completion | Total Capacity (MW) | |
|---|---|---|---|
| 1 | Grand Coulee | 1942/1980 | 6,809[32] |
| 2 | Chief Joseph Dam | 1958/73/79 | 2,620 |
| 3 | Robert Moses Niagara Power Plant | 1961 | 2,515 |
| 4 | John Day Dam | 1949 | 2,160 |
| 5 | Bath County PSP | 1985 | 2,100 |
| 6 | Hoover Dam | 1936/1961 | 2,080 |
| 7 | The Dalles Dam | 1981 | 2,038 |
The contribution over the last ten years of hydroelectric power to the renewable power generation and to the total US power generation is shown below along with the yearly profile of the hydroelectric power generation for 2013. This shows the typical variations over the months of the year due to resource availability and needs.
| Year | Summer Capacity (GW) | Electrical energy (G kWh) | Capacity factor | Yearly growth of Generating Capacity | Yearly growth of produced Energy | Portion of renewable electrical energy | Portion of total electrical energy |
|---|---|---|---|---|---|---|---|
| 2013 | 79.02 | 269.14 | 0.389 | 0.41% | -2.57% | 51.51% | 6.63% |
| 2012 | 78.7 | 276.24 | 0.401 | 0.06% | -13.50% | 55.85% | 6.82% |
| 2011 | 78.65 | 319.36 | 0.464 | -0.23% | 22.74% | 62.21% | 7.79% |
| 2010 | 78.83 | 260.2 | 0.377 | 0.39% | -4.85% | 60.88% | 6.31% |
| 2009 | 78.52 | 273.45 | 0.398 | 0.76% | 7.31% | 65.47% | 6.92% |
| 2008 | 77.93 | 254.83 | 0.373 | 0.05% | 2.96% | 66.90% | 6.19% |
| 2007 | 77.89 | 247.51 | 0.363 | 0.09% | -14.43% | 70.18% | 5.95% |
| 2006 | 77.82 | 289.25 | 0.424 | 0.36% | 7.00% | 74.97% | 7.12% |
| 2005 | 77.54 | 270.32 | 0.398 | -0.13% | 0.71% | 75.57% | 6.67% |
| 2004 | 77.64 | 268.42 | 0.395 | -1.33% | -2.68% | 76.36% | 6.76% |
Wind power


U.S. wind power installed capacity now exceeds 60,007 MW.[8] This capacity is exceeded only by China. The 1,320MW Alta Wind Energy Center is the largest wind farm in the world. Shepherds Flat Wind Farm in Oregon is the second largest wind farm in the world, completed in 2012, with the nameplate capacity of 845 MW.[35]
The U.S. wind industry generates tens of thousands of jobs and billions of dollars of economic activity.[36] Wind projects boost local tax bases, and revitalize the economy of rural communities by providing a steady income stream to farmers with wind turbines on their land.[34] GE Energy is the largest domestic wind turbine manufacturer.[34] In 2010 it also received $4986 million in federal funding, which is 42% of all federal funding for electrity generation.[6]
In 2012 there were 8,900 MW under construction in nearly 100 projects.[37] The United States has the potential of installing 10 million MW of onshore wind power and 4 million MW of offshore wind.[38] The U.S. Department of Energy’s report 20% Wind Energy by 2030 envisioned that wind power could supply 20% of all U.S. electricity, which included a contribution of 4% from offshore wind power.[36] Additional transmission lines will need to be added, to bring power from windy states to the rest of the country.[39] In August 2011, a coalition of 24 governors asked the Obama administration to provide a more favorable business climate for the development of wind power.[40]
These are some of the largest wind farms in the United States, as of 2015:
| Wind farm | Current capacity (MW) |
Notes |
|---|---|---|
| Alta (Oak Creek-Mojave) | 1,320 | [41] |
| Buffalo Gap Wind Farm | 523.3 | [42][43] |
| Capricorn Ridge Wind Farm | 662.5 | [42][43] |
| Cedar Creek Wind Farm | 551 | |
| Fowler Ridge Wind Farm | 599.8 | [44] |
| Horse Hollow Wind Energy Center | 735.5 | [42][43] |
| Meadow Lake Wind Farm | 500 | [44] |
| Roscoe Wind Farm | 781.5 | [45] |
| Shepherds Flat Wind Farm | 845 | |
| Sweetwater Wind Farm | 585.3 | [42] |
The contribution over the last ten years of wind electric power to the renewable power generation and to the total US power generation is shown below along with the yearly profile of the wind electric power generation for 2013. This shows the typical variations over the months of the year due to wind availability.
| Year | Summer Capacity (GW) | Electrical energy (G kWh) | Capacity factor | Yearly growth of Generating Capacity | Yearly growth of produced Energy | Portion of renewable electrical energy | Portion of total electrical energy |
|---|---|---|---|---|---|---|---|
| 2013 | 60.37 | 167.67 | 0.317 | 2.18% | 19.07% | 32.09% | 4.13% |
| 2012 | 59.08 | 140.82 | 0.272 | 29.33% | 17.17% | 28.47% | 3.48% |
| 2011 | 45.68 | 120.18 | 0.300 | 16.71% | 26.97% | 23.41% | 2.93% |
| 2010 | 39.14 | 94.65 | 0.276 | 14.11% | 28.10% | 22.15% | 2.29% |
| 2009 | 34.3 | 73.89 | 0.246 | 39.15% | 33.47% | 17.69% | 1.87% |
| 2008 | 24.65 | 55.36 | 0.256 | 49.21% | 60.70% | 14.53% | 1.34% |
| 2007 | 16.52 | 34.45 | 0.238 | 45.81% | 29.56% | 9.77% | 0.83% |
| 2006 | 11.33 | 26.59 | 0.268 | 30.08% | 49.30% | 6.89% | 0.65% |
| 2005 | 8.71 | 17.81 | 0.233 | 34.83% | 25.95% | 4.98% | 0.44% |
| 2004 | 6.46 | 14.14 | 0.250 | 7.67% | 26.36% | 4.02% | 0.36% |
Solar thermal power
.jpg)
In 2012, the Bureau of Land Management made available 97.9 million acres of land for solar projects, adequate for 10 million MW of solar power tower or 20 million MW of parabolic trough. Of this, 17 "Solar Energy Zones", were identified, which could produce from 42,554 MW - 76,577 MW.[46]
Solar Energy Generating Systems
Solar Energy Generating Systems (SEGS) is the name given to nine solar power plants in the Mojave Desert. SEGS I-VII are located at Kramer Junction, and SEGS VIII and IX are at Harper Lake and Barstow respectively. The SEGS power plants were commissioned between 1984 and 1991.[10]
The installation uses parabolic trough solar thermal technology along with natural gas to generate electricity. The facility has a total of 400,000 mirrors and covers 1,000 acres (4 km²). The plants have a total generating capacity of 354 MW, making the system the largest solar plant of any kind in the world.[10]
Nevada Solar One
Nevada Solar One generates 64MW of power and in Boulder City, Nevada, and was built by the U.S. Department of Energy (DOE), National Renewable Energy Laboratory (NREL), and Solargenix Energy. Nevada Solar One started producing electricity in June 2007.
Nevada Solar One uses parabolic troughs as thermal solar concentrators, heating tubes of liquid which act as solar receivers. These solar receivers are specially coated tubes made of glass and steel. About 19,300 of these 4 metre long tubes are used in the newly built power plant. Nevada Solar One also uses a technology that collects extra heat by putting it into phase-changing molten salts. This energy can then be drawn on at night.[47]
Solar thermal power plants designed for solar-only generation are well matched to summer noon peak loads in prosperous areas with significant cooling demands, such as the south-western United States. Using thermal energy storage systems, solar thermal operating periods can even be extended to meet base-load needs.[48]
Ivanpah Solar Power Facility
The Ivanpah Solar Power Facility is a 392 megawatt (MW) solar power facility which is located in south-eastern California.[49] The facility formally opened on February 13, 2014.[50]
Others
The Solana Generating Station is a 280 MW solar power plant which is near Gila Bend, Arizona, about 70 miles (110 km) southwest of Phoenix. The 250MW Mojave Solar Project is located near Barstow, California. The Crescent Dunes Solar Energy Project is a 110 megawatt (MW) solar thermal power project near Tonopah, about 190 miles (310 km) northwest of Las Vegas.[51]
Land use issues
Solar thermal power plants are large, but when looking at electricity output versus total size, they use less land than hydroelectric dams (including the size of the lake behind the dam) or coal plants (including the amount of land required for mining and excavation of the coal).[52] Some of the land in the eastern portion of the Mojave Desert is to be preserved, but the solar industry is more interested in areas of the western desert, "where the sun burns hotter and there is easier access to transmission lines".[53]
Generation

The contribution to the US electric grid over the last ten years of solar thermal electric power to the renewable power generation and to the total US power generation is shown below along with the yearly profile of the solar thermal power generation for 2013. This shows the typical variations over the months of the year due to sunlight availability. Before 2008 most of solar generated electric energy was from thermal systems. By 2011, photovoltaics had overtaken thermal.
| Year | Summer Capacity (GW) | Electrical energy (G kWh) | Capacity factor | Yearly growth of Generating Capacity | Yearly growth of produced Energy | Portion of renewable electrical energy | Portion of total electrical energy |
|---|---|---|---|---|---|---|---|
| 2013 | 1.24 | 0.926 | 0.178 | 160.50% | 5.71% | 0.18% | 0.02% |
| 2012 | 0.476 | 0.876 | 0.238 | 1.06% | 8.68% | 0.18% | 0.02% |
| 2011 | 0.471 | 0.806 | 0.239 | 2.15% | 0.16% | 0.02% | |
| 2010 | 0.789 | 0.245 | 7.35% | 0.18% | 0.02% | ||
| 2009 | 0.735 | 0.236 | -6.73% | 0.18% | 0.02% | ||
| 2008 | 0.788 | 0.195 | 32.21% | 0.21% | 0.02% | ||
| 2007 | 0.596 | 20.89% | 0.17% | 0.01% | |||
| 2006 | 0.493 | -7.85% | 0.13% | 0.01% | |||
| 2005 | 0.535 | -5.98% | 0.15% | 0.01% | |||
| 2004 | 0.569 | 0.16% | 0.01% |
Solar photovoltaic power
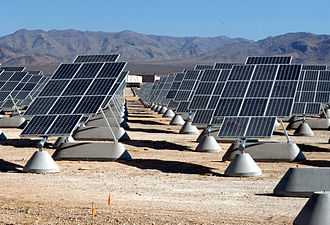
The US added an estimated 3.3 GW of capacity in 2012.[54] Key projects include:
The Copper Mountain Solar Facility is a 48 megawatt (MW) solar photovoltaic (PV) power plant in Boulder City, Nevada.[55] Sempra Generation began construction of the plant in January 2010 and on December 1, 2010, the company announced that it had finished the project and the facility was generating electricity.[55]
The 32 MW Long Island Solar Farm (LISF) is the largest photovoltaic array in the eastern U.S. It earned the Best Photovoltaic Project of Year Award from the New York Solar Energy Industries Association. The LISF is made up of 164,312 solar panels which provide enough electricity for roughly 4,500 households. Additionally, the project will cause the abatement of more than 30,000 metric tons of carbon dioxide emissions per year.[56]
The 25 MW DeSoto Next Generation Solar Energy Center in Florida consists of over 90,000 solar panels.[57]
The Nellis Solar Power Plant was completed in December, 2007. It is located at Nellis Air Force Base in Clark County, Nevada. It includes approximately 70,000 solar panels and the peak power generation capacity of the plant is approximately 15 megawatts.[58][59]

There are also many large plants under construction. The Desert Sunlight Solar Farm is a 550 MW solar power plant under construction in Riverside County, California, that will use thin-film solar photovoltaic modules made by First Solar.[11] The Topaz Solar Farm is a 550 MW photovoltaic power plant, being built in San Luis Obispo County, California.[12] The Blythe Solar Power Project is a 500 MW photovoltaic station under construction in Riverside County, California. The Agua Caliente Solar Project is a 290 megawatt photovoltaic solar generating facility being built in Yuma County, Arizona. The California Valley Solar Ranch (CVSR) is a 250 megawatt (MW) solar photovoltaic power plant, which is being built by SunPower in the Carrizo Plain, northeast of California Valley.[60]
Many schools and businesses have building-integrated photovoltaic solar panels on their roof. Most of these are grid connected and use net metering laws to allow use of electricity in the evening that was generated during the daytime. New Jersey leads the nation with the least restrictive net metering law, while California leads in total number of homes which have solar panels installed. Many were installed because of the million solar roof initiative.[61] California has decided that it is not moving forward fast enough on photovoltaic generation and in 2008 enacted a feed-in tariffs. Washington state has a feed-in tariff of 15 ¢/kWh which increases to 54 ¢/kWh if components are manufactured in the state.[62] Hawaii and Michigan are also considering feed in tariffs.
The contribution to the US electric grid over the last ten years of solar photovoltaic electric power to the renewable power generation and to the total US power generation is shown below along with the yearly profile of the photovoltaic power generation for 2013. This shows the typical variations over the months of the year due to sunlight availability. Before 2008 most of solar generated electric energy was from thermal systems. By 2011, photovoltaics had overtaken thermal.

| Year | Summer Capacity (GW) | Electrical energy (G kWh) | Capacity factor | Yearly growth of Generating Capacity | Yearly growth of produced Energy | Portion of renewable electrical energy | Portion of total electrical energy |
|---|---|---|---|---|---|---|---|
| 2013 | 4.98 | 8.33 | 0.194 | 85.13% | 141.45% | 1.59% | 0.21% |
| 2012 | 2.69 | 3.45 | 0.203 | 156.19% | 241.58% | 0.70% | 0.09% |
| 2011 | 1.05 | 1.01 | 0.191 | 138.77% | 0.20% | 0.02% | |
| 2010 | 0.423 | 0.203 | 169.43% | 0.10% | 0.01% | ||
| 2009 | 0.157 | 0.206 | 106.58% | 0.04% | 0.00% | ||
| 2008 | 0.076 | 0.225 | 375.00% | 0.02% | 0.00% | ||
| 2007 | 0.016 | 6.67% | 0.00% | 0.00% | |||
| 2006 | 0.015 | -6.25% | 0.00% | 0.00% | |||
| 2005 | 0.016 | 166.67% | 0.00% | 0.00% | |||
| 2004 | 0.006 | 0.00% | 0.00% | 0.00% |
Geothermal power
The USA is the world leader in online capacity and the generation of electricity from geothermal energy.[63] According to 2005 state energy data, geothermal energy provided approximately 16 billion kilowatt hours (kWh) of electricity—0.37% of the electricity consumed in the U.S. As of May 2007, geothermal electric power was generated in five U.S. states: Alaska, California, Hawaii, Nevada, and Utah. According to the Geothermal Energy Association's recent report, there were 75 new geothermal power projects underway in 12 states as of May 2007 . This is an increase of 14 projects in an additional three states compared to a survey completed in November 2006.[63]
The most significant catalyst behind new industry activity is the Energy Policy Act of 2005. This Act made new geothermal plants eligible for the full federal production tax credit, previously available only to wind power projects. It also authorized and directed increased funding for research by the Department of Energy, and gave the Bureau of Land Management new legal guidance and secure funding to address its backlog of geothermal leases and permits.[63]
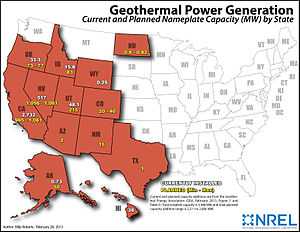
Installed geothermal capacity in megawatts (MW) by state as of February 2013:[64]
| State | Capacity (MW) | Share of U.S total |
|---|---|---|
| California | 2,732.2 | 80.7% |
| Nevada | 517.5 | 15.3% |
| Utah | 48.1 | 1.4% |
| Hawaii | 38.0 | 1.1% |
| Oregon | 33.3 | 1.0% |
| Idaho | 15.8 | 0.5% |
| Alaska | 0.7 | <0.1% |
| Wyoming | 0.3 | <0.1% |
| Total | 3,385.9 | 100% |
The contribution over the last ten years of geothermal power to the renewable power generation and to the total US power generation is shown below along with the yearly profile of the geothermal power generation for 2013.

| Year | Summer Capacity (GW) | Electrical energy (G kWh) | Capacity factor | Yearly growth of Generating Capacity | Yearly growth of produced Energy | Portion of renewable electrical energy | Portion of total electrical energy |
|---|---|---|---|---|---|---|---|
| 2013 | 2.688 | 16.517 | 0.701 | 3.70% | 6.14% | 3.16% | 0.41% |
| 2012 | 2.592 | 15.562 | 0.685 | 7.60% | 1.61% | 3.15% | 0.38% |
| 2011 | 2.409 | 15.316 | 0.726 | 0.17% | 0.64% | 2.98% | 0.37% |
| 2010 | 2.405 | 15.219 | 0.722 | 0.97% | 1.40% | 3.56% | 0.37% |
| 2009 | 2.382 | 15.009 | 0.719 | 6.86% | 1.14% | 3.59% | 0.38% |
| 2008 | 2.229 | 14.84 | 0.760 | 0.68% | 1.39% | 3.90% | 0.36% |
| 2007 | 2.214 | 14.637 | 0.755 | -2.64% | 0.47% | 4.15% | 0.35% |
| 2006 | 2.274 | 14.568 | 0.731 | -0.48% | -0.84% | 3.78% | 0.36% |
| 2005 | 2.285 | 14.692 | 0.734 | 6.18% | -0.80% | 4.11% | 0.36% |
| 2004 | 2.152 | 14.811 | 0.786 | 0.89% | 2.68% | 4.21% | 0.37% |
Solar water heating
More than 1.5 million homes and businesses currently use solar water heating in the United States, representing a capacity of over 1,000 megawatts (MW) of thermal energy generation. Another 400 MW is likely to be installed over the next 3–5 years, according to the US Department of Energy. Assuming that 40 percent of existing homes in the United States have adequate access to sunlight, 29 million solar water heaters could be installed.[65]
Solar water heaters can operate in any climate. Performance varies depending on how much solar energy is available at the site, as well as how cold the water coming into the system is. The colder the water, the more efficiently the system operates.[65]
Solar water heaters reduce the need for conventional water heating by about two-thirds and pay for their installation within 4 to 8 years with electricity or natural gas savings. Compared to those with electric water heaters, Florida homeowners with solar water heaters save 50 to 85 percent on their water heating bills, according to the Florida Solar Energy Center.[65]
Biomass
In the twelve months through April 2013, biomass generated 57 million megawatt-hours, 1.4% of total US electricity. It was the largest source of total renewable energy in the US, and the third-largest renewable source of electrical power in the US, after hydropower and wind.[66]
Biomass is biological material derived from living, or recently living organisms, such as plants and trees and utilizes wastes or plant matter specifically grown to generate electricity or produce heat. The main advantage of using grown fuels, as opposed to fossil fuels such as coal, natural gas and oil, is that while they are growing they absorb the near-equivalent in carbon dioxide (an important greenhouse gas) to that which is later released in their burning. Although there is some debate over the net carbon neutrality and near term affects of using the biomass for energy a key difference is the relatively short carbon recycle period of grown biomass (several years or decades) as opposed to the millions of years it took to turn carbon into fossil fuels. With proper conservation and growing techniques biomass can be an important renewable energy source.
Biomass can be utilized for all three major energy needs: electricity, heating/cooling and transportation fuels. However, each usage is distinctly different from the others, especially regarding efficiency - the percentage of energy utilized from the biomass source. Whereas pellets for heating can be up to 90% efficient, bio-electricity plants are comparable to coal power plants, with around 30% efficiency, and biofuels from crops or algae even less.
Biomass electric generation data is best summarized in two categories: 1) Wood and wood derived fuels including wood/wood waste solids (including paper pellets, railroad ties, utility poles, wood chiips, bark and wood waste solids), wood waste liquids (red liquor, sludge wood, spent sulfite liquor, and other wood based liquids), and black liquor. and, 2) Other biomass fuels include municipal solid waste, landfill gas, sludge waste agricultural byproducts, other biomass solids, other biomass liquids, and other biomass gases (including digester gases, methane, and other biomass gases). The contribution from these two categories over the last ten years of biomass electric power to the renewable power generation and to the total US power generation is shown below along with the yearly profile of the electric power generation for 2013. This shows the typical variations over the months of the year due to fuel availability and needs.
| United States Electric Generation Data | ||||||||||||||||||||||||||||||||||||||||||||||||||||||||||||||||||||||||||||||||||||||||||||||||||||||||||||||||||||||||||||||||||||||||||||||||||||||||||||||||||||||||||||||||||
|---|---|---|---|---|---|---|---|---|---|---|---|---|---|---|---|---|---|---|---|---|---|---|---|---|---|---|---|---|---|---|---|---|---|---|---|---|---|---|---|---|---|---|---|---|---|---|---|---|---|---|---|---|---|---|---|---|---|---|---|---|---|---|---|---|---|---|---|---|---|---|---|---|---|---|---|---|---|---|---|---|---|---|---|---|---|---|---|---|---|---|---|---|---|---|---|---|---|---|---|---|---|---|---|---|---|---|---|---|---|---|---|---|---|---|---|---|---|---|---|---|---|---|---|---|---|---|---|---|---|---|---|---|---|---|---|---|---|---|---|---|---|---|---|---|---|---|---|---|---|---|---|---|---|---|---|---|---|---|---|---|---|---|---|---|---|---|---|---|---|---|---|---|---|---|---|---|---|---|
|


Biofuels

Most cars on the road today in the U.S. can run on blends of up to 10% ethanol, and motor vehicle manufacturers already produce vehicles designed to run on much higher ethanol blends. Ford, DaimlerChrysler, and GM are among the automobile companies that sell “flexible-fuel” cars, trucks, and minivans that can use gasoline and ethanol blends ranging from pure gasoline up to 85% ethanol (E85). By mid-2006, there were approximately six million E85-compatible vehicles on U.S. roads.[67]
The challenge is to expand the market for biofuels beyond the farm states where they have been most popular to date.[68] Flex-fuel vehicles are assisting in this transition because they allow drivers to choose different fuels based on price and availability. The Energy Independence and Security Act of 2007, which calls for 15.2 billion US gallons (58,000,000 m3) of biofuels to be used annually by 2012, will also help to expand the market.[67]
The expanding ethanol and biodiesel industries are providing jobs in plant construction, operations, and maintenance, mostly in rural communities. According to the Renewable Fuels Association, the ethanol industry created almost 154,000 U.S. jobs in 2005 alone, boosting household income by $5.7 billion. It also contributed about $3.5 billion in tax revenues at the local, state, and federal levels.[67] On the other hand, in 2010, the biofuel industry received $6644 million in federal government support.[6]
Wave Power

Wave power in the United States is under development in several locations off the east & west coasts as well as Hawaii. It has moved beyond the research phase and is producing reliable energy. Its use to-date has been for situations where other forms of energy production are not economically viable and as such, the power output is currently modest. But major installations are planned to come on-line within the next few years.
Renewable energy research
There are numerous organizations within the academic, federal, and commercial sectors conducting large scale advanced research in the field of renewable energy. This research spans several areas of focus across the renewable energy spectrum. Most of the research is targeted at improving efficiency and increasing overall energy yields.[69] Multiple federally supported research organizations have focused on renewable energy in recent years. Two of the most prominent of these labs are Sandia National Laboratories and the National Renewable Energy Laboratory (NREL), both of which are funded by the United States Department of Energy and supported by various corporate partners.[70] Sandia has a total budget of $2.4 billion [71] while NREL has a budget of $375 million.[72]
Both Sandia National Laboratories and the National Renewable Energy Laboratory (NREL), have heavily funded solar research programs. British Petroleum was also heavily invested in solar research programs until 2008 when the company began scaling back its solar operations. The company finally shut down its forty-year-old solar business after executives decided solar power production is not economically competitive.[73] The NREL solar program has a budget of around $75 million [74] and develops research projects in the areas of photovoltaic (PV) technology, solar thermal energy, and solar radiation.[75] The budget for Sandia’s solar division is unknown, however it accounts for a significant percentage of the laboratory’s $2.4 billion budget.[76] Several academic programs have focused on solar research in recent years. The Solar Energy Research Center (SERC) at University of North Carolina (UNC) has the sole purpose of developing cost effective solar technology. In 2008, researchers at Massachusetts Institute of Technology (MIT) developed a method to store solar energy by using it to produce hydrogen fuel from water.[77] Such research is targeted at addressing the obstacle that solar development faces of storing energy for use during nighttime hours when the sun is not shining. In February 2012, North Carolina-based Semprius Inc., a solar development company backed by German corporation Siemens, announced that they had developed the world’s most efficient solar panel. The company claims that the prototype converts 33.9% of the sunlight that hits it to electricity, more than double the previous high-end conversion rate.[78]
Wind energy research dates back several decades to the 1970s when NASA developed an analytical model to predict wind turbine power generation during high winds.[79] Today, both Sandia National Laboratories and National Renewable Energy Laboratory have programs dedicated to wind research. Sandia’s laboratory focuses on the advancement of materials, aerodynamics, and sensors.[80] The NREL wind projects are centered on improving wind plant power production, reducing their capital costs, and making wind energy more cost effective overall.[81] The Field Laboratory for Optimized Wind Energy (FLOWE) at Caltech was established to research renewable approaches to wind energy farming technology practices that have the potential to reduce the cost, size, and environmental impact of wind energy production.[82]
As the primary source of biofuels in North America, many organizations are conducting research in the area of ethanol production. On the Federal level, the USDA conducts a large amount of research regarding ethanol production in the United States. Much of this research is targeted toward the effect of ethanol production on domestic food markets.[83] The National Renewable Energy Laboratory has conducted various ethanol research projects, mainly in the area of cellulosic ethanol.[84] Cellulosic ethanol has many benefits over traditional corn based-ethanol. It does not take away or directly conflict with the food supply because it is produced from wood, grasses, or non-edible parts of plants.[85] Moreover, some studies have shown cellulosic ethanol to be more cost effective and economically sustainable than corn-based ethanol.[86] Sandia National Laboratories conducts in-house cellulosic ethanol research [87] and is also a member of the Joint BioEnergy Institute (JBEI), a research institute founded by the United States Department of Energy with the goal of developing cellulosic biofuels.[88]
Over $1 billion of federal money has been spent on the research and development of hydrogen fuel in the United States.[89] Both the National Renewable Energy Laboratory [90] and Sandia National Laboratories [91] have departments dedicated to hydrogen research.
Policy and promotion in the United States
In his January 24, 2012, State of the Union address, President Barack Obama restated his commitment to renewable energy. Obama said that he “will not walk away from the promise of clean energy.” Obama called for a commitment by the Defense Department to purchase 1,000 MW of renewable energy. He also mentioned the long-standing Interior Department commitment to permit 10,000 MW of renewable energy projects on public land in 2012.[15]
Wind Powering America
Wind Powering America (WPA) is an initiative of the United States Department of Energy (DOE) that seeks to increase the use of wind energy throughout the United States. WPA collaborates with key state and regional stakeholders, including farmers, ranchers, Native Americans, rural electric cooperatives, consumer-owned utilities, and schools to break down barriers associated with wind energy development.
Throughout its history, WPA has focused on states with strong potential for wind energy generation but with few operational projects. WPA provides fair and unbiased information about the challenges, benefits, and impacts of wind technology implementation. This information allows policymakers, organizations, and citizens to make educated and informed decisions about wind energy implementation in their communities.
Solar America Initiative
The Solar America Initiative (SAI)[92] is a part of the Federal Advanced Energy Initiative to accelerate the development of advanced photovoltaic materials with the goal of making it cost-competitive with other forms of renewable electricity by 2015.
The U.S. Department of Energy Solar Energy Technology Program (SETP) will achieve the goals of the SAI through partnerships and strategic alliances by focusing primarily on four areas:
- Market Transformation — activities that address marketplace barriers and offer the opportunity for market expansion
- Device and Process Proof of Concept — R&D activities addressing novel devices or processes with potentially significant performance or cost advantages
- Component Prototype and Pilot-Scale Production — R&D activities emphasizing development of prototype PV components or systems produced at pilot-scale with demonstrated cost, reliability, or performance advantages
- System Development and Manufacturing — collaborative R&D activities among industry and university partners to develop and improve solar energy technologies
California Solar Initiative
As part of Governor Arnold Schwarzenegger's Million Solar Roofs Program, California has set a goal to create 3,000 megawatts of new, solar-produced electricity by 2017 - moving the state toward a cleaner energy future and helping lower the cost of solar systems for consumers. This is a comprehensive $2.8 billion program.[93]
The California Solar Initiative offers cash incentives on solar PV systems of up to $2.50 a watt. These incentives, combined with federal tax incentives, can cover up to 50% of the total cost of a solar panel system.[93] It should also be noted that there are many financial incentives to support the use of renewable energy in other US states.[94]
EPA initiatives
To promote energy efficiency and environmentally sensitive energy generation, Environmental Protection Agency facilities in the United States are using renewable energy technologies to supplement or replace a large portion of their energy requirements at the following facilities:
- Ada, Oklahoma (geothermal heat pump)
- Ann Arbor, Michigan (fuel cell)
- Chicago, Illinois, Regional Office (photovoltaic array)
- Corvallis, Oregon (photovoltaic array)
- Edison, New Jersey (solar water heating)
- Gulf Breeze, Florida (solar lighting)
- Golden, Colorado (wind power and transpired solar collector)
- Manchester, Washington (wind power)
- Research Triangle Park, North Carolina (photovoltaic solar panels and street lights).[95]
Green Power Partnership
The U.S. Environmental Protection Agency (EPA) has named the top 20 partners in its Green Power Partnership that are generating their own renewable energy on-site. Combined, the top 20 partners are generating more than 736 million kilowatt-hours of renewable energy on-site each year, enough to power more than 61,000 average U.S. homes.[96]
Renewable portfolio standards
A Renewable Portfolio Standard refers to legislation that creates a market in tradeable renewable or green electricity certificates. Electricity distributors or wholesaler purchasers of electricity are required to source a specified percentage of their electricity (portfolio) from renewable generation sources. Liable entities that fall short of their quota can purchase certificates from accredited suppliers who have generated renewable electricity and obtained and registered certificates to sell on that market.
Sales to the grid
The Energy Policy Act of 2005 requires all public electric utilities to facilitate net metering upon request by customers.[97] This allows homes and businesses performing distributed generation to pay only the net cost of electricity from the grid: electricity used minus electricity produced locally and sent back into the grid. For intermittent renewable energy sources, like wind and solar, this effectively uses the grid as a giant battery to smooth over lulls and fill in production gaps.
Some jurisdictions go one step further and have instituted feed-in tariff, which allows any power customer to actually make money by producing more renewable energy than is consumed locally.
Renewable energy organizations
The American Council on Renewable Energy (ACORE), is a non-profit organization with headquarters in Washington DC. It was founded in 2001 as a unifying forum for bringing renewable energy into the mainstream of American’s economy and lifestyle. In 2010 ACORE had over 700 member organizations.[98] In 2007, ACORE published Outlook On Renewable Energy In America, a two volume report about the future of renewable energy in the United States.[99] It has been said that this report exposes a "new reality for renewable energy in America."[100]
The Environmental and Energy Study Institute (EESI) is a non-profit organization which promotes environmentally sustainable societies. Founded in 1984 by a group of Congressional Members, EESI seeks to be a catalyst that moves society away from environmentally damaging fossil fuels and toward a clean energy future. EESI presents policy solutions that will result in decreased global warming and air pollution; improvements in public health, energy security and rural economic development opportunities; increased use of renewable energy sources and improved energy efficiency.
An important part of the mission of the National Renewable Energy Laboratory (NREL) is the transfer of NREL-developed technologies to renewable energy markets. NREL's Technology Transfer Office supports laboratory scientists and engineers in the successful and practical application of their expertise and the technologies they develop. R&D staff and facilities are recognized and valued by industry, as demonstrated through many collaborative research projects and licensed technologies with public and private partners. NREL's innovative technologies have also been recognized with 39 R&D 100 Awards.
The Rocky Mountain Institute (RMI) is an organization dedicated to research, publication, consulting, and lecturing in the general field of sustainability, with a special focus on profitable innovations for energy and resource efficiency. RMI is headquartered in Snowmass, Colorado, and also maintains offices in Boulder, Colorado. RMI has recently published the book Winning the Oil Endgame.
Statistics
Data from the US DOE Energy Information Administration/Electric Power Monthly[101] and the most recent DOE Energy Information Agency (EIA) full year files[102] provide a good summary of progress being made in renewables.
| Power Source | Summer Capacity (GW) | % of total Capacity | Capacity factor | Annual Energy (billion kWh) | % of annual production |
|---|---|---|---|---|---|
| Hydro | 79.02 | 7.42 | 0.389 | 269.14 | 6.63 |
| Wind | 60.37 | 5.67 | 0.317 | 167.67 | 4.13 |
| Wood | 8.201 | 0.77 | 0.354 | 39.937 | 0.98 |
| Biomass | 5.04 | 0.47 | 0.452 | 19.96 | 0.47 |
| GeoThermal | 2.688 | 0.25 | 0.701 | 16.517 | 0.41 |
| Solar | 6.22 | 0.58 | 0.17 | 9.25 | 0.23 |
| Total | 161.67 | 15.18 | 0.309 | 522.46 | 12.87 |
| Year | All US Total | Renewable | |||||||
|---|---|---|---|---|---|---|---|---|---|
| Hydro | Wind | Wood | Bio other |
Geo Thermal |
Solar | Total | % of US Total | ||
| 2013 | 4,058.21 | 269.14 | 167.67 | 39.94 | 19.96 | 16.52 | 9.25 | 522.46 | 12.87 |
| 2012 | 4,047.76 | 276.24 | 140.82 | 37.8 | 19.82 | 15.56 | 4.33 | 494.57 | 12.22 |
| 2011 | 4,100.7 | 319.4 | 120.2 | 37.4 | 19.2 | 15.3 | 1.814 | 513.4 | 12.52 |
| 2010 | 4,125.1 | 260.2 | 94.7 | 37.2 | 18.9 | 15.2 | 1.212 | 427.4 | 10.36 |
| 2009 | 3,950.3 | 273.4 | 73.9 | 36.1 | 18.4 | 15.0 | 0.891 | 417.7 | 10.57 |
| 2008 | 4,119.4 | 254.8 | 55.4 | 37.3 | 17.7 | 14.8 | 0.864 | 380.9 | 9.25 |
| 2007 | 4,156.7 | 247.5 | 34.5 | 39.0 | 16.5 | 14.6 | 0.612 | 352.7 | 8.49 |
| 2006 | 4,064.7 | 289.2 | 26.6 | 38.8 | 16.1 | 14.6 | 0.508 | 385.8 | 9.49 |
| 2005 | 4,055.4 | 270.3 | 17.8 | 38.9 | 15.4 | 14.7 | 0.550 | 357.7 | 8.82 |
| 2004 | 3,970.6 | 268.4 | 14.1 | 38.1 | 15.4 | 14.8 | 0.575 | 351.5 | 8.85 |
| 2003 | 3,883.2 | 275.8 | 11.2 | 37.5 | 15.8 | 14.4 | 0.534 | 355.3 | 9.15 |
| 2002 | 3,858.5 | 264.3 | 10.4 | 38.7 | 15.0 | 14.5 | 0.555 | 343.4 | 8.90 |
| 2001 | 3,736.6 | 217.0 | 6.7 | 35.2 | 14.5 | 13.7 | 0.543 | 287.7 | 7.70 |
| 2000 | 3,802.1 | 275.6 | 5.6 | 37.6 | 23.1 | 14.1 | 0.493 | 356.5 | 9.38 |
| 1999 | 3,694.8 | 319.5 | 4.5 | 37.0 | 22.6 | 14.8 | 0.495 | 399.0 | 10.80 |
| 1998 | 3,620.3 | 323.3 | 3.0 | 36.3 | 22.4 | 14.8 | 0.502 | 400.4 | 11.06 |
- Bio Other includes Waste, Landfill Gas, and Other.
- Solar includes Photovoltaics and Thermal.
Potential resources
A 2012 report by the National Renewable Energy Laboratory evaluates the potential energy resources for each state of the United States.[103][104]
| Total Technical Potential | |||
|---|---|---|---|
| Type | Resource | Capacity (GW) | Potential (TWh) |
| Solar | Urban utility-scale PV | 1,200 | 2,200 |
| Rural utility-scale PV | 153,000 | 280,600 | |
| Rooftop PV | 664 | 800 | |
| Concentrating solar power | 38,000 | 116,100 | |
| Total | 192,922 | 399,810 | |
| Wind | Onshore wind power | 11,000 | 32,700 |
| Offshore wind power | 4,200 | 17,000 | |
| Total | 15,178 | 49,760 | |
| Bioenergy | Biomass/biofuel/methane | 62 | 488 |
| Total | 62 | 488 | |
| Geothermal | Hydrothermal power systems | 38 | 300 |
| Enhanced geothermal systems | 3,976 | 31,300 | |
| Total | 4,014 | 31,653 | |
| Hydro | Hydropower | 60 | 259 |
| Total | 60 | 259 | |
| Total | 212,236 | 481,970 | |
In 2010, the U.S. used 3,754 TWh of electricity. Total energy used in 2010 was 98.16 Quadrillion Btu (28,800 TWh, but over 30% is thermal losses).
| Technical Potential for each State | ||||||||||||
|---|---|---|---|---|---|---|---|---|---|---|---|---|
| Solar | Wind | |||||||||||
| Urban Utility Scale PV | Rural Utility Scale PV | Rooftop PV | Concentrating Solar Power (CSP) | Onshore Wind Power | Offshore Wind Power | |||||||
| State | MW | GWh | MW | GWh | MW | GWh | MW | GWh | MW | GWh | MW | GWh |
| Alabama | 20,453 | 35,851 | 2,114,792 | 3,706,839 | 12,516 | 15,476 | 0 | 0 | 118 | 283 | 0 | 0 |
| Alaska | 112 | 166 | 9,005,193 | 8,282,976 | 1,292 | NA | 0 | 0 | 493,346 | 1,373,433 | NA | NA |
| Arizona | 52,611 | 121,306 | 5,147,087 | 11,867,694 | 14,880 | 22,736 | 3,527,624 | 12,544,334 | 10,904 | 26,036 | NA | NA |
| Arkansas | 15,957 | 28,961 | 2,747,478 | 4,986,389 | 6,773 | 8,485 | 0 | 0 | 9,200 | 22,892 | NA | NA |
| California | 111,404 | 246,008 | 4,010,367 | 8,855,917 | 75,908 | 106,411 | 2,725,676 | 8,490,916 | 34,110 | 89,862 | 654,833 | 2,662,580 |
| Colorado | 19,167 | 43,471 | 4,514,218 | 10,238,084 | 11,797 | 16,162 | 3,097,836 | 9,154,524 | 387,219 | 1,096,036 | NA | NA |
| Connecticut | 4,833 | 7,717 | 12,293 | 19,628 | 5,903 | 6,616 | 0 | 0 | 27 | 62 | 7,171 | 26,545 |
| Delaware | 9,120 | 14,856 | 167,170 | 272,333 | 1,876 | 2,185 | 0 | 0 | 10 | 22 | 15,038 | 60,654 |
| Florida | 39,850 | 72,787 | 2,812,653 | 5,137,347 | 49,407 | 63,987 | 130 | 359 | 0.40 | 1 | 9,649 | 34,684 |
| Georgia | 24,274 | 43,167 | 3,088,465 | 5,492,183 | 24,607 | 31,116 | 0 | 0 | 130 | 323 | 58,629 | 220,807 |
| Hawaii | 1,667 | 3,725 | 20,674 | 38,033 | 2,729 | NA | 5,539 | 15,370 | 2,468 | 7,787 | 736,945 | 2,836,735 |
| Idaho | 12,051 | 23,195 | 2,045,422 | 3,936,848 | 3,224 | 4,051 | 1,267,223 | 3,502,877 | 18,076 | 44,320 | NA | NA |
| Illinois | 63,597 | 103,552 | 4,969,164 | 8,090,985 | 26,312 | 30,086 | 0 | 0 | 249,882 | 649,468 | 15,872 | 66,070 |
| Indiana | 61,175 | 98,815 | 3,018,749 | 4,876,186 | 14,856 | 17,151 | 0 | 0 | 148,228 | 377,604 | 45 | 166 |
| Iowa | 15,574 | 27,092 | 4,020,606 | 6,994,159 | 7,191 | 8,646 | 0 | 0 | 570,714 | 1,723,588 | NA | NA |
| Kansas | 15,218 | 31,706 | 6,959,792 | 14,500,149 | 6,872 | 8,962 | 2,884,816 | 7,974,256 | 952,371 | 3,101,576 | NA | NA |
| Kentucky | 16,271 | 26,515 | 1,119,323 | 1,823,977 | 10,538 | 12,312 | 0 | 0 | 61 | 147 | NA | NA |
| Louisiana | 32,391 | 55,669 | 2,394,054 | 4,114,605 | 11,840 | 14,368 | 0 | 0 | 410 | 935 | 340,615 | 1,200,699 |
| Maine | 1,925 | 3,216 | 658,689 | 1,100,327 | 2,141 | 2,443 | 0 | 0 | 11,251 | 28,743 | 147,418 | 631,960 |
| Maryland | 18,180 | 28,551 | 373,097 | 585,949 | 12,738 | 14,850 | 0 | 0 | 1,483 | 3,632 | 51,909 | 200,852 |
| Massachusetts | 10,959 | 17,470 | 51,568 | 82,205 | 10,316 | 11,723 | 0 | 0 | 1,028 | 2,827 | 184,076 | 799,344 |
| Michigan | 33,570 | 50,845 | 3,443,547 | 5,215,640 | 21,520 | 23,528 | 0 | 0 | 59,042 | 143,908 | 422,577 | 1,739,801 |
| Minnesota | 20,128 | 33,370 | 6,510,103 | 10,792,814 | 12,486 | 14,322 | 0 | 0 | 489,271 | 1,428,525 | 29,215 | 100,455 |
| Mississippi | 15,243 | 26,366 | 2,879,856 | 4,981,252 | 6,968 | 8,614 | 0 | 0 | 0 | 0 | 3,213 | 10,172 |
| Missouri | 18,076 | 30,549 | 3,156,806 | 5,335,269 | 13,081 | 16,160 | 0 | 0 | 274,355 | 689,519 | NA | NA |
| Montana | 6,115 | 11,371 | 4,402,766 | 8,187,341 | 1,877 | 2,194 | 557,224 | 1,540,288 | 944,005 | 2,746,272 | NA | NA |
| Nebraska | 6,808 | 12,954 | 4,869,920 | 9,266,757 | 4,228 | 5,337 | 1,753,455 | 4,846,929 | 917,999 | 3,011,253 | NA | NA |
| Nevada | 10,785 | 24,894 | 3,732,055 | 8,614,454 | 7,137 | 10,767 | 2,557,909 | 8,295,753 | 7,247 | 17,709 | NA | NA |
| New Hampshire | 2,351 | 3,790 | 35,578 | 57,364 | 2,062 | 2,299 | 0 | 0 | 2,135 | 5,706 | 3,456 | 14,478 |
| New Jersey | 25,301 | 44,307 | 251,127 | 439,774 | 13,691 | 15,768 | 0 | 0 | 132 | 317 | 101,935 | 429,808 |
| New Mexico | 30,991 | 71,356 | 7,087,301 | 16,318,543 | 4,223 | 6,513 | 4,860,165 | 16,812,349 | 492,084 | 1,399,157 | NA | NA |
| New York | 32,764 | 52,803 | 926,127 | 1,492,566 | 25,149 | 28,780 | 0 | 0 | 25,781 | 63,566 | 146,077 | 614,280 |
| North Carolina | 37,894 | 68,346 | 2,346,827 | 4,232,790 | 23,096 | 28,420 | 0 | 0 | 808 | 2,037 | 306,020 | 1,269,627 |
| North Dakota | 2,744 | 4,871 | 5,482,940 | 9,734,448 | 1,622 | 1,917 | 13,042 | 36,050 | 770,195 | 2,537,825 | NA | NA |
| Ohio | 57,143 | 86,496 | 2,395,600 | 3,626,182 | 27,475 | 30,064 | 0 | 0 | 54,920 | 129,143 | 41,804 | 170,561 |
| Oklahoma | 25,619 | 50,041 | 4,782,752 | 9,341,920 | 9,337 | 12,443 | 1,812,952 | 5,068,036 | 516,822 | 1,521,652 | NA | NA |
| Oregon | 12,992 | 25,783 | 1,884,815 | 3,740,479 | 7,842 | 8,323 | 1,017,332 | 2,812,126 | 27,100 | 68,767 | 225,008 | 962,723 |
| Pennsylvania | 36,196 | 56,162 | 356,630 | 553,356 | 19,902 | 22,215 | 0 | 0 | 3,307 | 8,231 | 5,674 | 23,571 |
| Rhode Island | 1,160 | 1,788 | 8,844 | 13,636 | 1,534 | 1,711 | 0 | 0 | 47 | 130 | 20,965 | 89,115 |
| South Carolina | 19,099 | 33,835 | 1,555,141 | 2,754,973 | 11,531 | 14,413 | 0 | 0 | 185 | 428 | 133,217 | 542,218 |
| South Dakota | 2,442 | 4,574 | 5,344,810 | 10,008,873 | 1,682 | 2,083 | 589,556 | 1,629,660 | 882,413 | 2,901,858 | NA | NA |
| Tennessee | 28,598 | 50,243 | 1,266,995 | 2,225,990 | 16,227 | 19,685 | 0 | 0 | 309 | 766 | NA | NA |
| Texas | 154,251 | 294,684 | 20,411,044 | 38,993,582 | 60,256 | 78,717 | 7,743,420 | 22,786,750 | 1,901,530 | 5,552,400 | 271,443 | 1,101,063 |
| Utah | 14,057 | 30,492 | 2,390,260 | 5,184,878 | 5,645 | 7,514 | 1,638,154 | 5,067,547 | 13,104 | 31,552 | NA | NA |
| Vermont | 1,058 | 1,632 | 35,487 | 54,728 | 1,030 | 1,115 | 0 | 0 | 2,949 | 7,796 | NA | NA |
| Virginia | 15,664 | 27,451 | 1,074,135 | 1,882,467 | 18,669 | 22,267 | 0 | 0 | 1,794 | 4,589 | 89,073 | 361,054 |
| Washington | 19,313 | 33,690 | 996,410 | 1,738,151 | 13,494 | 13,599 | 58,502 | 161,713 | 18,479 | 47,250 | 120,964 | 488,025 |
| DC | 5 | 8 | 0 | 0 | 2,100 | 2,490 | 0 | 0 | 0 | 0 | NA | NA |
| West Virginia | 2,009 | 3,024 | 35,004 | 52,694 | 3,810 | 4,220 | 0 | 0 | 1,883 | 4,952 | NA | NA |
| Wisconsin | 34,930 | 54,939 | 3,205,830 | 5,042,259 | 12,262 | 13,939 | 0 | 0 | 103,757 | 255,266 | 80,672 | 317,755 |
| Wyoming | 3,604 | 7,232 | 2,854,267 | 5,727,224 | 1,170 | 1,551 | 1,955,846 | 5,406,407 | 552,073 | 1,653,857 | NA | NA |
| TOTAL | 1,217,699 | 2,231,694 | 152,973,829 | 280,613,217 | 664,825 | 818,733 | 38,066,401 | 116,146,245 | 10,954,759 | 32,784,005 | 4,223,514 | 16,975,802 |
| Technical Potential for each State | |||||||||||||
|---|---|---|---|---|---|---|---|---|---|---|---|---|---|
| Bioenergy | Geothermal | Hydro | Electricity[105] | Total use[106] | |||||||||
| Biomass/Biofuel | Methane | Hydrothermal | Enhanced Geothermal | Hydropower | Total | 2010 | 2010 | ||||||
| State | MW | GWh | MW | GWh | MW | GWh | MW | GWh | MW | GWh | GWh | GWh | GWh |
| Alabama | 1,420 | 11,193 | 194 | 1,533 | 0 | 0 | 67,921 | 535,490 | 937 | 4,103 | 4,310,767 | 90,873 | 574,000 |
| Alaska | 65 | 513 | 8 | 62 | 1,958 | 15,437 | NA | NA | 5,405 | 23,676 | 9,696,264 | 6,247 | 188,000 |
| Arizona | 138 | 1,088 | 106 | 837 | 1,056 | 8,330 | 157,172 | 1,239,148 | 298 | 1,303 | 25,832,811 | 72,833 | 410,000 |
| Arkansas | 1,824 | 14,381 | 135 | 1,063 | 0 | 0 | 79,734 | 628,622 | 1,391 | 6,093 | 5,696,886 | 48,194 | 330,000 |
| California | 1,574 | 12,408 | 1,967 | 15,511 | 16,605 | 130,921 | 170,495 | 1,344,179 | 6,855 | 30,024 | 21,984,738 | 258,531 | 2,293,000 |
| Colorado | 370 | 2,913 | 155 | 1,224 | 1,135 | 8,954 | 158,759 | 1,251,658 | 1,778 | 7,789 | 21,820,815 | 52,918 | 445,000 |
| Connecticut | 63 | 495 | 53 | 415 | 0 | 0 | 7,113 | 56,078 | 211 | 922 | 118,478 | 30,392 | 221,000 |
| Delaware | 65 | 512 | 49 | 385 | 0 | 0 | 2,894 | 22,813 | 7 | 31 | 373,792 | 11,606 | 75,000 |
| Florida | 1,226 | 9,664 | 468 | 3,693 | 0 | 0 | 47,458 | 374,161 | 156 | 682 | 5,697,366 | 231,210 | 1,284,000 |
| Georgia | 1,862 | 14,682 | 282 | 2,221 | 0 | 0 | 44,800 | 353,206 | 454 | 1,988 | 6,159,694 | 140,672 | 925,000 |
| Hawaii | 66 | 524 | 25 | 200 | 2,617 | 20,632 | NA | NA | 594 | 2,602 | 2,925,608 | 10,017 | 80,000 |
| Idaho | 733 | 5,776 | 23 | 183 | 2,182 | 17,205 | 125,984 | 993,257 | 4,283 | 18,758 | 8,546,469 | 22,798 | 156,000 |
| Illinois | 3,518 | 27,738 | 536 | 4,222 | 0 | 0 | 85,750 | 676,056 | 1,115 | 4,883 | 9,653,061 | 144,761 | 1,154,000 |
| Indiana | 1,895 | 14,942 | 378 | 2,978 | 0 | 0 | 55,081 | 434,258 | 547 | 2,394 | 5,824,494 | 105,994 | 841,000 |
| Iowa | 3,488 | 27,502 | 181 | 1,425 | 0 | 0 | 76,914 | 606,390 | 643 | 2,818 | 9,391,621 | 45,445 | 437,000 |
| Kansas | 1,535 | 12,104 | 96 | 753 | 0 | 0 | 125,530 | 989,676 | 573 | 2,508 | 26,621,690 | 40,421 | 342,000 |
| Kentucky | 894 | 7,048 | 162 | 1,274 | 0 | 0 | 61,474 | 484,659 | 972 | 4,255 | 2,360,187 | 93,569 | 579,000 |
| Louisiana | 1,778 | 14,016 | 109 | 857 | 0 | 0 | 61,425 | 484,271 | 553 | 2,423 | 5,887,844 | 85,080 | 1,191,000 |
| Maine | 542 | 4,273 | 16 | 125 | 0 | 0 | 47,828 | 377,075 | 894 | 3,916 | 2,152,079 | 11,532 | 119,000 |
| Maryland | 267 | 2,102 | 156 | 1,227 | 0 | 0 | 10,990 | 86,649 | 186 | 814 | 924,626 | 65,335 | 434,000 |
| Massachusetts | 133 | 1,045 | 140 | 1,104 | 0 | 0 | 11,698 | 92,227 | 273 | 1,197 | 1,009,141 | 57,123 | 409,000 |
| Michigan | 1,187 | 9,358 | 322 | 2,539 | 0 | 0 | 58,073 | 457,850 | 270 | 1,181 | 7,644,650 | 103,649 | 820,000 |
| Minnesota | 2,583 | 20,362 | 131 | 1,030 | 0 | 0 | 46,903 | 369,785 | 287 | 1,255 | 12,761,917 | 67,800 | 547,000 |
| Mississippi | 1,802 | 14,210 | 137 | 1,077 | 0 | 0 | 70,910 | 559,056 | 505 | 2,211 | 5,602,959 | 49,687 | 349,000 |
| Missouri | 1,501 | 11,838 | 272 | 2,148 | 0 | 0 | 105,967 | 835,445 | 1,643 | 7,198 | 6,928,126 | 86,085 | 565,000 |
| Montana | 625 | 4,925 | 19 | 147 | 831 | 6,548 | 208,943 | 1,647,304 | 3,321 | 14,547 | 14,160,936 | 13,423 | 118,000 |
| Nebraska | 2,064 | 16,272 | 95 | 751 | 0 | 0 | 117,706 | 927,996 | 717 | 3,142 | 18,091,391 | 29,849 | 247,000 |
| Nevada | 37 | 289 | 41 | 325 | 5,749 | 45,321 | 160,093 | 1,262,175 | 193 | 846 | 18,272,533 | 33,773 | 189,000 |
| New Hampshire | 121 | 954 | 49 | 390 | 0 | 0 | 13,231 | 104,314 | 397 | 1,741 | 191,036 | 10,890 | 87,000 |
| New Jersey | 154 | 1,212 | 293 | 2,311 | 0 | 0 | 4,469 | 35,230 | 125 | 549 | 969,276 | 79,179 | 717,000 |
| New Mexico | 76 | 595 | 45 | 354 | 1,641 | 12,933 | 179,855 | 1,417,978 | 311 | 1,363 | 36,041,142 | 22,428 | 199,000 |
| New York | 705 | 5,558 | 374 | 2,950 | 0 | 0 | 47,615 | 375,401 | 1,532 | 6,711 | 2,642,615 | 144,624 | 1,093,000 |
| North Carolina | 1,632 | 12,870 | 479 | 3,780 | 0 | 0 | 53,366 | 420,741 | 693 | 3,037 | 6,041,648 | 136,415 | 793,000 |
| North Dakota | 1,038 | 8,186 | 4 | 30 | 0 | 0 | 104,037 | 820,226 | 79 | 347 | 13,143,900 | 12,956 | 141,000 |
| Ohio | 1,396 | 11,009 | 427 | 3,363 | 0 | 0 | 62,902 | 495,922 | 695 | 3,046 | 4,555,786 | 154,145 | 1,124,000 |
| Oklahoma | 524 | 4,128 | 122 | 965 | 0 | 0 | 98,892 | 779,667 | 689 | 3,016 | 16,781,869 | 57,846 | 455,000 |
| Oregon | 1,750 | 13,793 | 113 | 891 | 2,308 | 18,200 | 115,944 | 914,105 | 4,152 | 18,184 | 8,583,374 | 46,026 | 286,000 |
| Pennsylvania | 801 | 6,314 | 905 | 7,132 | 0 | 0 | 41,520 | 327,341 | 1,911 | 8,368 | 1,012,689 | 148,964 | 1,102,000 |
| Rhode Island | 18 | 143 | 60 | 474 | 0 | 0 | 1,458 | 11,492 | 14 | 59 | 118,549 | 7,799 | 58,000 |
| South Carolina | 886 | 6,985 | 181 | 1,430 | 0 | 0 | 46,183 | 364,105 | 431 | 1,889 | 3,720,276 | 82,479 | 487,000 |
| South Dakota | 1,063 | 8,380 | 30 | 235 | 0 | 0 | 116,942 | 921,973 | 239 | 1,047 | 15,478,682 | 11,356 | 111,000 |
| Tennessee | 773 | 6,095 | 252 | 1,984 | 0 | 0 | 54,335 | 428,380 | 1,312 | 5,745 | 2,738,888 | 103,522 | 660,000 |
| Texas | 2,039 | 16,078 | 748 | 5,898 | 0 | 0 | 384,355 | 3,030,251 | 686 | 3,006 | 71,862,428 | 358,458 | 3,449,000 |
| Utah | 55 | 434 | 54 | 428 | 1,647 | 12,982 | 119,150 | 939,381 | 806 | 3,528 | 11,278,736 | 28,044 | 224,000 |
| Vermont | 62 | 492 | 26 | 203 | 0 | 0 | 4,518 | 35,617 | 390 | 1,710 | 103,293 | 5,595 | 43,000 |
| Virginia | 998 | 7,866 | 317 | 2,498 | 0 | 0 | 36,877 | 290,737 | 835 | 3,657 | 2,602,587 | 113,806 | 733,000 |
| Washington | 1,562 | 12,312 | 192 | 1,514 | 323 | 2,547 | 71,413 | 563,024 | 6,221 | 27,249 | 3,089,074 | 90,380 | 597,000 |
| DC | 8 | 62 | 1 | 5 | 0 | 0 | 89 | 698 | 0.19 | 1 | 3,264 | 11,877 | 54,000 |
| West Virginia | 305 | 2,407 | 36 | 281 | 0 | 0 | 33,153 | 261,376 | 1,006 | 4,408 | 333,362 | 32,032 | 217,000 |
| Wisconsin | 1,423 | 11,222 | 263 | 2,073 | 0 | 0 | 82,087 | 647,173 | 1,455 | 2,287 | 6,346,913 | 68,752 | 528,000 |
| Wyoming | 64 | 503 | 6 | 50 | 174 | 1,373 | 135,728 | 1,070,079 | 1,289 | 4,445 | 13,872,721 | 17,113 | 157,000 |
| TOTAL | 50,707 | 399,774 | 11,232 | 88,551 | 38,227 | 301,382 | 3,975,735 | 31,344,696 | 60,329 | 258,953 | 481,963,052 | 3,754,493 | 28,636,000 |
Note: Total use is inflated to create an oil equivalence.
See also
- American Council on Renewable Energy
- Americas Energy and Climate Symposium
- Energy conservation in the United States
- Efficient energy use
- Energy policy of the United States
- Solar power in the United States
- Lists about renewable energy
- List of solar thermal power stations
- List of wind farms in the United States
- List of U.S. states by electricity production from renewable sources
- List of renewable energy topics by country
- Renewable energy commercialization
References
- ↑ US Energy Information Administration, Electric Power Monthly, January 2013.
- ↑ US Energy Information Administration,Energy monthly, accessed 6 Nov. 2013.
- ↑ Editorial Board (26 April 2014). "The Koch Attack on Solar Energy". New York Times.
- ↑ Ron Pernick and Clint Wilder (2012). "Clean Tech Nation" (PDF). p. 5.
- ↑ US Energy Information Administration, Total Energy.
- ↑ 6.0 6.1 6.2 6.3 6.4 "Direct Federal Financial Interventions and Subsidies in Energy in Fiscal Year 2010". Energy Information Administration. Retrieved 29 April 2012.
- ↑ US Energy Information Administration, , September 2013.
- ↑ 8.0 8.1 "AWEA 4th quarter 2012 Public Market Report" (PDF). American Wind Energy Association (AWEA). January 2013. Retrieved January 30, 2013.
- ↑ American Wind Energy Association, Annual U.S. wind power rankings track industry's rapid growth
- ↑ 10.0 10.1 10.2 SEGS I, II, III, IV, V, VI, VII, VIII & IX
- ↑ 11.0 11.1 "DOE Closes on Four Major Solar Projects". Renewable Energy World. 30 September 2011.
- ↑ 12.0 12.1 Steve Leone (7 December 2011). "Billionaire Buffett Bets on Solar Energy". Renewable Energy World.
- ↑ President Obama Touts Clean Energy on Earth Day
- ↑ 14.0 14.1 Remarks of President Barack Obama -- Address to Joint Session of Congress
- ↑ 15.0 15.1 Lindsay Morris (25 January 2012). "Obama: Sticking to "Promise of Clean Energy"". Renewable Energy World.
- ↑ American Council On Renewable Energy, (2007). The Outlook on Renewable Energy in America Volume II: Joint Summary Report page 7
- ↑ 17.0 17.1 President Obama Calls for Greater Use of Renewable Energy
- ↑ Ron Pernick (2012). "Clean Energy Trends 2012" (PDF). Clean Edge. p. 6.
- ↑ Americans Willing To Pay More for Solar Renewable Energy World, 25 June 2010.
- ↑ "Large Majorities in US and Europe Endorse Focus on Renewable Energy". World Public Opinion. January 18, 2012.
- ↑ Synapse Energy Economics (November 16, 2011). "Toward a Sustainable Future for the U.S. Power Sector: Beyond Business as Usual 2011" (PDF).
- ↑ 22.0 22.1 US Energy Information Administration, Electric Power Monthly
- ↑ "Renewables Portfolio Standard Quarterly Report 1st and 2nd Quarter 2012" (PDF). California Public Utilities Commission. Retrieved 26 March 2013.
- ↑ 24.0 24.1 24.2 Renewables Becoming Cost-Competitive With Fossil Fuels in the U.S.
- ↑ John Broder (October 10, 2011). "The Year of Peril and Promise in Energy Production". New York Times.
- ↑ U.S. Rejected Solyndra Restructuring Bid Before Shutdown, Committee Finds
- ↑ Renewable Energy Capacity and Generation
- ↑ Annual Energy Outlook 2012
- ↑ Table 1.1 retrieved 2014-1-17
- ↑ Electric Power Annual Planned Generating Capability Changes, by Energy Source, 2013-2017 retrieved 2014-1-27
- ↑ Detailed State Data retrieved 2014-1-15
- ↑ "Generation Records Fall at Grand Coulee Dam". U.S. Bureau of Reclamation. Archived from the original on 2006-10-07. Retrieved 2006-11-18.
- ↑ 33.0 33.1 33.2 33.3 33.4 33.5 33.6 retrieved 2014-3-26
- ↑ 34.0 34.1 34.2 American Wind Energy Association (2009). Annual Wind Industry Report, Year Ending 2008 pp. 9–10.
- ↑ Shepherds Flat to be largest wind farm
- ↑ 36.0 36.1 "Strengthening America’s Energy Security with Offshore Wind" (PDF). U.S. Department of Energy. April 2012.
- ↑ "AWEA 1st Quarter 2012 Public Market Report" (PDF). American Wind Energy Association (AWEA). May 2012. Retrieved 2012-07-30.
- ↑ Industry Statistics
- ↑ Big Power Line Project Proposed To Transport Iowa Wind Energy
- ↑ "24 governors ask President to focus on wind energy deployment". Renewable Energy World. 25 August 2011.
- ↑ Terra-Gen Press Release, 17 April 2012
- ↑ 42.0 42.1 42.2 42.3 Drilling Down: What Projects Made 2008 Such a Banner Year for Wind Power?
- ↑ 43.0 43.1 43.2 AWEA: U.S. Wind Energy Projects – Texas
- ↑ 44.0 44.1 AWEA: U.S. Wind Energy Projects – Indiana
- ↑ E.ON Delivers 335-MW of Wind in Texas
- ↑ Solar Energy Development PEIS Information Center
- ↑ Nevada: Solar energy advances discussed
- ↑ Spain pioneers grid-connected solar-tower thermal power
- ↑ Steven Mufson. Solar power project in Mojave Desert gets $1.4 billion boost from stimulus funds Washington Post, February 23, 2010.
- ↑ Michael R. Blood and Brian Skolof, "Huge thermal plant opens as solar industry grows", Associated Press, February 13, 2014.
- ↑ "DOE Finalizes $737 Million Loan Guarantee to Tonopah Solar Energy for Nevada Project" (Press release). Loan Programs Office (LPO), Dept. of Energy (DOE). September 28, 2011. Retrieved 29 September 2011.
- ↑ Solel (2007).Ten facts about solar thermal power Retrieved December 18, 2008.
- ↑ A Mojave power failure A shortfall in Mojave protection bill, Los Angeles Times, editorial, December 26, 2009.
- ↑ "Global Market Outlook for Photovoltaics 2013 - 2017". European Photovoltaic Industry Association. Retrieved 2014-03-19.
- ↑ 55.0 55.1 America's Largest PV Power Plant Is Now Live (December 6, 2010), Renewable Energy World.
- ↑ "Long Island Solar Farm Opens in Upton". Long Island Press. November 21, 2011.
- ↑ FPL Commissions DeSoto Next Generation Solar Energy Center
- ↑ Nellis activates Nations largest PV Array
- ↑ Largest U.S. Solar Photovoltaic System Begins Construction at Nellis Air Force Base
- ↑ "NRG Energy Completes Acquisition of 250-Megawatt California Valley Solar Ranch from SunPower". MarketWatch. 30 September 2011.
- ↑ Million Solar Roofs Initiative
- ↑ Washington State Passes Progressive Renewable Energy Legislation
- ↑ 63.0 63.1 63.2 Geothermal Energy Association, 6 Million American Households to be Powered by Geothermal Energy, New Survey Reports
- ↑ "2012 Annual US Geothermal Power Production and Development Report" (PDF). Geothermal Energy Association. February 2013.
- ↑ 65.0 65.1 65.2 Environmental and Energy Study Institute, Solar water heating
- ↑ US Energy Information Administration, Table 1.1.A. Net Generation by Other Renewable Sources: Total (All Sectors), 2003-April 2013, Table 1.1. Net Generation by Energy Source: Total (All Sectors), 2003-April 2013, accessed 20 July 2013.
- ↑ 67.0 67.1 67.2 Worldwatch Institute and Center for American Progress (2006). American energy: The renewable path to energy security
- ↑ "The craze for maize", The Economist, May 12, 2007, pp.33-34
- ↑ S.C.E. Jupe, A. Michiorri, P.C. Taylor (2007). "Increasing the energy yield of generation from new and renewable energy sources". Renewable energy 14 (2): 37–62.
- ↑ "Defense-scale supercomputing comes to renewable energy research". Sandia National Laboratories. Retrieved 2012-04-016. Check date values in:
|accessdate=(help) - ↑ "Sandia National Laboratories" (PDF). Sandia National Laboratories. Retrieved 2012-04-016. Check date values in:
|accessdate=(help) - ↑
- Chakrabarty, Gargi, April 16th, 2009. "Stimulus leaves NREL in cold" Denver Post"
- ↑ Chumley, Cheryl. "BP Gives Up on Solar Power". Heartlander Magazine. Heartlander Magazine. Retrieved 28 November 2012.
- ↑ "Stimulus leaves NREL in cold". Denver Post. Retrieved 2012-04-16.
- ↑ "Solar Research". NREL. Retrieved 2012-04-16.
- ↑ "Photovoltaics". Sandia. Retrieved 2012-04-16.
- ↑ "'Major discovery' from MIT primed to unleash solar revolution". MIT News. Retrieved 2012-04-17.
- ↑ "Breakthrough: World’s most efficient solar panel". SmartPlanet. Retrieved 2012-04-17.
- ↑ "Wind energy research reaps rewards". NASA. Retrieved 2012-04-17.
- ↑ "Wind energy". Sandia. Retrieved 2012-04-17.
- ↑ "Wind research". NREL. Retrieved 2012-04-17.
- ↑ "Wind resource evaluation at the Caltech Field Laboratory for Optimized Wind Energy (FLOWE)" (PDF). Caltech. Retrieved 2012-04-17.
- ↑ American Coalition for Ethanol (2008-06-02). "Responses to Questions from Senator Bingaman" (PDF). American Coalition for Ethanol. Retrieved 2012-04-02.
- ↑ National Renewable Energy Laboratory (2007-03-02). "Research Advantages: Cellulosic Ethanol" (PDF). National Renewable Energy Laboratory. Retrieved 2012-04-02.
- ↑ M.R. Schmer, K.P. Vogel, R.B. Mitchell, R.K. Perrin (2008). "Net energy of cellulosic ethanol from switchgrass". Proceedings of the National Academy of Sciences of the United States of America 105 (2): 464–469. doi:10.1073/pnas.0704767105. PMID 18180449.
- ↑ Charles E. Wyman (2007). "What is (and is not) vital to advancing cellulosic ethanol". Trends in Biotechnology 25 (4): 153–157. doi:10.1016/j.tibtech.2007.02.009. PMID 17320227.
- ↑ Sandia National Laboratories. "Biomass". Sandia National Laboratories. Retrieved 2012-04-17.
- ↑ Joint BioEnergy Initiative. "About JBEI". Sandia National Laboratories. Retrieved 2012-04-17.
- ↑ Jeff Wise. "The Truth about hydrogen". Popular Mechanics. Retrieved 2012-04-17.
- ↑ NREL. "Hydrogen". NREL. Retrieved 2012-04-17.
- ↑ Sandia. "Hydrogen". Sandia. Retrieved 2012-04-17.
- ↑ EERE: Solar Energy Technologies Program Home Page
- ↑ 93.0 93.1 California Public Utilities Commission, The California Solar Initiative
- ↑ Database of State Incentives for Renewables and Efficiency, Financial Incentives in the USA
- ↑ U.S. Environmental Protection Agency, Onsite Renewable Technologies
- ↑ Los Angeles County Sanitation District
- ↑ "Net Metering". Archived from the original on 9 May 2009.
- ↑ American Council on Renewable Energy, Member Benefits
- ↑ American Council On Renewable Energy, (2007). The Outlook On Renewable Energy In America
- ↑ 635 GW Possible with U.S. Political Shift Renewable Energy Access, 2 May 2007.
- ↑ retrieved 2014-3-29
- ↑ Detailed State Data retrieved 2014-1-15
- ↑ U.S. Renewable Energy Technical Potentials
- ↑ NREL Study Shows Renewable Energy Potential in Every State
- ↑ 2010 Electricity Consumption
- ↑ Total Energy Consumption 2010
Further reading
- Clean Tech Nation: How the U.S. Can Lead in the New Global Economy (2012) by Ron Pernick and Clint Wilder
- Deploying Renewables 2011 (2011) by the International Energy Agency
- Reinventing Fire: Bold Business Solutions for the New Energy Era (2011) by Amory Lovins
- Renewable Energy Sources and Climate Change Mitigation (2011) by the IPCC
- Solar Energy Perspectives (2011) by the International Energy Agency
External links
| |||||||||||||||||||||
| ||||||||||
| ||||||||||||||||||||||||||||||