Regions of Italy
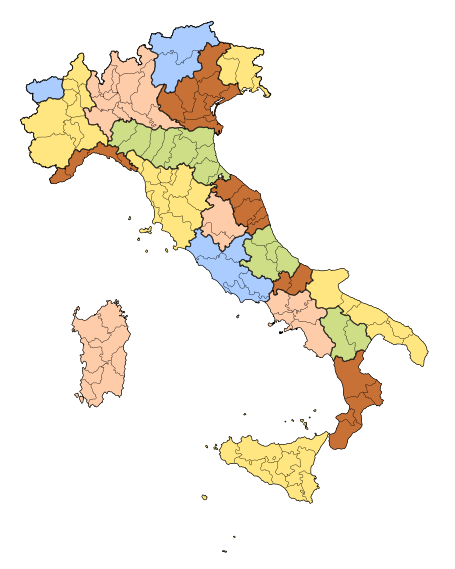
The regions of Italy are the first-level administrative divisions of the country, constituting its second NUTS administrative level.[1] There are 20 regions, of which five are constitutionally given a broader amount of autonomy granted by special statutes.
Each region, except for the Aosta Valley, is divided into provinces. Regions are autonomous entities with powers defined in the Constitution.
History
Administrative districts of the central state during the Kingdom of Italy, regions were granted a measure of political autonomy by the 1948 Constitution of the Italian Republic. The original draft list comprised the Salento region (which was eventually included in the Apulia). Friuli and Venezia Giulia were separate regions, and Basilicata was named Lucania. Abruzzo and Molise were identified as separate regions in the first draft. They were later merged into Abruzzo e Molise in the final constitution of 1948. They were separated in 1963.
Implementation of regional autonomy was postponed until the first Regional Elections of 1970. The ruling Christian Democracy party did not want the opposition Italian Communist Party to gain power in the regions, where it was historically rooted (the red belt of Emilia-Romagna, Tuscany, Umbria and Marche).
Regions acquired a significant level of autonomy following a constitutional reform in 2001 (brought about by a centre-left government and confirmed by popular referendum), which granted them residual policy competence. A further federalist reform was proposed by the regionalist party Lega Nord and in 2005, the centre-right government led by Silvio Berlusconi proposed a new reform that would have greatly increased the power of regions.[2]
In June 2006 the proposals, which had been particularly associated with Lega Nord, and seen by some as leading the way to a federal state, were rejected in a referendum by 61.7% to 38.3%.[2] The results varied considerably among the regions, ranging to 55.3% in favour in Veneto to 82% against in Calabria.[2]
Regions and macroregions
| Flag | Region Italian name |
Capital city | Area (km2) | Population[3] June 2014 |
Pop. density | Comuni | Metropolitan cities | Status | Macroregion | Governor or President |
|---|---|---|---|---|---|---|---|---|---|---|
| Abruzzo Abruzzo |
L'Aquila | 10,763 | 1,332,396 | 124 | 305 | - | Ordinary | South | Luciano D'Alfonso Democratic Party | |
| Aosta Valley Valle d'Aosta |
Aosta | 3,263 | 128,358 | 39 | 74 | - | Autonomous | North-West | Augusto Rollandin Union Valdôtaine | |
| Apulia Puglia |
Bari | 19,358 | 4,085,252 | 211 | 258 | Bari | Ordinary | South | Nichi Vendola Left Ecology Freedom | |
| Basilicata Basilicata |
Potenza | 9,995 | 576,834 | 58 | 131 | - | Ordinary | South | Marcello Pittella Democratic Party | |
| Calabria Calabria |
Catanzaro | 15,081 | 1,978,133 | 131 | 409 | Reggio Calabria | Ordinary | South | Gerardo Mario Oliverio Democratic Party | |
| Campania Campania |
Naples | 13,590 | 5,868,561 | 432 | 551 | Naples, Salerno | Ordinary | South | Stefano Caldoro Forza Italia | |
| Emilia-Romagna Emilia-Romagna |
Bologna | 22,446 | 4,448,488 | 198 | 348 | Bologna | Ordinary | North-East | Stefano Bonaccini Democratic Party | |
| Friuli-Venezia Giulia Friuli-Venezia Giulia |
Trieste | 7,858 | 1,228,492 | 156 | 218 | Trieste | Autonomous | North-East | Debora Serracchiani Democratic Party | |
| Lazio Lazio |
Rome | 17,236 | 5,879,959 | 340 | 378 | Rome | Ordinary | Centre | Nicola Zingaretti Democratic Party | |
| Liguria Liguria |
Genoa | 5,422 | 1,587,213 | 293 | 235 | Genoa | Ordinary | North-West | Claudio Burlando Democratic Party | |
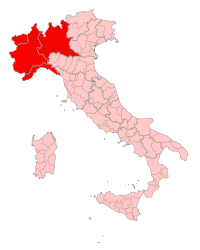
| Lombardy Lombardia |
Milan | 23,861 | 9,984,589 | 418 | 1544 | Bergamo, Brescia, Milan | Ordinary | North-West | Roberto Maroni Lega Nord | |
| Marche Marche |
Ancona | 9,366 | 1,550,486 | 166 | 239 | - | Ordinary | Centre | Gian Mario Spacca Democratic Party | |
| Molise Molise |
Campobasso | 4,438 | 313,567 | 71 | 136 | - | Ordinary | South | Paolo Di Laura Frattura Democratic Party | |
| Piedmont Piemonte |
Turin | 25,402 | 4,430,983 | 175 | 1206 | Turin | Ordinary | North-West | Sergio Chiamparino Democratic Party | |
| Sardinia Sardegna |
Cagliari | 24,090 | 1,661,189 | 70 | 377 | Cagliari | Autonomous | Islands | Francesco Pigliaru Democratic Party | |
| Sicily Sicilia |
Palermo | 25,711 | 5,088,793 | 198 | 390 | Catania, Messina, Palermo | Autonomous | Islands | Rosario Crocetta Democratic Party | |
| Trentino-South Tyrol Trentino-Alto Adige |
Trento | 13,607 | 1,053,598 | 77 | 333 | - | Autonomous | North-East | Ugo Rossi PATT | |
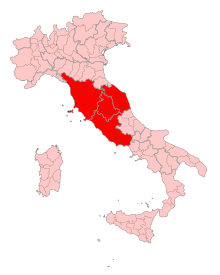
| Tuscany Toscana |
Florence | 22,994 | 3,750,223 | 163 | 287 | Florence | Ordinary | Centre | Enrico Rossi Democratic Party | |
| Umbria Umbria |
Perugia | 8,456 | 895,658 | 106 | 92 | - | Ordinary | Centre | Catiuscia Marini Democratic Party | |
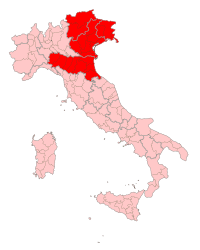
| Veneto Veneto |
Venice | 18,399 | 4,926,330 | 268 | 581 | Venice | Ordinary | North-East | Luca Zaia Lega Nord | |
| ITALY | 301,336 | 60,769,102 | 202 | 8,092 | ||||||
Macroregions are the first-level NUTS of the European Union:
- Centre: Lazio, Marche, Tuscany, Umbria
- North-East: Emilia Romagna, Friuli Venezia Giulia, Trentino-Alto Adige, Veneto
- North-West: Aosta Valley, Liguria, Lombardy, Piedmont
- Islands: Sardinia, Sicily
- South: Abruzzo, Apulia, Basilicata, Calabria, Campania, Molise
| Map | Macroregion Italian name |
Major city | Area (km2) | Population[3] June 2014 |
Pop. density | Comuni | No. of Metropolitan cities |
|---|---|---|---|---|---|---|---|
 |
North-West Nord-Ovest |
Milan | 57,931 | 16,131,143 | 278 | 3,059 | 5 |
 |
North-East Nord-Est |
Bologna | 62,310 | 11,656,908 | 187 | 1,480 | 3 |
 |
Centre Centro |
Rome | 58,051 | 12,076,326 | 208 | 996 | 2 |
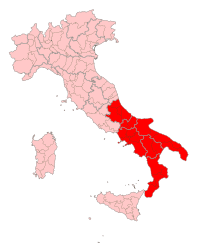 |
South Sud |
Naples | 73,224 | 14,154,743 | 193 | 1,790 | 4 |
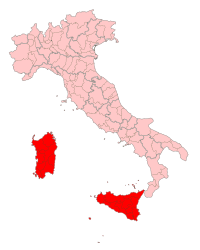 |
Islands Isole or Insulare |
Palermo | 49,801 | 6,749,982 | 135 | 767 | 4 |
Status
Every region has a statute that serves as a regional constitution, determining the form of government and the fundamental principles of the organization and the functioning of the region, as prescribed by the Constitution of Italy (Article 123). Although all the regions except Toscana define themselves in various ways as an "autonomous Region" in the first article of their Statutes,[4] fifteen regions have ordinary statutes and five have special statutes, granting them extended autonomy.
Regions with ordinary statute
These regions, whose statutes are approved by their regional councils, were created in 1970, even though the Italian Constitution dates back to 1948. Since the constitutional reform of 2001 they have had residual legislative powers. The regions have exclusive legislative power with respect to any matters not expressly reserved to state law (Article 117).[5] Yet their financial autonomy is quite modest: they just keep 20% of all levied taxes, mostly used to finance the region-based healthcare system.[6]
Autonomous regions with special statute
Article 116 of the Italian Constitution grants to five regions (namely Sardinia, Sicily, Trentino-Alto Adige/Südtirol, Aosta Valley and Friuli-Venezia Giulia) home rule, acknowledging their powers in relation to legislation, administration and finance. In return they have to finance the health-care system, the school system and most public infrastructures by themselves.
These regions became autonomous in order to take into account cultural differences and protect linguistic minorities. Moreover the government wanted to prevent their secession from Italy after the Second World War.[7]
Trentino-Alto Adige/Südtirol constitutes a special case. The region is nearly powerless, and the powers granted by the region's statute are mostly exercised by the two autonomous provinces within the region, Trentino and South Tyrol. In this case, the regional institution plays a coordinating role.
Institutions
Each region has an elected parliament, called Consiglio Regionale (regional council), or Assemblea Regionale (regional assembly) in Sicily, and a government called Giunta Regionale (regional junta), headed by the regional president. The latter is directly elected by the citizens of each region, with the exceptions of Aosta Valley and Trentino-Alto Adige/Südtirol, where he is chosen by the regional council.
Under the 1995 electoral law, the winning coalition receives an absolute majority of seats on the council. The president chairs the giunta, and nominates or dismisses its members, called assessori. If the directly elected president resigns, new elections are called immediately.
In Trentino-Alto Adige/Südtirol, the regional council is made up of the joint session of the two provincial councils of Trentino and of South Tyrol, and the regional president is one of the two provincial presidents.
Economy of regions and macroregions
| Flag | Name | GDP 2011 million, EUR[8] | GDP 2011 per capita 2011, EUR[8] | GDP 2011 million PPS, EUR[8] | GDP 2011 per capita 2011 PPS, EUR[8] |
|---|---|---|---|---|---|
| Abruzzo | 30,073 | 22,400 | 29,438 | 21,900 | |
| Aosta Valley | 4,328 | 33,700 | 4,236 | 33,000 | |
| Apulia | 69,974 | 17,100 | 68,496 | 16,700 | |
| Basilicata | 10,744 | 18,300 | 10,517 | 17,900 | |
| Calabria | 33,055 | 16,400 | 32,357 | 16,100 | |
| Campania | 93,635 | 16,000 | 91,658 | 15,700 | |
| Emilia-Romagna | 142,609 | 32,100 | 139,597 | 31,400 | |
| Friuli-Venezia Giulia | 36,628 | 29,600 | 35,855 | 29,000 | |
| Lazio | 172,246 | 29,900 | 168,609 | 29,300 | |
| Liguria | 43,998 | 27,200 | 43,069 | 26,700 | |
| Lombardy | 337,161 | 33,900 | 330,042 | 33,200 | |
| Marche | 40,877 | 26,100 | 40,014 | 25,500 | |
| Molise | 6,414 | 20,100 | 6,278 | 19,700 | |
| Piedmont | 125,997 | 28,200 | 123,336 | 27,600 | |
| Sardinia | 33,075 | 19,700 | 32,377 | 19,300 | |
| Sicily | 83,956 | 16,600 | 82,183 | 16,300 | |
| Trentino-Alto Adige | 35,797 | 34,450 | 35,041 | 33,700 | |
| Tuscany | 106,013 | 28,200 | 103,775 | 27,600 | |
| Umbria | 21,533 | 23,700 | 21,078 | 23,200 | |
| Veneto | 149,527 | 30,200 | 146,369 | 29,600 | |
| Code | Name | GDP 2011 million, EUR[8] | GDP 2011 per capita 2011, EUR[8] | GDP 2011 million PPS, EUR[8] | GDP 2011 per capita 2011 PPS, EUR[8] |
|---|---|---|---|---|---|
| ITE | Centre | 340,669 | 28,400 | 333,475 | 27,800 |
| ITD | North-East | 364,560 | 31,200 | 356,862 | 30,600 |
| ITC | North-West | 511,484 | 31,700 | 500,683 | 31,000 |
| ITG | Islands | 117,031 | 17,400 | 114,560 | 17,000 |
| ITF | South | 243,895 | 17,200 | 238,744 | 16,800 |
| - | Extra-regio | 2,771 | - | 2,712 | - |
The extra-regio territory is made up of parts of the economic territory of a country which cannot be assigned to a single region. It consists of the national air-space, territorial waters and the continental shelf lying in international waters over which the country enjoys exclusive rights, territorial exclaves, deposits of oil, natural gas etc. worked by resident units. (Until 2011, the gross value added (GVA) produced in the extra-regio was allocated pro-rata to the inhabited regions of the country concerned. The order of magnitude of the extra-regio GVA depends in particular on the resource endowment in terms of natural gas and oil. For EU Member States the share of extra-regio GVA varies typically from almost zero to about 2.5% of total GVA at national level. In 2011, Member States and the European Commission agreed to give countries the possibility to calculate regional GDP also for the extra-regio. The resulting GDP is available only in absolute values, because the extra-regio territory by definition does not have a resident population. Member States are entitled, but not obliged to calculate GDP for the extra-regio. In the table extra regio GDP appears only for those Member States which decided to make use of this possibility.)
See also
- Italian NUTS level 1 regions
- Regional Council (Italy)
- Presidents of Regions of Italy
- Flags of regions of Italy
- ISO 3166-2:IT
Other administrative divisions
- Provinces of Italy
- Municipalities of Italy
References
- ↑ "National structures". Eurostat. Retrieved 6 December 2011.
- ↑ 2.0 2.1 2.2 "Speciale Referendum 2006". la Repubblica. 26 June 2006. Retrieved 6 December 2011.
- ↑ 3.0 3.1 "Population June 2014". ISTAT. Retrieved 24 November 2014.
- ↑ Statuti Regionali - Edizioni Simone
- ↑ The Constitution of the Italian Republic
- ↑ Report RAI - Le regioni a statuto speciale (Italian), retrieved 21st Jan 2009 ,
- ↑ Hiroko Kudo, “Autonomy and Managerial Innovation in Italian Regions after Constitutional Reform”, Chuo University, Faculty of Law and Graduate School of Public Policy (2008): p. 1. Retrieved on April 6, 2012 from http://www.med-eu.org/proceedings/MED1/Kudo.pdf.
- ↑ 8.0 8.1 8.2 8.3 8.4 8.5 8.6 8.7 GDP per capita in the EU in 2011
External links
| Wikimedia Commons has media related to Regions of Italy. |
Italian
| ||||||||||||||
| ||||||||||||||||||||||||||||||||||||||||||||