Recurrence period density entropy
Recurrence period density entropy (RPDE) is a method, in the fields of dynamical systems, stochastic processes, and time series analysis, for determining the periodicity, or repetitiveness of a signal.
Overview
Recurrence period density entropy is useful for characterising the extent to which a time series repeats the same sequence, and is therefore similar to linear autocorrelation and time delayed mutual information, except that it measures repetitiveness in the phase space of the system, and is thus a more reliable measure based upon the dynamics of the underlying system that generated the signal. It has the advantage that it does not require the assumptions of linearity, Gaussianity or dynamical determinism. It has been successfully used to detect abnormalities in biomedical contexts such as speech signal.[1][2]
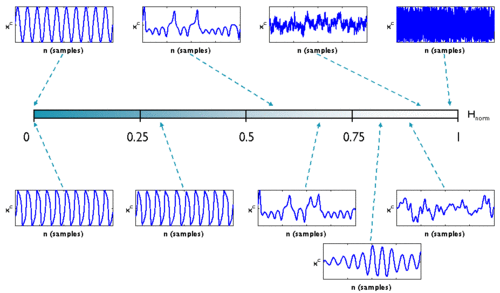
The RPDE value  is a scalar in the range zero to one. For purely periodic signals,
  , whereas for purely i.i.d., uniform white noise,
  .[2]
.[2]

Method description
The RPDE method first requires the embedding of a time series in phase space, which, according to stochastic extensions to Taken's embedding theorems, can be carried out by forming time-delayed vectors:
for each value xn in the time series, where M is the embedding dimension, and τ is the embedding delay. These parameters are obtained by systematic search for the optimal set (due to lack of practical embedding parameter techniques for stochastic systems) (Stark et al. 2003). Next, around each point  in the phase space, an
  -neighbourhood (an m-dimensional ball with this radius) is formed, and every time the time series returns to this ball, after having left it, the time difference T between successive returns is recorded in a histogram. This histogram is normalised to sum to unity, to form an estimate of the recurrence period density function P(T). The normalised entropy of this density:
is the RPDE value, where  is the largest recurrence value (typically on the order of 1000 samples).[2] Note that RPDE is intended to be applied to both deterministic and stochastic signals, therefore, strictly speaking, Taken's original embedding theorem does not apply, and needs some modification.[3]

 is created. All recurrences into this neighbourhood are tracked, and the time interval T between recurrences is recorded in a histogram. This histogram is normalised to create an estimate of the recurrence period density function P(T). The normalised entropy of this density is the RPDE value
  .
.RPDE in practice
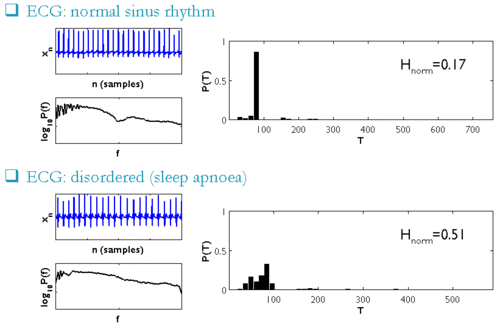
RPDE has the ability to detect subtle changes in natural biological time series such as the breakdown of regular periodic oscillation in abnormal cardiac function which are hard to detect using classical signal processing tools such as the Fourier transform or linear prediction. The recurrence period density is a sparse representation for nonlinear, non-Gaussian and nondeterministic signals, whereas the Fourier transform is only sparse for purely periodic signals.

 for normal sinus rhythm ECG, and for ECG from a patient with sleep apnoea. The time series (plots with blue traces) and spectra (plots with black traces) are relatively difficult to distinguish, nonetheless, the RPDE values are sufficiently different that detection of the abnormality is straightforward.
See also
- Recurrence plot, a powerful visualisation tool of recurrences in dynamical (and other) systems.[4]
- Recurrence quantification analysis, another approach to quantify recurrence properties.
References
- ↑ M. Little, P. McSharry, I. Moroz, S. Roberts (2006) Nonlinear, Biophysically-Informed Speech Pathology Detection in 2006 IEEE International Conference on Acoustics, Speech and Signal Processing, 2006. ICASSP 2006 Proceedings.: Toulouse, France. pp. II-1080-II-1083.
- ↑ 2.0 2.1 2.2 M.A. Little, P.E. McSharry, S.J. Roberts, D.A.E. Costello, I.M. Moroz (2007) Exploiting Nonlinear Recurrence and Fractal Scaling Properties for Voice Disorder Detection, BioMedical Engineering OnLine, 6:23
- ↑ J. Stark, D. S. Broomhead, M. E. Davies and J. Huke (2003) Delay Embeddings for Forced Systems. II. Stochastic Forcing. Journal of Nonlinear Science, 13(6):519-577
- ↑ N. Marwan, M. C. Romano, M. Thiel, J. Kurths (2007). "Recurrence Plots for the Analysis of Complex Systems". Physics Reports 438 (5–6): 237. Bibcode:2007PhR...438..237M. doi:10.1016/j.physrep.2006.11.001.
![\mathbf{X}_n=[x_n, x_{n+\tau}, x_{n+2\tau}, \ldots, x_{n+(M-1)\tau}]](../I/m/55ce9fafa6682bf3ac62b89bd00b36f8.png)
