Rating curve
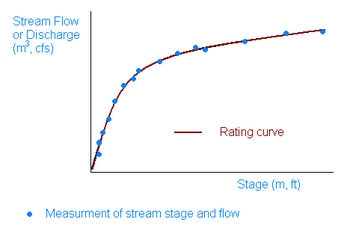
In hydrology, a Rating curve is a graph of discharge versus stage for a given point on a stream, usually at gaging stations, where the stream discharge is measured across the stream channel with a flow meter.[1] Numerous measurements of stream discharge are made over a range of stream stages. The rating curve is usually plotted as discharge on x-axis versus stage (surface elevation) on y-axis.[2] (Note that the figure shown has the axes with labels interchanged - incorrectly).
The development of a rating curve involves two steps. In the first step the relationship between stage and discharge is established by measuring the stage and corresponding discharge in the river. And in the second part, stage of river is measured and discharge is calculated by using the relationship established in the first part. Stage is measured by reading a gage installed in the river. If the stage-discharge relationship doesn’t change with time, it is called permanent control. If the relationship does change, it is called shifting control. Shifting control is usually due to erosion or deposition of sediment at the stage measurement site. Bedrock-bottomed parts of rivers or concrete/metal weirs or structures are often, though not always, permanent controls.
If G represents stage for discharge Q, then the relationship between G and Q can possibly be approximated with the equation:
Q=Cr(G-a)β
where Cr and β are rating curve constants, and a is a constant which represents the gage reading corresponding to zero discharge. The constant a is a hypothetical parameter and cannot be measured in the field. It is estimated by following standard methods given in literature.
References
- ↑ R.W.Herschy (Ed.) (1999). Hydrometry—Principles and Practices. John Wiley & Sons, Chichester. pp. VI+376. ISBN 0-471-97350-5.
- ↑ Kennedy, E.J. (1984). Discharge ratings at gaging stations: U.S. Geological Survey Techniques of Water-Resources Investigations, Book 3. US Government Printing Office. p. 5.