Race and ethnicity in the United States
| Part of a series on the |
| Culture of the United States |
|---|
 |
| History |
| People |
| Languages |
|
Mythology and folklore
|
| Cuisine |
| Festivals |
| Religion |
|
Literature |
|
Music and performing arts |
|
Media |
| Sport |
|
Monuments |
|
The United States has a racially and ethnically diverse population.[1] The census officially recognizes six ethnic and racial categories: White American, Native American and Alaska Native, Asian American, Black or African American, Native Hawaiian and Other Pacific Islander, and people of two or more races; a race called "Some other race" is also used in the census and other surveys, but is not official.[2][3][4] The United States Census Bureau also classifies Americans as "Hispanic or Latino" and "Not Hispanic or Latino", which identifies Hispanic and Latino Americans as a racially diverse ethnicity that composes the largest minority group in the nation.[2][3][5]
White Americans are the racial majority, with a 77.7% share of the U.S. population. Hispanic and Latino Americans amount to 17.1% of the population, making up the largest minority. African Americans are the largest racial minority, amounting to 13.2% of the population. The White, non-Hispanic or Latino population make up 62.6% of the nation's total.[6]
White Americans are the majority in every region,[4] but contribute the highest proportion of the population in the Midwestern United States, at 85% per the PEP,[4] or 83% per the ACS.[7] Non-Hispanic Whites make up 79% of the Midwest's population, the highest ratio of any region.[5] However, 35% of White Americans (whether all White Americans or non-Hispanic/Latino only) live in the South, the most of any region.[4][5]
55% of the African American population live in the South.[4] A plurality or majority of the other official groups reside in the West. This region is home to 42% of Hispanic and Latino Americans, 46% of Asian Americans, 48% of American Indians and Alaska Natives, 68% of Native Hawaiians and Other Pacific Islanders, 37% of the "two or more races" population (Multiracial Americans), and 46% of those designated "some other race".[4][8]
Racial and ethnic categories
In the 2000 Census and subsequent United States Census Bureau surveys, Americans self-described as belonging to these racial groups:[3]
- White American, European American, or Middle Eastern American: those having origins in any of the original peoples of Europe, the Middle East, or North Africa.
- Black American or African American: those having origins in any of the original peoples of Sub-Saharan Africa.
- Native American or Alaska Native, also called Native Americans: those having origins in any of the original peoples of North, Central and South America, irrespective of whether they maintain tribal affiliation or community attachment.
- Asian American: those having origins in any of the original peoples of the Far East, Central Asia, North Asia, Southeast Asia, and the Indian subcontinent.
- Native Hawaiians or Other Pacific Islander: those having origins in any of the original peoples of Polynesia, Melanesia, or Micronesia.
- Some other race: respondents may write how they identify themselves, if different from the preceding categories (e.g. Roma or Aborigine). However, 95% of the people who report in this category are Hispanic Mestizos.[3][8][9] This is not a standard OMB race category.[3] Responses have included mixed-race terms such as Métis, Creole, and Mulatto, which are generally considered to be categories of multi-racial ancestry (see below),[10] but, write-in entries reported in the 2000 census also included nationalities (as opposed to ethnicities), such as South African, Belizean, or Puerto Rican, as well as other terms for mixed-race groups like Wesort, Melungeon, mixed, interracial, and others.
- Two or more races, widely known as Multiracial: those who check off and/or write in more than one race. There is no option labelled "Two or more races" or "Multiracial" on census and other forms; people who report more than one of the foregoing six options are classified as people of "Two or more races" in subsequent processing. Any respondent may identify with any number, up to all six, of the racial categories.
Each person has two identifying attributes, racial identity and whether or not they are of Hispanic ethnicity.[11] These categories are sociopolitical constructs and should not be interpreted as being scientific or anthropological in nature.[2] They have been changed from one census to another, and the racial categories include both "racial" and national-origin groups.[12][13]
In 2007 the Equal Employment Opportunity Commission of the US Department of Labor finalized its update of the EEO-1 report format and guidelines to come into an effect on September 30, 2007. In particular, this update concerns the definitions of racial/ethnic categories.
Ethnicity: Hispanic or Latino origin
The question on Hispanic or Latino origin is separate from the question on race.[3][14] Hispanic and Latino Americans have ethnic origins in the Latin-speaking countries of Andorra, Latin America, and Spain. Most of the Latin American countries are, like the United States, racially diverse.[15] Consequently, no separate racial category exists for Hispanic and Latino Americans, as they do not constitute a race, nor a national group. When responding to the race question on the census form, each person is asked to choose from among the same racial categories as all Americans, and are included in the numbers reported for those races.[16]
Each racial category may contain Non-Hispanic or Latino and Hispanic or Latino Americans. For example: the White (European-American) race category contains Non-Hispanic Whites and Hispanic Whites (see White Hispanic and Latino Americans); the Black or African-American category contains Non-Hispanic Blacks and Hispanic Blacks (see Black Hispanic and Latino Americans); the Asian-American category contains Non-Hispanic Asians and Hispanic Asians (see Asian Hispanic and Latino Americans); and likewise for all the other categories. See the section on Hispanic and Latino Americans in this article.
Self-identifying as both Hispanic or Latino and not Hispanic or Latino is neither explicitly allowed nor explicitly prohibited.[2]
Social definitions of race
In the United States since its early history, Native Americans, Africans and Europeans were considered to belong to different races. For nearly three centuries, the criteria for membership in these groups were similar, comprising a person’s appearance, his social circle (how he lived), and his known non-White ancestry. History played a part, as persons with known slave ancestors were assumed to be African (or, in later usage, black), regardless of whether they also had European ancestry.
The differences between how Native American and Black identities are defined today (blood quantum versus one-drop and political assumptions) have been based on different historical circumstances. According to the anthropologist Gerald Sider, such racial designations were a means to concentrate power, wealth, privilege and land in the hands of Whites in a society of White hegemony and privilege (Sider 1996; see also Fields 1990). The differences had little to do with biology and more to do with the history of slavery and its racism, and specific forms of White supremacy (the social, geopolitical and economic agendas of dominant Whites vis-à-vis subordinate Blacks and Native Americans). They related especially to the different social places which Blacks and Amerindians occupied in White-dominated 19th-century America. Sider suggests that the blood quantum definition of Native American identity enabled mixed-race Whites to acquire Amerindian lands during the allotment process. The one-drop rule of Black identity, enforced legally in the early 20th century, enabled Whites to preserve their agricultural labor force in the South. The contrast emerged because, as peoples transported far from their land and kinship ties on another continent, Black labor was relatively easy to control, and they became reduced to valuable commodities as agricultural laborers. In contrast, Amerindian labor was more difficult to control; moreover, Amerindians occupied large territories that became valuable as agricultural lands, especially with the invention of new technologies such as railroads. Sider thinks the blood quantum definition enhanced White acquisition of Amerindian lands in a doctrine of Manifest Destiny, which subjected Native Americans to marginalization and resulted in numerous conflicts related to American expansionism.
The political economy of race had different consequences for the descendants of aboriginal Americans and African slaves. The 19th-century blood quantum rule meant that it was relatively easier for a person of mixed Euro-Amerindian ancestry to be accepted as White. The offspring of a few generations of intermarriage between Amerindians and Whites likely would not have been considered Amerindian (at least not in a legal sense). Amerindians could have treaty rights to land, but because an individual with only one Amerindian great-grandparent no longer was classified as Amerindian, he lost a legal claim to Amerindian land, under the allotment rules of the day. According to Sider's theory, Whites were more easily able to acquire Amerindian lands. On the other hand, the same individual who could be denied legal standing in a tribe, according to the government, because he was "too White" to claim property rights, might still have enough visually identifiable Amerindian ancestry to be considered socially as a "half-breed" or breed, and stigmatized by both communities.
The 20th-century one-drop rule made it relatively difficult for anyone of known Black ancestry to be accepted as White. The child of an African-American sharecropper and a White person was considered Black by the local communities. In terms of the economics of sharecropping, such a person also would likely become a sharecropper as well, thus adding to the landholder or employer's labor force.
In short, this theory suggests that in a 20th-century economy that benefited from sharecropping, it was useful to have as many Blacks as possible.
Although some scholars of the Jim Crow period agree that the 20th-century notion of invisible Blackness shifted the color line in the direction of paleness, and "expanded" the labor force in response to Southern Blacks' Great Migration to the North. But, others (such as the historians Joel Williamson, C. Vann Woodward, George M. Fredrickson, and Stetson Kennedy) considered the one-drop rule a consequence of the need to define Whiteness as being pure, and justifying White-on-Black oppression.
Over the centuries when Whites wielded power over both Blacks and Amerindians and believed in their inherent superiority over people of color, they created a social order of hypodescent, in which they assigned mixed-race children to the lower-status groups. They were often ignorant of the systems among Native American tribes of social classification, including kinship and hypodescent. The Omaha people, for instance, who had a patrilineal kinship system, classified all children with white fathers as "white", and excluded them as members of the clans and tribe, unless one was formally adopted by a male member. Tribal members might care for mixed-race children of white fathers, but considered them outside the hereditary clan and kinship fundamental to tribal society.[17]
The hypodescent social construction related to the racial caste that was associated with African slavery and the conditions of the slave societies. It was made explicit by Virginia and other colonies' laws as early as 1662. Virginia incorporate the Roman principle of partus sequitur ventrem into slave law, saying that children of slave mothers were born into their status. Under English common law for subjects, children's social status was determined by the father, not the mother. But the colonists put Africans outside the category of English subjects. Generally, white men were in positions of power to take sexual advantage of black women slaves. But, historian Paul Heinegg has shown that most free African-American families listed in the censuses of 1790-1810 were, in fact, descended from unions between white women and African men in colonial Virginia, from the years when working classes lived and worked closely together, and before slavery had hardened as a racial caste.[18]
In the United States, social and legal conventions developed over time by whites that classified individuals of mixed ancestry into simplified racial categories,(Gossett 1997) but these were always porous. The decennial censuses conducted since 1790, after slavery was well established in the United States, included classification of persons by race: white, black, mulatto, and Indian.(Nobles 2000) But, the inclusion of mulatto was an explicit acknowledgement of mixed race. In addition, before the Civil War, Virginia and some other states had legal definition of "whiteness" that provided for people being classified as white if no more than 1/8 black. (For example, if not born into slavery, Thomas Jefferson's children by his slave Sally Hemings would have been classified as legally white, as they were 7/8 white by ancestry. Three of the four surviving children entered white society as adults, and their descendants have identified as white.) In the late 18th and 19th centuries, people of mixed race often migrated to frontiers where societies were more open, and they might be accepted as white if satisfying obligations of citizenship.[18]
The more familiar "one-drop rule" was not adopted by Virginia and other states until the 20th century, but it classified persons with any known African ancestry as black (Davis 2001). Passage of such laws was often urged by white supremacists and people promoting "racial purity" through eugenics, having forgotten the long history of multi-racial unions in the South that comprised the ancestry of many families.
In other countries in the Americas, where mixing among groups was overtly more extensive, social categories have tended to be more numerous and fluid. In some cases, people may move into or out of categories on the basis of a combination of socioeconomic status, social class, ancestry, and appearance (Mörner 1967).
The term "Hispanic" as an ethnonym emerged in the 20th century with the rise of migration of laborers from Spanish-speaking countries of the western hemisphere to the United States; it includes people who may have been considered racially distinct (Black, White, Amerindian or other mixed groups) in their home countries. Today, the word "Latino" is often used as a synonym for "Hispanic". Even if such categories were earlier understood as racial categories, today they have begun to represent ethno-linguistic categories (regardless of perceived race). Similarly, "Anglo" is now used among many Hispanics to refer to non-Hispanic White Americans or European Americans, most of whom speak the English language but are not of primarily English descent.
Historical trends and influences
The United States is a racially diverse country. The growth of the Hispanic population through immigration and high birth rates is noted as a partial factor for the US’ population gains in the last quarter-century. The 2000 census revealed that Native Americans had reached their highest documented population, 4.5 million, since the U.S was founded in 1776.[3]
The immigrants to the New World came largely from widely separated regions of the Old World. In the Americas, the immigrant populations began to mix among themselves and with the indigenous inhabitants of the continent. In the United States, for example, most people who identify as African American have some European ancestors, as revealed by genetic studies. In one analysis of those genetic markers that have differing frequencies between continents, European ancestry ranged from an estimated 7% for a sample of Jamaicans to ~23% for a sample of African Americans from New Orleans, where there was historically a large class of mixed race (now called Louisiana Creoles) (Parra et al. 1998).
Similarly, many people who identify as European American have some African or Native American ancestors, either through historic interracial marriages or by the gradual inclusion of people with distant mixed ancestry into the majority population. In a survey of college students who self-identified as white in a northeastern U.S. university, ~30% were estimated to have less than 90% European ancestry.[19]
In the United States since its early history, Native Americans, Africans, and Europeans were classified as belonging to different races. For nearly three centuries, the criteria among whites for membership in these groups were similar, comprising a person’s appearance, his known non-European ancestry, and his social circle. The criteria for membership in these races diverged in the late 19th century. During and after Reconstruction, after the emancipation of slaves after the Civil War, in the effort to restore white supremacy in the South, conservative whites began to classify anyone with "one drop" of "black blood", or known African ancestry, to be black. Such a legal definition was not put into law until the early 20th century in most southern states, but many established racial segregation of facilities during the Jim Crow era, after white Democrats regained control of state legislatures in the South.
In the early 20th century, this notion of "invisible" blackness was made statutory in southern states and others outside the former Confederacy, as part of the eugenics movement. Amerindians were defined by the federal government by a certain percentage of "Indian blood" (called blood quantum), related to efforts at tribal assimilation and allotting land to households under the Dawes Act in the late 19th century, and also to financial benefits given to Native Americans on reservations. Given the financial implications, the federal government developed standards for defining a person's membership in a tribe or qualification as Native American. For the past century or so, to be white was assumed to mean persons with nothing but European ancestry, but "whiteness studies" have demonstrated that new immigrant groups, such as the Irish, Italians, and Jews, had to earn their status as whites.

Efforts to track mixing between groups led to an earlier proliferation of historical categories (such as "mulatto" and "octaroon" among persons with partial African descent) and "blood quantum" distinctions, which became increasingly untethered from self-reported ancestry. In the 20th century, efforts to classify the increasingly mixed population of the United States into discrete categories generated many difficulties (Spickard 1992). By the standards used in past censuses, many mixed-race children born in the United States were classified as of a different race than one of their biological parents. In addition, a person may change personal racial identification over time because of cultural aspects, and self-ascribed race can differ from assigned race (Kressin et al. 2003).
Until the 2000 census, Latinos were required to identify as one race, and none was Latino. Partly as a result of the confusion generated by the distinction, 32.9% (U.S. census records) of Latino respondents in the 2000 census ignored the specified racial categories and checked "some other race". (Mays et al. 2003 claim a figure of 42%)
Historical trends influencing the ethnic demographics of the United States include:
- Patterns of original settlement
- settlement of the Americas by a variety of Native American peoples, including Alaska Natives.
- settlement of Pacific islands by Polynesian people, including Native Hawaiians, Samoans, the Chamorro people in Guam and the Northern Mariana Islands.
- settlement of Puerto Rico by the Taíno people.
- settlement of the United States Virgin Islands by the Ciboney, Carib, and Arawaks.
- Colonization
- Colonization of what is now eastern Canada and the area between the Appalachian Mountains and the Mississippi River as New France. Historical events, including the Expulsion of the Acadians, influenced the ethnic mix, especially in Louisiana, northern New England and New York State.
- Colonization of the Thirteen Colonies by the Dutch, English and British, and later immigrants such as Germans from northern Europe.
- Spanish colonization of the Americas, including Florida, the Southwest, and Puerto Rico, later acquired by the US.
- The Netherlands and other historical colonial powers influenced the ethnic makeup of what are now the United States Virgin Islands.
- The Atlantic slave trade, bringing millions of Africans to the South, Caribbean, and Latin America.
- Severe reduction of Native American populations in the contiguous United States, mostly because of new infectious diseases carried by European colonists, combined with warfare
- Forced migration
- Deportation and flight of United Empire Loyalists to Canada, the Caribbean and Britain after the American Revolution
- Forced removal of more than one million African Americans in the domestic slave trade from the Upper South to the Deep South during the early 19th century as Americans developed new lands for plantations
- Territorial conflict with Native Americans and the Indian removal policy of the 19th century displaced many remaining native populations from east of the Mississippi River to territories to the west, especially to what is now Oklahoma.
- Immigration
- Historical immigration to the United States from all countries of the world and throughout the history of the country, for religious, political and economic reasons. Since the late 19th century, the History of laws concerning immigration and naturalization in the United States and illegal immigration to the United States have influenced the ethnic balance of that immigration. Various groups have been denied entry due to discrimination, economic protectionism, and political conflict with their nation of origin. Other groups have received favored status, such as refugees and nationals of allied nations.
- Transatlantic migrations from Europe, especially in the 19th century, created ethnic enclaves in many eastern cities and settling many rural areas east of the Mississippi
- Immigration from Asia has had the most influence on Hawaii and the West Coast, but has also created predominantly Asian neighborhoods in many major cities across the country.
- Immigration from Mexico and other existing Latino populations has strongly influenced the Southwest.
- Westward expansion of the United States
- The Royal Proclamation of 1763 restricted the western boundary of European settlement to the watershed east of the Appalachian Mountains; despite the Confederation Congress Proclamation of 1783 and Nonintercourse Acts prohibiting private purchase of Native American lands, the territory between the Mississippi River and Appalachian Mountains granted to the United States by the Treaty of Paris (1783) was gradually opened to white settlers through public purchase of Indian lands.
- The Homestead Act promoting settlement west of the Mississippi after the Louisiana Purchase
- Mormon settlement of Utah
- California Gold Rush
- Oregon Trail
- Klondike Gold Rush promoting settlement of Alaska
- Internal migration
- African Americans escaped from slavery, sometimes via the Underground Railroad, reaching the free North before the American Civil War.
- In the 20th century, to seek jobs and escape racial violence, African Americans left the South in the Great Migration and Second Great Migration, moving to Northern, Midwestern, and Western cities, where they had to compete with recent European immigrants.
- Especially as transportation systems have improved over the centuries, it has become relatively easy for many Americans to move from one part of the country to another, given the lack of internal borders and dominance of English in most areas. Many do so for reasons of economic opportunity, climate, or culture.
- The American Industrial Revolution, promoted urbanization of what was previously a largely agrarian society
- Railroads, promoting migration westwards and streetcar suburbs, created significant ethnic shifts in urban areas.
- Economics and natural disasters have driven migration, for example during the Dust Bowl, World War II, and since the decline of the Rust Belt
- Suburbanization period after World War II, with "White flight" to new housing and away from later social unrest, followed by "black flight"
- The majority of Native Hawaiians who moved to the mainland U.S. have settled in California.
- Air conditioning has promoted migration from northern areas to the Sun Belt, aided by states' rules against union labor and having low taxes for businesses. The Jet Age promoted vacationing and part-time living in warmer areas (snowbirding).
In some cases, immigrants and migrants form ethnic enclaves; in others, mixture creates ethnically diverse neighborhoods.
Racial makeup of the U.S. population
(For demographics by specific ethnic groups rather than general race, see "Ancestry" below.)
White Americans
The majority of the more than 300 million people currently living in the United States consists of White Americans, who trace their ancestry to the original peoples of Europe, the Middle East, and North Africa.
White Americans are the majority in forty-nine of the fifty states, with Hawaii as the exception. The District of Columbia, which is not a state, has a non-white majority.[20] Non-Hispanic Whites are the majority in forty-six states; Hawaii, New Mexico, California, Texas, and the District of Columbia, the size of a city, are the exceptions.[21] These five jurisdictions have "minority majorities", i.e. minority groups are the majority populations.
The non-Hispanic White percentage (63% in 2012[5]) tends to decrease every year, and this sub-group is expected to become a plurality of the overall U.S. population after the year 2043. White Americans overall (non-Hispanic Whites together with White Hispanics) are projected to continue as the majority, at 73.1% (or 303 million out of 420 million) in 2050, from the current, official 80%.[22][23]
Although a high proportion of the population is known to have multiple ancestries, in the Census 2000, the first with the option to choose more than one, most people still identified with one racial category. Reporting depends on how persons choose to identify.
Numerous individuals (7.2% of the U.S. population) listed their ancestry as American on the 2000 census (see American ethnicity). According to the United States Census Bureau, the number of people in the U.S. who reported American and no other ancestry increased from 12.4 million in 1990 to 20.2 million in 2000. This change in reporting represented the largest "growth" of any ethnic group in the United States during the 1990s, but it represented how people reported themselves more than growth through birth rates, for instance, and certainly did not reflect immigration.
Self-identified German Americans made up 17.1% of the U.S. population, followed by Irish Americans at 12%, as reported in the 2000 U.S. Census. This makes German the largest, and Irish the second-largest, self-reported ancestry groups in the U.S. Both groups had high rates of immigration to the US beginning in the mid-19th century, triggered by the Great Potato Famine in Ireland and the failed 1848 Revolution in Germany. However, English-Americans and British-Americans are still considered the largest ethnic group due to a serious under count following the 2000 census whereby many English and British Americans self-identified under the new category entry 'American' considering themselves 'indigenous' because their families had resided in the USA for so long [24][25][26][27] or, if of mixed European ancestry, identified with a more recent and differentiated ethnic group.[28]
Most French Americans are believed descended from colonists of Catholic New France; exiled Huguenots, much fewer in number and settling in the eastern English colonies in the late 1600s and early 1700s, needed to assimilate into the majority culture and have intermarried over generations.
Isleños of Louisiana and the Hispanos of the Southwest have had, in part, direct Spanish ancestry; most self-reported White Hispanics are of Mexican, Puerto Rican, and Cuban origins, each of which are multi-ethnic nations. Hispanic immigration has increased from nations of Central and South America.[29]
According to the 2008 American Community Survey (ACS), a new kind of sampling survey, the 1,573,530 Arab Americans account for 0.5% of the American population.[30] The largest subgroup is the Lebanese Americans, with 501,907,[30] nearly a third of the Arab American population. They are mostly Christian and many are descended by several generations from ancestors who immigrated to the US in the early 20th century. More than 1/4 of all Arab Americans claimed two ancestries, including non-Arab and indicating intermarriage among their ancestors. Assyrians were also listed in the US census under Assyrian/Chaldean/Syriac.[30]
Romanian Americans: For the 2000 US Census, 367,310 Americans indicated Romanian as their first ancestry,[31] while 462,526 persons declared to have Romanian ancestry.[32] Other sources provide higher estimates for the numbers of Romanian Americans in the contemporary US; for example, the Romanian-American Network, Inc. reports a rough estimate of 1.2 million.[33]
African Americans
About 12.4% of Americans (37.6 million, including about 885,000 Hispanic or Latino) identify as Black or African American.[7] Also known as Black Americans, the Black or African-American group is the largest racial minority, as opposed to Hispanics and Latinos, who are the largest ethnic minority. Historically, persons with identifiable sub-Saharan African ancestry, even if of majority white ancestry, were classified as "Black", according to hypodescent and the holdover of the racial caste associated with slavery. Today, racial categorization depends on self-ascription.[3]
Three major subgroups come under the rubric of Black American. African Americans form the largest subgroup, and many also have European and Native American ancestry. Their African ancestors were mostly involuntarily transported as slaves to the U.S. from Africa and the Caribbean from 1619 until the de jure end of the slave trade in 1808, or its de facto end in the 1830s-40s. In the early years, some Africans came as indentured servants and earned their freedom in the colonies. Due to this history, the origins of most African Americans are usually untraceable to specific African nations; Africa serves as the general geographic origin.
Historically, most African Americans lived in the Southeastern and South Central states; at the time of the American Revolution, half the slave population lived in Virginia. But, development of the Deep South for plantations after Indian Removal resulted in a major transfer of population from the Upper South. By the time of the Civil War, most African Americans lived as slaves in Alabama, Georgia, Louisiana, Mississippi, and Texas, although populations remained in the Carolinas and the Upper South.
Beginning about World War I, hundreds of thousands and, eventually millions of black Americans left the rural South in their Great Migration to the industrial Northeast, and Midwest. From World War II until about 1960, they added the West Coast as their destination, drawn to defense jobs. These migrants were concentrated in urban areas. In total, more than 6.5 million blacks left the South through this period, escaping its segregation, Jim Crow laws, and disfranchisement formalized at the end of the 19th century in new constitutions. Since the 1980s, with improving economies in some southern cities, this migration has reversed, and millions of African Americans, many well-educated, are moving to growing metropolitan areas in that region. Today, most African Americans (56%) live in the Southern US;[7] they still live primarily in urban areas, but are increasingly moving to the suburbs.
Starting in the 1970s, immigrants from the West Indies, with origins in Jamaica, Haiti, Trinidad and Tobago, and Barbados, et al. have formed a newer portion of black Americans. This community was 2.5 million strong in 2008.[34] More recently, since the 1990s, there has also been an influx of Sub-Saharan African immigrants to the United States, from nations such as Ghana, Nigeria, Uganda, and Kenya. They are already outnumbered by their U.S.-born descendants. Together, these new African Americans comprised an estimated 2.9 million in 2008.[35]
Asian Americans
A third significant minority is the Asian American population, comprising 13.4 million in 2008, or 4.4% of the U.S. population.[7] California is home to 4.5 million Asian Americans, whereas 495,000 live in Hawaii, where they compose the plurality, at 38.5% of the islands' people. This is their largest share of any state.[36] Historically first concentrated on Hawaii and the West Coast, Asian Americans now live across the country, living and working in large numbers in New York City, Chicago, Boston, Houston, and other major urban centers.
Their histories are diverse. As with the new immigration from central and eastern Europe to the East Coast from the mid-19th century on, Asians started immigrating to the United States in large numbers in the 19th century. Chinese and Japanese men were the first to arrive in sizeable numbers, recruited as laborers; they were willing to come because of economic problems in their countries. The Chinese particularly were integral to construction and completion of the Transcontinental Railroad, among other projects. They also came from the Philippines. The sources of immigrants changed over time, especially after the US changed its immigration laws in the 1960s to make entry easier. In addition, immigration fluctuated according to wars and economic conditions in their countries of origin. Today the largest self-identified Asian sub-groups are immigrants or their descendants from the Philippines, China, Pakistan, India, Brunei, Indonesia, Vietnam, Cambodia, Taiwan, South Korea, Japan and Thailand.
Two or more races
Self-identified multiracial Americans numbered 7.0 million in 2008, or 2.3% of the population.[7] They have identified as any combination of races (White, Black or African American, Asian, American Indian or Alaska Native, Native Hawaiian or other Pacific Islander, "Some other race") and ethnicities.[37] The U.S. has a growing multiracial identity movement.
While the colonies and southern states protected white fathers by making all children born to slave mothers be classified as slaves, regardless of paternity, they also banned miscegenation or interracial marriage, most notably between whites and blacks. This did little to stop interracial relationships, except as legal, consensual unions.
Demographers state that, due to new waves of immigration, the American people through the early 20th century were mostly multi-ethnic descendants of various immigrant nationalities, who maintained cultural distinctiveness until, over time, assimilation, migration and integration took place. The African American Civil Rights Movement through the 20th century gained passage of important legislation to enforce constitutional rights of minorities.
According to James P. Allen and Eugene Turner from California State University, Northridge, by some calculations in the 2000 Census, the multiracial population that is part white (which is the largest percentage of the multiracial population), is as follows:
- white/Native American and Alaskan Native, at 7,015,017,
- white/black at 737,492,
- white/Asian at 727,197, and
- white/Native Hawaiian and Other Pacific Islander at 125,628.[38]
Multiracial Americans and admixture
| % European Admixture | Frequency |
|---|---|
| 90-100 | 68% |
| 80-89.9 | 22% |
| 70-79.9 | 8% |
| 60-69.9 | < 1% |
| 50-59.9 | < 1% |
| 40-49.9 | < 1% |
| 0-39.9 | 0 |
In a survey of college students who self-identified as 'white' in a northeastern U.S. university, genetic testing revealed that around 30% had less than 90% European ancestry. Through DNA analysis, the study found an average of 0.7% African genetic admixture with a standard error of 0.9%, and 3.2% Native American admixture with a standard error of 1.6%, in a sample of white Americans in State College, Pennsylvania. Most of the non-white admixture was concentrated in 30% of the sample, with African admixture ranging from 2-20%, with an average of 2.3%.[19][39]
In 1958 Robert Stuckert produced a statistical analysis using historical census data and immigration statistics. He concluded that the growth in the White population could not be attributed solely to births in the White population and immigration from Europe, but was also due to people identifying as white who were partly black. He concluded that 21 percent of white Americans had some recent African-American ancestors. He also concluded that the majority of Americans of known African descent were partly European and not entirely sub-Saharan African.[40]
More recently, many different DNA studies have shown that many African Americans have European admixture, reflecting the long history in this country of the various populations. Proportions of European admixture in African-American DNA have been found in studies to be 17%[41] and between 10.6% and 22.5%.[42] Another recent study found the average to be 21.2%, with a standard error of 1.2%.[19]
The Race, Ethnicity, and Genetics Working Group of the National Human Genome Research Institute notes that "although genetic analyses of large numbers of loci can produce estimates of the percentage of a person’s ancestors coming from various continental populations, these estimates may assume a false distinctiveness of the parental populations, since human groups have exchanged mates from local to continental scales throughout history."[39]
Native Americans and Alaska Natives
Indigenous peoples of the Americas, particularly Native Americans, made up 0.8% of the population in 2008, numbering 2.4 million.[7] An additional 2.3 million persons declared part-American Indian or Alaska Native ancestry.[43]
The legal and official designation of who is Native American has aroused controversy by demographers, tribal nations, and government officials for many decades. Federally recognized tribes and state recognized tribes set their own membership requirements; tribal enrollment may require residency on a reservation, documented lineal descent from recognized records, such as the Dawes Rolls, and other criteria. Some tribes have adopted the use of blood quantum, requiring members to have a certain percentage. The federal government requires individuals to certify documented blood quantum of ancestry for certain federal programs, such as education benefits, available to members of recognized tribes. But Census takers accept any respondent's identification. Genetic scientists estimated that more than 15 million other Americans, including African Americans, may have up to one quarter of American Indian ancestry.
Once thought to face extinction as a race or culture, Native Americans of numerous tribes have achieved revival of aspects of their cultures, together with asserting their sovereignty and direction of their own affairs since the mid-20th century. Many have started language programs to revive use of traditional languages; some have established tribally controlled colleges and other schools on their reservations, so that education is expressive of their cultures. Since the late 20th century, many tribes have developed gaming casinos on their sovereign land to raise revenues for economic development, as well as to promote the education and welfare of their people through health care and construction of improved housing.
Today more than 800,000 to one million persons claim Cherokee descent in part or as full-bloods; of these, an estimated 300,000 live in California, 70,000—160,000 in Oklahoma, and 15,000 in North Carolina in ancestral homelands.
The second largest tribal group is the Navajo, who call themselves Diné and live on a 16-million acre (65,000 km²) Indian reservation covering northeast Arizona, northwest New Mexico, and southeast Utah. It is home to half of the 450,000 Navajo Nation members. The third largest group are the Lakota (Sioux) Nation, with distinct federally recognized tribes located in the states of Minnesota, Nebraska, Montana, Wyoming; and North and South Dakota.
Native Hawaiians and other Pacific Islanders
Native Hawaiians and other Pacific Islanders numbered 427,810 in 2008, or 0.1% of the population.[7] Additionally, nearly as many individuals identify as having partial Native Hawaiian ancestry, for a total of 829,949 people of full or part Native Hawaiian ancestry.[44] This group constitutes the smallest minority in the United States. More than half identify as "full-blooded", but historically most Native Hawaiians on the island chain of Hawaii are believed to have admixture with Asian and European ancestries. But, the Census takes reporting by individuals as to how they identify.
Some demographers believe that by the year 2025, the last full-blooded Native Hawaiian will die off, leaving a culturally distinct, but racially-mixed population. The total number of persons who have identified as Native Hawaiian in 2008 was more than the estimated Hawaiian population when the US annexed the islands in 1898. Native Hawaiians are receiving ancestral land reparations. Throughout Hawaii, they are working to preserve and assert adaptation of Native Hawaiian customs and Hawaiian language; they have cultural schools solely for legally Native Hawaiian students.
Members of other Race
In the 2000 census, this non-standard category[3] was especially intended to capture responses such as Mestizo and Mulatto,[10] two large multiracial groups in most of the countries of origin of Hispanic and Latino Americans. However, many other responses are captured by the category.
In 2008 15.0 million people, nearly 5% of the total U.S. population, were estimated to be "Some other race",[7] with 95% of them being Hispanic or Latino.[8]
Due to this category's non-standard status, statistics from government agencies other than the Census Bureau (for example: the Centers for Disease Control's data on vital statistics, or the FBI's crime statistics), but also the Bureau's own official Population Estimates, omit the "Some other race" category and include most of the people in this group in the white population, thus including the vast majority (about 90%) of Hispanic and Latino Americans in the white population. For an example of this, see The World Factbook, published by the Central Intelligence Agency.[45]
Hispanic and Latino Americans
| Race | Population | % of all Hispanic and Latino Americans |
|---|---|---|
| White | 26,735,713 | 53.0 |
| Some other race (mestizo, mulatto, etc.) |
18,503,103 | 36.7 |
| Two or more races | 3,042,592 | 6.0 |
| Black | 1,243,471 | 2.5 |
| American Indian and Alaska Native | 685,150 | 1.4 |
| Asian | 209,128 | 0.4 |
| Native Hawaiian and Pacific Islander | 58,437 | 0.1 |
| Total | 50,477,594 | 100.0 |
In 2008, "Hispanic or Latino origin" was the self-identification of 47 million Americans. They chiefly have origins in the Spanish-speaking nations of Latin America. Very few also come from other places, for example: 0.2% of Hispanic and Latino Americans were born in Asia.[47] The group is heterogeneous in race and national ancestry.
The Census Bureau defines "Hispanic or Latino origin" thus:
| “ | For Census 2000, American Community Survey: People who identify with the terms "Hispanic" or "Latino" are those who classify themselves in one of the specific Hispanic or Latino categories listed on the Census 2000 or ACS questionnaire - "Mexican," "Puerto Rican," or "Cuban" - as well as those who indicate that they are "other Spanish, Hispanic, or Latino." Origin can be viewed as the heritage, nationality group, lineage, or country of birth of the person, or the person's parents or ancestors, before their arrival in the United States. People who identify their origin as Spanish, Hispanic, or Latino may be of any race.[48] | ” |
The leading country-of-origin for Hispanic Americans is Mexico (30.7 million), followed by Puerto Rico (4.2 million) (which actually has a special relationship with the US, of which its people are citizens), and Cuba (1.6 million), as of 2008.[49] However as of 2010, there were 1,648,968 Salvadorans in the United States, the largest of the U.S-Central American community. Salvadorans are poised to become the third largest Hispanic group by the next census, significantly overtaking and replacing Cubans.[50] Recent estimates already put the Salvadoran population as high as 2 million, as of 2013, the third largest Hispanic-American group.[51]
62.4% of Hispanic and Latino Americans identified as white.[8] 30.5% identified as "Some other race" (other than the ones listed). According to the PEP ( 91.9% of Latinos are white, as these official estimates do not recognize "Some other race".[5] In the official estimates, Black or African American Hispanics are the second-largest group, with 1.9 million, or 4.0% of the whole group. The remaining Hispanics are accounted as follows, first per the PEP: 1.6% American Indian and Alaska Native, 1.5% Two or more races, 0.7% Asian, and 0.03% Native Hawaiian and Other Pacific Islander. Per the ACS: 3.9% Two or more races, 1.9% Black or African American, 1.0% American Indian and Alaska Native, 0.4% Asian, and 0.05% Native Hawaiian and Other Pacific Islander.[8]
The Hispanic or Latino population is young and fast-growing, due to immigration and higher birth rates.[47] For decades it has contributed significantly to U.S. population increases, and this is expected to continue. The Census Bureau projects that by 2050, one-quarter of the population will be Hispanic or Latino.[22][52]
Ancestry
The ancestry of the people of the United States is widely varied and includes descendants of populations from around the world. In addition to its variation, the ancestry of people of the United States is also marked by varying amounts of intermarriage between ethnic and racial groups.
While some Americans can trace their ancestry back to a single ethnic group or population in Europe, Africa, or Asia, these are often first- and second-generation Americans. Generally, the degree of mixed heritage increases the longer one's ancestors have lived in the United States (see melting pot). In theory, there are several means available to discover the ancestry of the people residing in the United States, including genealogy, genetics, oral and written history, and analysis of Federal Population Census schedules. In practice, only few of these have been used for a larger part of the population.
Analysis by 2000 Federal Population Census

Fifteen largest ancestries in the United States as self reported in the 2000 Census:[53]
| Rank | Ancestry | Number | Percent of total population |
|---|---|---|---|
| — | U.K. (1801–1922) | 66,224,627[54] | 23.3%[54] |
| 1 | German | 42,841,569 | 15.2% |
| 2 | Irish | 30,524,799 | 10.8% |
| 3 | African | 24,903,412 | 8.8% |
| 4 | English | 24,509,692 | 8.7% |
| 5 | American | 20,188,305 | 7.2% |
| 6 | Mexican | 18,382,291 | 6.5% |
| 7 | Italian | 15,638,348 | 5.6% |
| 8 | Polish | 8,977,235 | 3.2% |
| 9 | French | 8,309,666 | 3.0% |
| 10 | Amerindian | 7,876,568 | 2.8% |
| 11 | Scottish | 4,890,581 | 1.7% |
| 12 | Dutch | 4,541,770 | 1.6% |
| 13 | Norwegian | 4,477,725 | 1.6% |
| 14 | Scotch-Irish | 4,319,232 | 1.5% |
| 15 | Chinese | 4,010,114 | 1.4% |
Analysis by 2010 Federal Population Census
Fifteen largest ancestries in the United States in the 2010 census.[55]
| Rank | Ancestry | Number | Percent of total population |
|---|---|---|---|
| 1 | German | 49,206,934 | 17.1% |
| 2 | African | 41,284,752 | 13.6% |
| 3 | Irish | 35,523,082 | 11.6% |
| 4 | Mexican | 31,789,483 | 10.9% |
| 5 | English | 26,923,091 | 9.0% |
| 6 | American | 19,911,467 | 6.7% |
| 7 | Italian | 17,558,598 | 5.9% |
| 8 | Polish | 9,739,653 | 3.0% |
| 9 | French | 9,136,092 | 2.9% |
| 10 | Scottish | 5,706,263 | 1.9% |
| 11 | Scotch-Irish | 5,102,858 | 1.7% |
| 12 | Amerindian | 4,920,336 | 1.6% |
| 13 | Dutch | 4,810,511 | 1.6% |
| 14 | Puerto Rican | 4,607,774 | 1.5% |
| 15 | Norwegian | 4,557,539 | 1.5% |
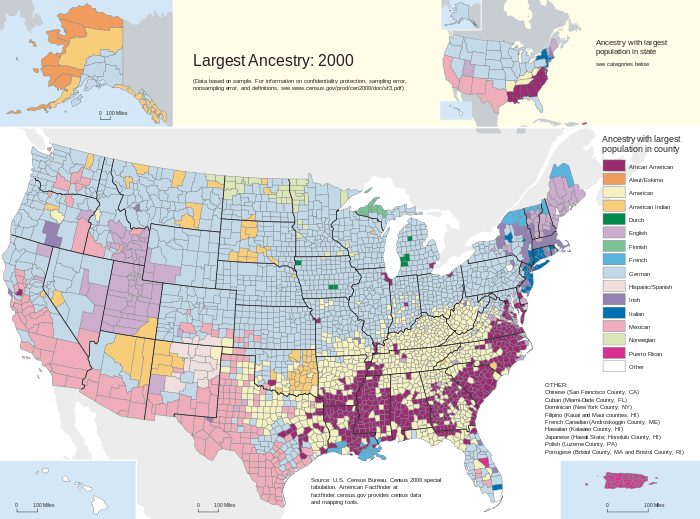
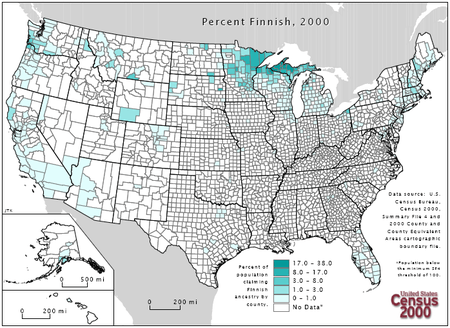
Ancestry maps
Major ancestries
These images display frequencies of self-reported ancestries, as of the 2000 U.S. Census. Regional African ancestries are not listed, though an African American map has been added from another source.
-

Frequency of American ancestry
-

Density of Asian Americans
-

Percent of Asian Americans
-

Density of African Americans
-
Percent of African Americans
-

Density of Native Hawaiian Americans
-

Percent of Native Hawaiian Americans
-

Density of Native Americans
-

Percent of Native Americans
-

Density of White Americans
-

Percent of White Americans
-

Density of Hispanic ancestry
-

Percent of Hispanic ancestry


European American ancestries
These images display frequencies of self-reported European American ancestries as of the 2000 U.S. Census.
-

Jewish ancestry
-

Scots-Irish ancestry


See also
- Historical racial and ethnic demographics of the United States
- Race and crime in the United States
- Race and ethnicity in the United States Census
- Race and genetics
- Racism in the United States
- 2009 Louisiana interracial marriage incident
Backgrounds:
- African American
- Asian American
- European American
- Hispanic and Latino Americans
- Native American
- White American
Other:
- Ancestry of the people of the United States
- Demographics of the United States
- Immigration to the United States
- Person of color
- Language Spoken at Home (U.S. Census)
References
- ↑ "OUR DIVERSE POPULATION: Race and Hispanic Origin, 2000" (PDF). United States Census Bureau. Retrieved 2008-04-24.
- ↑ 2.0 2.1 2.2 2.3 "Revisions to the Standards for the Classification of Federal Data on Race and Ethnicity". Office of Management and Budget. Retrieved 2008-05-05.
- ↑ 3.0 3.1 3.2 3.3 3.4 3.5 3.6 3.7 3.8 Grieco, Elizabeth M; Rachel C. Cassidy. "Overview of Race and Hispanic Origin: 2000" (PDF). United States Census Bureau. Retrieved 2008-01-30.
- ↑ 4.0 4.1 4.2 4.3 4.4 4.5 "Detailed Tables - American FactFinder; T3-2008. Race [7]". 2008 Population Estimates. U.S. Census Bureau. Retrieved 2010-02-28.
- ↑ 5.0 5.1 5.2 5.3 5.4 "Detailed Tables - American FactFinder; T4-2008. Hispanic or Latino By Race [15]". 2008 Population Estimates. U.S. Census Bureau. Retrieved 2010-02-28.
- ↑ "United States". United States Census Bureau. United States Census Bureau. Retrieved October 22, 2014.
- ↑ 7.0 7.1 7.2 7.3 7.4 7.5 7.6 7.7 "B02001. RACE - Universe: TOTAL POPULATION". 2008 American Community Survey 1-Year Estimates. United States Census Bureau. Retrieved 2010-02-28.
- ↑ 8.0 8.1 8.2 8.3 8.4 "B03002. HISPANIC OR LATINO ORIGIN BY RACE - Universe: TOTAL POPULATION [by region]". 2008 American Community Survey 1-Year Estimates. United States Census Bureau. Retrieved 2010-03-01.
- ↑ "Persons reporting some other race, percent, 2000". United States Census Bureau. Retrieved 2008-05-05.
- ↑ 10.0 10.1 "Racial and Ethnic Classifications Used in Census 2000 and Beyond". United States Census Bureau. Retrieved 2007-11-02.
- ↑ "U.S. Census Bureau: FAQs". Ask.census.gov. Retrieved 2013-05-16.
- ↑ The American FactFinder
- ↑ Introduction to Race and Ethnic (Hispanic Origin) Data for the Census 2000 Special EEO File
- ↑ "Short Form Questionnaire" (PDF). United States Census Bureau. Retrieved 2008-05-05.
- ↑ "CIA - The World Factbook -- Field Listing :: Ethnic groups". CIA. Retrieved 2010-04-02.
- ↑ "U.S. Census Bureau Guidance on the Presentation and Comparison of Race and Hispanic Origin Data". United States Census Bureau. Retrieved 2007-04-06.
Race and Hispanic origin are two separate concepts in the federal statistical system. People who are Hispanic may be of any race. People in each race group may be either Hispanic or Not Hispanic. Each person has two attributes, their race (or races) and whether or not they are Hispanic.
- ↑ Melvin Randolph Gilmore, "The True Logan Fontenelle", Publications of the Nebraska State Historical Society, Vol. 19, edited by Albert Watkins, Nebraska State Historical Society, 1919, p. 64, at GenNet, accessed 25 August 2011
- ↑ 18.0 18.1 Paul Heinegg, Free African Americans in Virginia, North Carolina, South Carolina, Maryland and Delaware, 1995-2006
- ↑ 19.0 19.1 19.2 Mark D. Shriver et al. "Skin pigmentation, biogeographical ancestry and admixture mapping." Human Genetics (2003) 112: 387–399.
- ↑ "B02001. RACE - Universe: TOTAL POPULATION [by state]". American Community Survey 1-Year Estimates. United States Census Bureau. 2008. Retrieved 2010-04-02.
- ↑ "Texas Becomes Nation’s Newest "Majority-Minority" State, Census Bureau Announces". United States Census Bureau. Archived from the original on 2008-04-20. Retrieved 2008-05-05.
- ↑ 22.0 22.1 "UNITED STATES POPULATION PROJECTIONS BY RACE AND HISPANIC ORIGIN: 2000 TO 2050" (PDF). United States Census Bureau. Archived from the original (EXCEL) on 2008-03-06. Retrieved 2008-05-05.
- ↑ "T3-2006. Race [7]". 2006 Population Estimates. U.S. Census Bureau. Retrieved 2008-05-30.
- ↑ Sharing the Dream: White Males in a Multicultural America By Dominic J. Pulera.
- ↑ Reynolds Farley, 'The New Census Question about Ancestry: What Did It Tell Us?', Demography, Vol. 28, No. 3 (August 1991), pp. 414, 421.
- ↑ Stanley Lieberson and Lawrence Santi, 'The Use of Nativity Data to Estimate Ethnic Characteristics and Patterns', Social Science Research, Vol. 14, No. 1 (1985), pp. 44-6.
- ↑ Stanley Lieberson and Mary C. Waters, 'Ethnic Groups in Flux: The Changing Ethnic Responses of American Whites', Annals of the American Academy of Political and Social Science, Vol. 487, No. 79 (September 1986), pp. 82-86.
- ↑ Mary C. Waters, Ethnic Options: Choosing Identities in America (Berkeley: University of California Press, 1990), p. 36.
- ↑ Tafoya, Sonya (2004). "Shades of Belonging" (PDF). Pew Hispanic Center. Retrieved 2008-01-22.
- ↑ 30.0 30.1 30.2 "B04003. TOTAL ANCESTRY REPORTED". 2008 American Community Survey 1-Year Estimates. United States Census Bureau. Retrieved 2010-04-02.
- ↑ .2000 U.S. Census, ancestry responses
- ↑ "American FactFinder". Factfinder.census.gov. Retrieved 2013-05-16.
- ↑ Ro-Am Network, 2002 study on Romanian communities
- ↑ "United States - Selected Population Profile in the United States (West Indian (excluding Hispanic origin groups) (300-359))". 2008 American Community Survey 1-Year Estimates. U.S. Census Bureau. Retrieved 2010-04-14.
- ↑ "United States - Selected Population Profile in the United States (Subsaharan African (500-599))". 2008 American Community Survey 1-Year Estimates. U.S. Census Bureau. Retrieved 2010-04-14.
- ↑ "B02001. RACE - Universe: TOTAL POPULATION [regions and states]". 2008 American Community Survey 1-Year Estimates. United States Census Bureau. Retrieved 2010-04-25.
- ↑ Jones, Nicholas A.; Amy Symens Smith. "The Two or More Races Population: 2000. Census 2000 Brief" (PDF). United States Census Bureau. Retrieved 2008-05-08.
- ↑ http://www.csupomona.edu/~mreibel/2000_Census_Files/Allen-Turner.doc
- ↑ 39.0 39.1 Race, Ethnicity, and Genetics Working Group, National Human Genome Research Institute, Bethesda, "The Use of Racial, Ethnic, and Ancestral Categories in Human Genetics Research"
- ↑ "Robert Stuckert, "African Ancestry Of The White American Population"" (PDF). Retrieved 2013-05-16.
- ↑ Heather E. Collins-Schramm and others, "Markers that Discriminate Between European and African Ancestry Show Limited Variation Within Africa," Human Genetics 111 (2002): 566-69.
- ↑ Esteban J. Parra, Amy Marcini, Joshua Akey, Jeremy Martinson, Mark A. Batzer, Richard Cooper, Terrence Forrester, David B. Allison, Ranjan Deka, Robert E. Ferrell, Mark D. Shriver, "Estimating African American Admixture Proportions by Use of Population- Specific Alleles," American Journal of Human Genetics 63:1839–1851, 1998.
- ↑ "B02010. AMERICAN INDIAN AND ALASKA NATIVE ALONE OR IN COMBINATION WITH ONE OR MORE OTHER RACES". 2008 American Community Survey 1-Year Estimates. United States Census Bureau. Retrieved 2010-05-11.
- ↑ "B02012. NATIVE HAWAIIAN AND OTHER PACIFIC ISLANDER ALONE OR IN COMBINATION WITH ONE OR MORE OTHER RACES". 2008 American Community Survey 1-Year Estimates. United States Census Bureau. Retrieved 2010-05-11.
- ↑ "CIA - The World Factbook -- United States". CIA. Retrieved 2008-05-08.
- ↑ "Overview of Race and Hispanic Origin: 2010" (PDF). Retrieved 2013-05-16.
- ↑ 47.0 47.1 "United States - Selected Population Profile in the United States (Hispanic or Latino (of any race))". 2008 American Community Survey 1-Year Estimates. U.S. Census Bureau. Retrieved 2010-04-08.
- ↑ "American FactFinder Help; Hispanic or Latino origin". U.S. Census Bureau. Retrieved 2010-04-08.
- ↑ "C03001. HISPANIC OR LATINO ORIGIN BY SPECIFIC ORIGIN - Universe: TOTAL POPULATION". 2008 American Community Survey 1-Year Estimates. U.S. Census Bureau. Retrieved 2010-04-08.
- ↑ US Census Bureau 2011 American Community Survey B03001 1-Year Estimates HISPANIC OR LATINO ORIGIN BY SPECIFIC ORIGIN retrieved October 28, 2012
- ↑ Salvadorans in the US
- ↑ "US Census Press Releases". United States Census Bureau. 2004-03-18. Archived from the original on 2008-03-13. Retrieved 2008-05-05.
- ↑ Ancestry: 2000
- ↑ 54.0 54.1 Combining immigrants from the erstwhile United Kingdom of Great Britain and Ireland, i.e. Irish American, English American, Scottish American, Scotch-Irish American, and Welsh American immigrants.
- ↑ "The Largest Ancestry Groups in The United States". Business Insider. Retrieved 25 April 2014.
External links
- For additional county-level U.S. maps on a wide range of ethnic and nationality groups, visit the Map Gallery of Ethnic Groups in the United States, part of the course materials for American Ethnic Geography at Valparaiso University.
References
| ||||||||||||||||||||||||||||||||||||