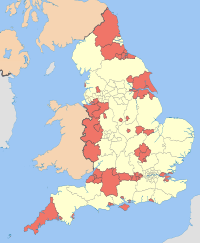
Portsmouth City Council elections
One third of Portsmouth City Council in Hampshire, England is elected each year, followed by one year without election.
Political control
Council elections
- Portsmouth City Council election, 1998
- Portsmouth City Council election, 1999
- Portsmouth City Council election, 2000
- Portsmouth City Council election, 2002 (whole council elected after boundary changes increased the number of seats by 3)[3]
- Portsmouth City Council election, 2003
- Portsmouth City Council election, 2004
- Portsmouth City Council election, 2006
- Portsmouth City Council election, 2007
- Portsmouth City Council election, 2008
- Portsmouth City Council election, 2010
- Portsmouth City Council election, 2011
- Portsmouth City Council election, 2012
- Portsmouth City Council election, 2014
- Portsmouth City Council election, 2015
By-election results
| Drayton & Farlington by-election 1 September 2005[4] |
| Party |
Candidate |
Votes |
% |
±% |
|
Conservative |
Stephen Wemyss |
2,148 |
50.9 |
+4.2 |
|
Liberal Democrat |
Patrict Whittle |
1,973 |
46.7 |
+4.3 |
|
English Democrats |
David Knight |
102 |
2.4 |
+2.4 |
| Majority |
175 |
4.2 |
|
| Turnout |
4,223 |
43.0 |
|
|
Conservative hold |
Swing |
|
|
| Fratton by-election 16 August 2007[5] |
| Party |
Candidate |
Votes |
% |
±% |
|
Liberal Democrat |
David Fuller |
1,196 |
58.6 |
+2.6 |
|
Conservative |
Gerry Oldfield |
496 |
24.3 |
+1.3 |
|
Labour |
Simon Payne |
144 |
7.1 |
-5.4 |
|
English Democrats |
David Knight |
131 |
6.4 |
-2.1 |
|
Green |
Sean Sanders |
56 |
2.7 |
+2.7 |
|
Independent |
Mark Austin |
17 |
0.8 |
+0.8 |
| Majority |
700 |
34.3 |
+1.3 |
| Turnout |
2,040 |
20.7 |
|
|
Liberal Democrat hold |
Swing |
|
|
| Nelson by-election 27 September 2007[6] |
| Party |
Candidate |
Votes |
% |
±% |
|
Labour |
Sarah Cook |
791 |
35.0 |
+3.2 |
|
Conservative |
Jim Fleming |
682 |
30.2 |
+3.3 |
|
Liberal Democrat |
Alex Naylor |
548 |
24.2 |
-2.9 |
|
UKIP |
Michelle Essery |
90 |
4.0 |
+4.0 |
|
Green |
Calum Kennedy |
78 |
3.5 |
-2.9 |
|
English Democrats |
Clive Percy |
71 |
3.1 |
-4.4 |
| Majority |
109 |
4.8 |
|
| Turnout |
2,260 |
22.4 |
|
|
Labour hold |
Swing |
|
|
| Copnor by-election 7 February 2008[7] |
| Party |
Candidate |
Votes |
% |
±% |
|
Liberal Democrat |
Andy Fraser |
1,835 |
55.8 |
+38.4 |
|
Conservative |
Jim Fleming |
904 |
27.5 |
-18.6 |
|
Labour |
Terry O'Brien |
349 |
10.6 |
-8.2 |
|
English Democrats |
David Knight |
117 |
3.6 |
-13.6 |
|
UKIP |
Michelle Essery |
57 |
1.7 |
+1.7 |
|
Independent |
Mark Austin |
28 |
0.9 |
+0.9 |
| Majority |
931 |
28.3 |
|
| Turnout |
3,290 |
33.9 |
|
|
Liberal Democrat gain from Conservative |
Swing |
|
|
References
External links
|
|---|
| | Districts | | |
|---|
| | Councils | |
|---|
| | Local elections |
- Bath and North East Somerset
- Bedford
- Blackburn with Darwen
- Blackpool
- Bournemouth
- Bracknell Forest
- Brighton and Hove
- Bristol
- Central Bedfordshire
- Cheshire East
- Cheshire West and Chester
- Cornwall
- County Durham
- Darlington
- Derby
- East Riding of Yorkshire
- Halton
- Hartlepool
- Herefordshire
- Isle of Wight
- Kingston upon Hull
- Leicester
- Luton
- Medway
- Middlesbrough
- Milton Keynes
- North East Lincolnshire
- North Lincolnshire
- North Somerset
- Northumberland
- Nottingham
- Peterborough
- Plymouth
- Poole
- Portsmouth
- Reading
- Redcar and Cleveland
- Rutland
- Shropshire
- Slough
- Southampton
- Southend-on-Sea
- South Gloucestershire
- Stockton-on-Tees
- Stoke-on-Trent
- Swindon
- Telford and Wrekin
- Thurrock
- Torbay
- Warrington
- West Berkshire
- Wiltshire
- Windsor and Maidenhead
- Wokingham
- York
|
|---|
|
