Portsmouth City Council election, 2006
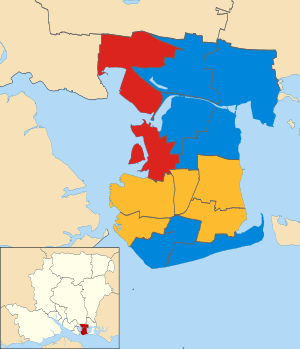
Map of the results of the 2006 Portsmouth council election.
Conservatives in blue, Liberal Democrats in yellow and
Labour in red.
Elections to Portsmouth City Council were held on 4 May 2006. One third of the council was up for election and the council stayed under no overall control.
After the election, the composition of the council was
Election result
| Portsmouth Local Election Result 2006 |
| Party |
Seats |
Gains |
Losses |
Net gain/loss |
Seats % |
Votes % |
Votes |
+/− |
| |
Conservative |
7 |
3 |
1 |
+2 |
50.0 |
42.3 |
19,034 |
+4.3% |
| |
Liberal Democrat |
5 |
1 |
1 |
0 |
35.7 |
33.6 |
15,122 |
-5.7% |
| |
Labour |
2 |
0 |
2 |
-2 |
14.3 |
18.1 |
8,151 |
-2.6% |
| |
Green |
0 |
0 |
0 |
0 |
0 |
3.2 |
1,435 |
+1.9% |
| |
Independent |
0 |
0 |
0 |
0 |
0 |
1.3 |
572 |
+1.3% |
| |
English Democrats |
0 |
0 |
0 |
0 |
0 |
1.0 |
435 |
+1.0% |
| |
Respect |
0 |
0 |
0 |
0 |
0 |
0.5 |
217 |
+0.5% |
Ward results
| Baffins |
| Party |
Candidate |
Votes |
% |
±% |
|
Liberal Democrat |
Darron Phillips |
1,663 |
45.6 |
-1.0 |
|
Conservative |
Nigel Sizer |
1,267 |
34.8 |
+2.0 |
|
Labour |
Victoria Fry |
443 |
12.2 |
+0.4 |
|
Green |
Sarah Coote |
271 |
7.4 |
-1.4 |
| Majority |
396 |
10.8 |
-3.0 |
| Turnout |
3,644 |
35.3 |
-1.7 |
|
Liberal Democrat hold |
Swing |
|
|
| Central Southsea |
| Party |
Candidate |
Votes |
% |
±% |
|
Conservative |
Lee Hunt |
1,435 |
39.5 |
+4.6 |
|
Liberal Democrat |
John Ireland |
1,298 |
35.7 |
-3.3 |
|
Labour |
John Ferrett |
470 |
12.9 |
-13.2 |
|
Green |
Betty Burns |
428 |
11.8 |
+11.8 |
| Majority |
137 |
3.8 |
|
| Turnout |
3,631 |
36.4 |
-3.1 |
|
Conservative hold |
Swing |
|
|
| Charles Dickens |
| Party |
Candidate |
Votes |
% |
±% |
|
Liberal Democrat |
Jacqueline Hancock |
1,276 |
50.0 |
-2.4 |
|
Labour |
Keith Crabbe |
583 |
22.8 |
-7.9 |
|
Conservative |
Michael Lowery |
476 |
18.7 |
+1.8 |
|
Respect |
Lee Sprake |
217 |
8.5 |
+8.5 |
| Majority |
693 |
27.2 |
+5.5 |
| Turnout |
2,552 |
26.4 |
-0.8 |
|
Liberal Democrat hold |
Swing |
|
|
| Copnor |
| Party |
Candidate |
Votes |
% |
±% |
|
Conservative |
Michael Park |
1,470 |
46.4 |
-3.0 |
|
Labour |
Michelle Treacher |
588 |
18.6 |
-3.5 |
|
Liberal Democrat |
Peter Eddis |
537 |
17.0 |
-11.5 |
|
English Democrats |
David Knight |
435 |
13.7 |
+13.7 |
|
Green |
Anthony George |
136 |
4.3 |
+4.3 |
| Majority |
882 |
27.8 |
+6.9 |
| Turnout |
3,166 |
32.5 |
+0.6 |
|
Conservative hold |
Swing |
|
|
| Cosham |
| Party |
Candidate |
Votes |
% |
±% |
|
Conservative |
April Windebank |
1,781 |
54.5 |
+10.4 |
|
Labour |
Donna Abrahart |
809 |
24.7 |
-9.8 |
|
Liberal Democrat |
Alan Webb |
680 |
20.8 |
-0.7 |
| Majority |
972 |
29.8 |
+20.2 |
| Turnout |
3,270 |
33.8 |
-3.3 |
|
Conservative gain from Labour |
Swing |
|
|
| Drayton and Farlington |
| Party |
Candidate |
Votes |
% |
±% |
|
Conservative |
Simon Bosher |
2,648 |
61.3 |
+14.6 |
|
Liberal Democrat |
Patrick Whittle |
1,234 |
28.6 |
-13.8 |
|
Labour |
Andrew Silvester |
438 |
10.1 |
-0.9 |
| Majority |
1,414 |
32.7 |
+28.4 |
| Turnout |
4,320 |
43.9 |
-4.1 |
|
Conservative hold |
Swing |
|
|
| Eastney and Craneswater |
| Party |
Candidate |
Votes |
% |
±% |
|
Conservative |
Luke Stubbs |
1,618 |
46.2 |
+8.4 |
|
Liberal Democrat |
Theresa Hall |
1,601 |
45.7 |
+0.1 |
|
Labour |
Geoffrey Wade |
286 |
8.2 |
-1.1 |
| Majority |
17 |
0.5 |
|
| Turnout |
3,505 |
37.6 |
-2.4 |
|
Conservative gain from Liberal Democrat |
Swing |
|
|
| Fratton |
| Party |
Candidate |
Votes |
% |
±% |
|
Liberal Democrat |
Michael Hancock |
1,551 |
59.8 |
+6.7 |
|
Conservative |
Peter Ross |
724 |
27.9 |
+6.1 |
|
Labour |
Peter Guthrie |
318 |
12.3 |
-2.4 |
| Majority |
827 |
31.9 |
+0.6 |
| Turnout |
2,593 |
26.8 |
-2.5 |
|
Liberal Democrat hold |
Swing |
|
|
| Milton |
| Party |
Candidate |
Votes |
% |
±% |
|
Liberal Democrat |
Caroline Scott |
1,386 |
41.3 |
-11.5 |
|
Conservative |
Hilary Collins |
1,325 |
39.5 |
+8.6 |
|
Green |
Alan Bish |
334 |
10.0 |
+10.0 |
|
Labour |
Kenneth Ferrett |
310 |
9.2 |
-7.1 |
| Majority |
61 |
1.8 |
-20.1 |
| Turnout |
3,355 |
35.7 |
-1.1 |
|
Liberal Democrat hold |
Swing |
|
|
| Nelson |
| Party |
Candidate |
Votes |
% |
±% |
|
Labour |
Jason Fazackarley |
1,049 |
39.3 |
-0.6 |
|
Conservative |
Selina Corkerton |
824 |
30.9 |
-3.1 |
|
Liberal Democrat |
Benn Berry |
527 |
19.8 |
-6.3 |
|
Green |
Calum Kennedy |
266 |
10.0 |
+10.0 |
| Majority |
225 |
8.4 |
+2.5 |
| Turnout |
2,666 |
27.1 |
-0.7 |
|
Labour hold |
Swing |
|
|
| Paulsgrove |
| Party |
Candidate |
Votes |
% |
±% |
|
Labour |
James Patey |
1,336 |
49.7 |
+9.7 |
|
Conservative |
James Williams |
922 |
34.3 |
-6.0 |
|
Liberal Democrat |
Harry Dickinson |
428 |
15.9 |
-3.8 |
| Majority |
414 |
15.4 |
|
| Turnout |
2,686 |
27.8 |
+1.5 |
|
Labour hold |
Swing |
|
|
| St Jude |
| Party |
Candidate |
Votes |
% |
±% |
|
Conservative |
Linda Symes |
1,132 |
38.8 |
-0.8 |
|
Liberal Democrat |
Roger Inkpen |
1,044 |
35.8 |
-14.1 |
|
Independent |
Elaine Baker |
572 |
19.6 |
+19.6 |
|
Labour |
Simon Payne |
172 |
5.9 |
-4.6 |
| Majority |
88 |
3.0 |
|
| Turnout |
2,920 |
33.6 |
-1.9 |
|
Conservative hold |
Swing |
|
|
| St Thomas |
| Party |
Candidate |
Votes |
% |
±% |
|
Liberal Democrat |
Richard Jensen |
1,465 |
44.6 |
-1.7 |
|
Conservative |
Sandra Theresa |
1,363 |
41.5 |
-1.1 |
|
Labour |
Beverley Hancock |
460 |
14.0 |
+3.9 |
| Majority |
102 |
3.1 |
-0.6 |
| Turnout |
3,288 |
35.8 |
-3.8 |
|
Liberal Democrat gain from Conservative |
Swing |
|
|
References