Plug-in electric vehicles in the United States
The fleet of plug-in electric vehicles in the United States is the largest in the world, with a 43% share of global sales as of September 2014. Since 2008, about 260,000 highway legal plug-in electric cars have been sold in the country through the end of September 2014.[2] California accounts for about 40% of all plug-in cars sold in the country, with over 100,000 units sold through August 2014,[3] and not only has more plug-in electric vehicles than any other American state but also more than any other country.[4][5] The U.S. market share of plug-in electric passenger cars increased from 0.14% in 2011 through 0.37% in 2012 to 0.62% of new car sales during 2013.[6][7]
As of December 2014, there are 23 highway legal plug-in cars available in the American market from 12 car manufacturers,[8][9] plus several models of electric motorcycles, utility vans and neighborhood electric vehicles (NEVs). As of November 2014, cumulative sales are led by the Chevrolet Volt plug-in hybrid with 71,867 units, followed by the Nissan Leaf all-electric car with 69,220 units.[1] Ranking next are the Toyota Prius Plug-in Hybrid with 37,610 units,[10][11][12] and the all-electric Tesla Model S with over 34,350 units.[12][13][14][15]
The Energy Improvement and Extension Act of 2008 granted tax credits for new qualified plug-in electric vehicles.[16] The American Recovery and Reinvestment Act of 2009 (ARRA) also authorized federal tax credits for converted plug-ins.[17] The federal tax credit for new plug-in electric vehicles (PEVs) is worth between US$2,500 and US$7,500 depending on battery capacity.[16] As of November 2014, a total of 37 states and Washington, D.C. have established incentives and tax or fee exemptions for BEVs and PHEVs, or utility-rate breaks, and other non-monetary incentives such as free parking and high-occupancy vehicle lane access.[18] The U.S. government also has pledged US$2.4 billion in federal grants to support the development of next-generation electric cars and batteries, and US$115 million for the installation of electric vehicle charging infrastructure in 16 different metropolitan areas around the country. As of March 2013, the United States had 5,678 charging stations across the country, led by California with 1,207 stations (21.3%).[19] In terms of public charging points, there were 19,472 public outlets available across the country by the end of December 2013, again led by California with 5,176 (26.6%) public charging points.[20]
In his 2011 State of the Union address, President Barack Obama set the goal for the U.S. to become the first country to have 1 million electric vehicles on the road by 2015.[21] Considering the actual slow rate of PEV sales, since mid-2012 several industry observers have concluded that this goal is unattainable.[22][23][24] The Governor of California, Jerry Brown, issued an executive order in March 2012 that established the goal of getting 1.5 million zero-emission vehicles (ZEVs) on California roads by 2015.[25][26] In September 2014, the Charge Ahead California Initiative set the additional goal to have at least 1 million zero-emission vehicles and near-zero-emission vehicles in California by January 1, 2023.[27]
Government support
In his 2011 State of the Union address, President Barack Obama set the goal for the U.S. to become the first country to have 1 million electric vehicles on the road by 2015.[21] This goal was established based on forecasts made by the U.S. Department of Energy (DoE), using production capacity of PEV models announced to enter the U.S. market through 2015. The DoE estimated a cumulative production of 1,222,200 PEVS by 2015, and was based on manufacturer announcements and media reports accounting production goals for the Fisker Karma, Fisker Nina, Ford Transit Connect, Ford Focus Electric, Chevrolet Volt, Nissan Leaf, Smith Newton, Tesla Roadster, Tesla Model S and Th!nk City.[28] Considering that actual PEV sales have been lower than initially expected, as of early 2013, several industry observers have concluded that this goal is unattainable.[22][23][29] According to a July 2012 study by Pike Research, cumulative sales will reach the 1 million goal set by the Obama Administration only in 2018.[30]
American Recovery and Reinvestment Act
President Barack Obama pledged US$2.4 billion in federal grants to support the development of next-generation electric vehicles and batteries.[31][32] $1.5 billion in grants to U.S. based manufacturers to produce highly efficient batteries and their components; up to $500 million in grants to U.S. based manufacturers to produce other components needed for electric vehicles, such as electric motors and other components; and up to $400 million to demonstrate and evaluate plug-in hybrids and other electric infrastructure concepts—like truck stop charging station, electric rail, and training for technicians to build and repair electric vehicles (greencollar jobs).[33]

In March 2009, as part of the American Recovery and Reinvestment Act, the U.S. Department of Energy announced the release of two competitive solicitations for up to $2 billion in federal funding for competitively awarded cost-shared agreements for manufacturing of advanced batteries and related drive components as well as up to $400 million for transportation electrification demonstration and deployment projects. This initiative aimed to help meet President Barack Obama's goal of putting one million plug-in electric vehicles on the road by 2015.[21][34]
In 2008, San Francisco Mayor Gavin Newsom, San Jose Mayor Chuck Reed and Oakland Mayor Ron Dellums announced a nine-step policy plan for transforming the Bay Area into the "Electric Vehicle (EV) Capital of the U.S.".[35] Other local and state governments have also expressed interest in electric cars.[36]
A 2013 study published in the journal Energy Policy explored the relative benefits of a vehicle-charging network and plug-in hybrid vehicles with larger batteries. Across the battery-capacity and charging-infrastructure scenarios examined, the lowest-cost solution is for more drivers to switch to traditional hybrid electrics or low-capacity plug-in hybrid electric vehicles (PHEVs). Installing charging infrastructure would provide lower gasoline savings per dollar spent than paying for increased PHEV battery capacity. In addition, the study determined that current federal subsidies are "not aligned with the goal of decreased gasoline consumption in a consistent and efficient manner."[37][38]
Tax credits
New plug-in electric vehicles

- Federal incentives
First the Energy Improvement and Extension Act of 2008, and later the American Clean Energy and Security Act of 2009 (ACES) granted tax credits for new qualified plug-in electric drive motor vehicles.[16] The American Recovery and Reinvestment Act of 2009 (ARRA) also authorized federal tax credits for converted plug-ins, though the credit is lower than for new PEVs.[17]
As defined by the 2009 ACES Act, a PEV is a vehicle which draws propulsion energy from a traction battery with at least 5 kwh of capacity and uses an offboard source of energy to recharge such battery.[16] The tax credit for new plug-in electric vehicles is worth US$2,500 plus US$417 for each kilowatt-hour of battery capacity over 5 kwh, and the portion of the credit determined by battery capacity cannot exceed US$5,000. Therefore, the total amount of the credit allowed for a new PEV is US$7,500.[16]
The new qualified plug-in electric vehicle credit phases out for a PEV manufacturer over the one-year period beginning with the second calendar quarter after the calendar quarter in which at least 200,000 qualifying vehicles from that manufacturer have been sold for use in the United States. For this purpose cumulative sales are accounted after December 31, 2009. Qualifying PEVs are eligible for 50% of the credit if acquired in the first two quarters of the phase-out period, and 25% of the credit if bought in the third or fourth quarter of the phase-out period.[16] Both the Nissan Leaf electric vehicle and the Chevrolet Volt plug-in hybrid, launched in December 2010, are eligible for the maximum $7,500 tax credit.[39] The Toyota Prius Plug-in Hybrid, released in January 2012, is eligible for a US$2,500 tax credit due to its smaller battery capacity of 5.2 kWh.[40]
- State incentives
As of November 2014, a total of 37 states and Washington, D.C. have established incentives and tax or fee exemptions for BEVs and PHEVs, or utility-rate breaks, and other non-monetary incentives such as free parking and high-occupancy vehicle lane access regardless of the number of occupants.[18] In California, for example, the Clean Vehicle Rebate Project (CVRP) was established to promote the production and use of zero-emission vehicles (ZEVs). Eligible vehicles include only new Air Resources Board-certified or approved zero-emission or plug-in hybrid electric vehicles.[41] Among the eligible vehicles are neighborhood electric vehicles, battery electric, plug-in hybrid electric, and fuel cell vehicles including cars, trucks, medium- and heavy-duty commercial vehicles, and zero-emission motorcycles. Vehicles must be purchased or leased on or after March 15, 2010. Rebates initially of up to US$5,000 per light-duty vehicle, and later lowered to up to US$2,500, are available for individuals and business owners who purchase or lease new eligible vehicles. Certain zero-emission commercial vehicles are also eligible for rebates up to US$20,000.[42][43][44]

- New proposals
Several separate initiatives have been pursued unsuccessfully at the federal level since 2011 to transform the tax credit into an instant cash rebate. The objective of these initiatives is to make new qualifying plug-in electric cars more accessible to buyers by making the incentive more effective. The rebate would be available at the point of sale allowing consumers to avoid a wait of up to a year to apply the tax credit against income tax returns.[45][46][47]
In March 2014 the Obama Administration included a provision in the FY 2015 Budget to increase the maximum tax credit for plug-in electric vehicles and other advanced vehicles to US$10,000, over the current US$7,500. However, the new maximum tax credit would not apply to luxury vehicles with a sales price of over US$45,000, such as the Tesla Model S and the Cadillac ELR, which would be capped at US$7,500. According to the Treasury Department, the proposal intends to transform the existing tax credit into a rebate available at the point of sale that will be claimable by dealers and passed along to the consumers. The proposal also seeks to remove the 200,000 vehicle cap per manufacturer after which the credit phases out over a year. Instead, the incentives would begin to phase out starting in 2019 for all manufacturers, and the credit would be completely phased out by 2022, and fall to 75% of the current credit starting in 2019.[48] Despite President Barack Obama's unsuccessful attempts to raise the tax credit to US$10,000 in his previous three annual budgets,[49] the proposal was included again in the FY 2016 Budget.[50]
Charging equipment
Until 2010 there was a federal tax credit equal to 50% of the cost to buy and install a home-based charging station with a maximum credit of US$2,000 for each station. Businesses qualified for tax credits up to US$50,000 for larger installations.[39][51] These credits expired on December 31, 2010, but were extended through 2013 with a reduced tax credit equal to 30% with a maximum credit of up to US$1,000 for each station for individuals and up to US$30,000 for commercial buyers.[52][53]
EV Everywhere Challenge
On March 7, 2012, President Barack Obama launched the EV Everywhere Challenge as part of the U.S. Department of Energy’s Clean Energy Grand Challenges, which seeks to solve some of the U.S. biggest energy challenges and make clean energy technologies affordable and accessible to the vast majority of American households and businesses. The EV Everywhere Challenge has the goal of advancing electric vehicle technologies to have the country, by 2022, to produce a five-passenger electric vehicle that would provide both a payback time of less than five years and the ability to be recharged quickly enough to provide enough range for the typical American driver.[54][55]
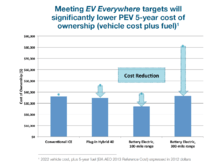
In January 2013 the Department of Energy (DoE) published the "EV Everywhere Grand Challenge Blueprint," which set the technical targets of the PEV program to fall into four areas: battery research and development; electric drive system research and development; vehicle lightweighting; and advanced climate control technologies. The DoE set several specific goals, established in consultation with stakeholders through a series of workshops held during the second half of 2012.[56] The key goals to be met over the next five years to make plug-in electric vehicles competitive with conventional fossil fuel vehicles are:
- Cutting battery costs from their current US$500/kWh to US$125/kWh
- Eliminating almost 30% of vehicle weight through lightweighting
- Reducing the cost of electric drive systems from US$30/kW to US$8/kW
Achieving these goals in the next five years will result in an automotive propulsion battery with five-times the present range capacity, costing one-fifth present lithium-ion batteries. The DoE aim is to level the purchase plus operating (fuel) cost of an all-electric vehicle with a 280 mi (450 km) range with the costs of an internal combustion engine (ICE) vehicle of similar size. The DoE expects than even before the latter goals are met, the 5-year cost of ownership of most plug-in hybrid electric vehicles and of all-electric vehicles with shorter ranges, such as 100 mi (160 km), will be comparable to the same cost of ICE vehicles of similar size.[56][57]

In order to achieve these goals, the DoE is providing up to US$120 million over the next five years to fund the new Joint Center for Energy Storage Research (JCESR), a research center led by the Argonne National Laboratory in Chicago. JCESR is a consortium of five DOE national labs, five universities, and four private-sector enterprises, and it is being likened to the Manhattan Project of battery technology.[57][58]
An initial progress report for the initiative was released in January 2014. Four key successes of the first year of the initiative were reported:[59]
- DOE research and development reduced the cost of electric drive vehicle batteries to US$325/ kWhr, 50% lower than 2010 costs.
- In the first year of the Workplace Charging Challenge, more than 50 U.S. employers joined the Challenge and pledged to provide charging access at more than 150 sites.
- DOE investments in EV Everywhere technology topped US$225 million in 2013, addressing key barriers to achieving the Grand Challenge.
- Consumer acceptance of electric vehicles grew: 97,000 plug-in electric vehicles were sold in 2013, nearly doubling 2012 sales.
- Workplace Charging Challenge
In January 2013, during the Washington Auto Show, Secretary of Energy Steven Chu announced an initiative to expand the EV Everywhere program with the “Workplace Charging Challenge.” This initiative is a plan to install more electric vehicle charging stations in workplace parking lots. There are 21 founding partners and ambassadors for the program, including Ford, Chrysler, General Motors, Nissan, Tesla Motors, 3M, Google, Verizon, Duke Energy, General Electric, San Diego Gas & Electric, Siemens, Plug In America, and the Rocky Mountain Institute. The initiative's target is to increase the number of U.S. employers offering workplace charging by tenfold in the next five years. Initially, the DoE will not provide funding for this initiative.[60][61]
U.S. military
.jpg)
The U.S. Army announced in 2009 that it will lease 4,000 Neighborhood Electric Vehicles (NEVs) within three years. The Army plans to use NEVs at its bases for transporting people around the base, as well as for security patrols and maintenance and delivery services. The Army accepted its first six NEVs at Virginia's Fort Myer in March 2009 and will lease a total of 600 NEVs through the rest of the year, followed by the leasing of 1,600 NEVs for each of the following two years. With a full eight-hour recharge, the NEVs can travel 30 miles (48 km) at a top speed of 25 mph (40 km/h).[62]

U.S. Air Force officials announced, in August 2011, a plan to establish Los Angeles Air Force Base, California, as the first federal facility to replace 100% of its general purpose fleet with plug-in electric vehicles. As part of the program, all Air Force-owned and -leased general purpose fleet vehicles on the base will be replaced with PEVs. There are approximately 40 eligible vehicles, ranging from passenger sedans to two-ton trucks and shuttle buses. The replacement PEVs include all-electric, plug-in hybrids, and extended-range electric vehicles. The initiative would not include force protection, tactical and emergency response vehicles. The program is also subject to environmental review. Electrification of Los Angeles AFB's general purpose fleet is the first step in a Department of Defense effort to establish strategies for large-scale integration of PEVs.[63]
By May 2013, it was announced that, as part of a test program created in January 2013, 500 plug-in electric vehicles with vehicle-to-ground (V2G) technology would be in use at six military bases, purchased using an investment of $20 million. If the program succeeds, there will be 3,000 V2G vehicles in 30 bases.[64]
International cooperation
Building on the first-ever U.S.-China Electric Vehicle Forum in September 2009, US and China unveiled the U.S.-China Electric Vehicles Initiative, which will include developing joint standards, building demonstration projects in more than a dozen cities, creating technical roadmaps, and carrying out public education projects. Both nations said they share an interest in accelerating the deployment of electric vehicles in order to reduce oil dependence, cut greenhouse gas emissions, and promote economic growth.[65]
Operating costs and fuel economy
The following table shows the U.S. Environmental Protection Agency (EPA) official ratings for fuel economy (miles per gallon gasoline equivalent) and EPA's estimated out-of-pocket fuel costs for all plug-in electric passenger vehicles rated by EPA in the United States since 2010 up to December 2014.[66]
| Fuel efficiency and out-of-pocket fuel costs for all passenger PEVs rated by EPA between 2010 and December 2014(1) (Fuel economy and operating costs as displayed in the Monroney label and the fueleconomy.gov website for model years 2011 through 2015) | ||||||||
|---|---|---|---|---|---|---|---|---|
| Vehicle | Model year | Operating mode (AER) | EPA fuel economy ratings | Cost to drive 25 miles | Annual Fuel Cost(2) (15,000 mi) | Notes | ||
| Combined | City | Highway | ||||||
| BMW i3[66][67] | 2014 | All-electric (81 mi) | 124 mpg-e (27 kW-hrs/100 mi) | 137 mpg-e (25 kW-hrs/100 mi) | 111 mpg-e (30 kW-hrs/100 mi) | $0.81 | $500 | The 2014 BMW i3 is the most fuel efficient EPA-certified vehicle of all fuel types considered in all years.[68] |
| Scion iQ EV[69] | 2013 | All-electric (38 mi) | 121 mpg-e (28 kW-hrs/100 mi) | 138 mpg-e (24 kW-hrs/100 mi) | 105 mpg-e (32 kW-hrs/100 mi) | $0.84 | $500 | The iQ EV is only available in limited numbers for special fleet use, such as carsharing programs.[70][71][72] |
| Chevrolet Spark EV[73] | 2014 | All-electric (82 mi) | 119 mpg-e (28 kW-hrs/100 mi) | 121 mpg-e (28 kW-hrs/100 mi) | 138 mpg-e (24 kW-hrs/100 mi) | $0.84 | $500 | |
| Honda Fit EV[74] | 2013/14 | All-electric (82 mi) | 118 mpg-e (29 kW-hrs/100 mi) | 132 mpg-e (26 kW-hrs/100 mi) | 105 mpg-e (32 kW-hrs/100 mi) | $0.87 | $500 | |
| BMW i3 REx[66][67] | 2014 | Electricity only (72 mi) | 117 mpg-e (29 kW-hrs/100 mi) | 97 mpg-e | 79 mpg-e | $0.87 | $700 | The EPA classifies the i3 REx as a series plug-in hybrid while CARB as a range-extended battery-electric vehicle (BEVx).[67][75][76] The 2014 i3 REx is the most fuel efficient EPA-certified current year vehicle with a gasoline engine with a combined EV/gasoline rating of 88 mpg-e (city 97 mpg-e/hwy 79 mpg-e).[68][77] |
| Gasoline only (78 mi) | 39 mpg | 41 mpg | 37 mpg | $2.44 | ||||
| Volkswagen e-Golf[78] | 2015 | All-electric (83 mi) | 116 mpg-e (29 kW-hrs/100 mi) | 126 mpg-e | 105 mpg-e | $0.88 | $550 | |
| Fiat 500e[79] | 2013/14 | All-electric (87 mi) | 116 mpg-e (29 kW-hrs/100 mi) | 122 mpg-e (28 kW-hrs/100 mi) | 108 mpg-e (31 kW-hrs/100 mi) | $0.88 | $550 | |
| Nissan Leaf[80] | 2013 | All-electric (75 mi) | 115 mpg-e (29 kW-hrs/100 mi) | 129 mpg-e | 102 mpg-e | $0.87 | $500 | |
| Nissan Leaf[80] | 2014/15 | All-electric (84 mi) | 114 mpg-e (30 kW-hrs/100 mi) | 126 mpg-e (27 kW-hrs/100 mi) | 101 mpg-e (33 kW-hrs/100 mi) | $0.89 | $550 | |
| Honda Accord PHEV[81] | 2014 | Electricity and gasoline (13 mi) | 115mpg-e (29 kW-hrs/100 mi) | - | - | $1.36 | $950 | The 2014 Accord is the most fuel efficient plug-in hybrid in blended electric/hybrid mode with a combined rating of 115 mpg-e. After the first 13 mi the car functions like a regular hybrid. Depending on driving style, the car may use both gasoline and electricity during the first 13 mi.[66] The Accord has a rating for combined EV/hybrid operation of 57 mpg-e.[82] |
| Gasoline only | 46 mpg | 47 mpg | 46 mpg | |||||
| Mitsubishi i[83] | 2012/13/14 | All-electric (62 mi) | 112 mpg-e (30 kW-hrs/100 mi) | 126 mpg-e (27 kW-hrs/100 mi) | 99 mpg-e (34 kW-hrs/100 mi) | $0.90 | $550 | |
| Smart electric drive[84] | 2013/14 | All-electric (68 mi) | 107 mpg-e (32 kW-hrs/100 mi) | 122 mpg-e (28 kW-hrs/100 mi) | 93 mpg-e (36 kW-hrs/100 mi) | $0.96 | $600 | Third generation model. Ratings are costs for both convertible and coupe models. |
| Kia Soul EV[85] | 2015 | All-electric (93 mi) | 105 mpg-e (32 kW-hrs/100 mi) | 120 mpg-e | 92 mpg-e | $0.96 | $600 | The Soul EV has the largest all-electric range in city driving of its class, with 104 mi (167 km).[86] |
| Ford Focus Electric[87] | 2012/13/14 | All-electric (76 mi) | 105 mpg-e (32 kW-hrs/100 mi) | 110 mpg-e (31 kW-hrs/100 mi) | 99 mpg-e (34 kW-hrs/100 mi) | $0.96 | $600 | |
| BMW ActiveE[88] | 2011 | All-electric (94 mi) | 102 mpg-e (33 kW-hrs/100 mi) | 107 mpg-e | 96 mpg-e | $0.99 | $600 | |
| Nissan Leaf[89] | 2011/12 | All-electric (73 mi) | 99 mpg-e (34 kW-hrs/100 mi) | 106 mpg-e (32 kW-hrs/100 mi) | 92 mpg-e (37 kW-hrs/100 mi) | $1.02 | $600 | |
| Chevrolet Volt[90] | 2013/14 | Electricity only (38 mi) | 98 mpg-e (35 kW-hrs/100 mi) | - | - | $1.05 | $900 | The 2013/14 Volt has a combined EV/gasoline rating of 62 mpg-e (city 63 mpg-e/hwy 61 mpg-e).[77] |
| Gasoline only | 37 mpg | 35 mpg | 40 mpg | $2.57 | ||||
| Tesla Model S[66][91] | 2013/14 | All-electric (208 mi) | 95 mpg-e (35 kW-hrs/100 mi) | 94 mpg-e (36 kW-hrs/100 mi) | 97 mpg-e (35 kW-hrs/100 mi) | $1.05 | $650 | Model with 60 kWh battery pack |
| Toyota Prius PHV[92] | 2012/13/14 | Electricity and gasoline (11 mi) | 95 mpg-e (29 kW-hrs/100 mi plus 0.2 gallons/100 mi) | - | - | $1.43 | $900 | After the first 11 mi the car functions like a regular Prius hybrid The 2012/14 Prius has a rating for combined EV/hybrid operation of 58 mpg-e (city 59 mpg-e/hwy 56 mpg-e).[77] |
| Gasoline only | 50 mpg | 51 mpg | 49 mpg | $1.74 | ||||
| Chevrolet Volt[93] | 2011/12 | Electricity only (35 mi) | 94 mpg-e (36 kW-hrs/100 mi) | 95 mpg-e (36 kW-hrs/100 mi) | 93 mpg-e (37 kW-hrs/100 mi) | $1.08 | $1,000 | Both model year 2011 and 2012 have the same operating costs, but the 2011 Volt has a rating of 93 mpg-e for combined driving in all-electric mode. |
| Gasoline only | 37 mpg | 35 mpg | 40 mpg | $2.57 | ||||
| Tesla Model S[94] | 2013 | All-electric (139 mi) | 94 mpg-e (36 kW-hrs/100 mi) | 93 mpg-e | 96 mpg-e | $1.08 | $650 | Model with 40 kWh battery pack. This model was officially rated by the EPA but Tesla canceled its production due to lack of demand.[95] |
| Tesla Model S[91] | 2012/13/14 | All-electric (265 mi) | 89 mpg-e (38 kW-hrs/100 mi) | 88 mpg-e (38 kW-hrs/100 mi) | 90 mpg-e (37 kW-hrs/100 mi) | $1.14 | $700 | Model with 85kWh battery pack |
| Ford C-Max Energi[96][97] Ford Fusion Energi[96][97] | 2013/14 | Electricity and gasoline (20 mi) | 88 mpg-e (37 kW-hrs/100 mi) | 95 mpg-e | 81 mpg-e | $1.36 | $1,050 | The Energi did not use any gasoline for the first 20 mi in EPA tests, but depending on the driving style, the car may use both gasoline and electricity during EV mode. The Energi models have a combined EV/hybrid operation rating of 51 mpg-e (city 55 mpg-e/hwy 46 mpg-e).[77] |
| Gasoline only | 38 mpg | 40 mpg | 36 mpg | $2.29 | ||||
| Smart electric drive[84] | 2011 | All-electric (63 mi) | 87 mpg-e (39 kW-hrs/100 mi) | 94 mpg-e | 79 mpg-e | $1.17 | $700 | Second generation model. Ratings are costs for both cabriolet and coupe models. |
| Mercedes-Benz B-Class Electric Drive[66][98] | 2014 | All-electric (87 mi) | 84 mpg-e (40 kW-hrs/100 mi) | 85 mpg-e (40 kW-hrs/100 mi) | 83 mpg-e (41 kW-hrs/100 mi) | $1.20 | $700 | |
| Cadillac ELR[99] | 2014 | Electricity only (37 mi) | 82 mpg-e (41 kW-hrs/100 mi) | - | - | $1.23 | $1,100 | The 2014 ELR has a combined EV/gasoline rating of 54 mpg-e (city 54 mpg-e/hwy 55 mpg-e).[77] |
| Gasoline only | 33 mpg | 31 mpg | 35 mpg | $2.89 | ||||
| Toyota RAV4 EV[66][100] | 2012 | All-electric (103 mi) | 76 mpg-e (44 kW-hrs/100 mi) | 78 mpg-e (43 kW-hrs/100 mi) | 74 mpg-e (46 kW-hrs/100 mi) | $1.32 | $800 | |
| BMW i8[66][101] | 2014 | Electricity and gasoline (15 mi) | 76 mpg-e (43 kW-hrs/100 mi) | - | - | $2.19 | $1,550 | The i8 does not run on 100% electricity as it consumes 0.1 gallons per 100 mi in EV mode (all-electric range = 0 mi) The i8 has a rating for combined EV/hybrid operation of 37 mpg-e.[82] |
| Gasoline only | 28 mpg | 28 mpg | 29 mpg | $3.40 | ||||
| Coda[102] | 2012/13 | All-electric (88 mi) | 73 mpg-e (46 kW-hrs/100 mi) | 77 mpg-e (44 kW-hrs/100 mi) | 68 mpg-e (50 kW-hrs/100 mi) | $1.38 | $850 | |
| Porsche 918 Spyder[103] | 2015 | Electricity only (12 mi) | 67 mpg-e (50 kW-hrs/100 mi) | - | - | $1.50 | $2,100 | |
| Gasoline only | 22 mpg | - | - | $4.33 | ||||
| BYD e6[104] | 2012 | All-electric (122 mi) | 62 mpg-e (54 kW-hrs/100 mi) | 60 mpg-e (56 kW-hrs/100 mi) | 64 mpg-e (52 kW-hrs/100 mi) | $1.62 | $950 | |
| Fisker Karma[105] | 2012 | Electricity only (33 mi) | 54 mpg-e (62 kW-hrs/100 mi) | - | - | $1.86 | $1,750 | |
| Gasoline only | 20 mpg | 20 mpg | 21 mpg | $4.76 | ||||
| Porsche Panamera S E-Hybrid[106] | 2014 | Electricity and gasoline (16 mi) | 50 mpg-e (52 kWh/100 mi) | - | - | $3.49 | $1,850 | The all-electric range is between 0 to 15 mi.[106] The S E-Hybrid has a rating for combined EV/hybrid operation of 31 mpg-e.[82] |
| Gasoline only | 25 mpg | 23 mpg | 29 mpg | $3.81 | ||||
| Porsche Cayenne S E-Hybrid[107] | 2015 | Electricity and gasoline (14 mi) | 47 mpg-e (69 kWh/100 mi) | - | - | $2.07 | $2,100 | |
| Gasoline only | 22 mpg | - | - | $4.33 | ||||
| McLaren P1[66][108] | 2014 | Electricity and gasoline (19 mi) | 18 mpg-e (25 kWh/100 mi) | - | - | $5.38 | $3,200 | The P1 does not run on 100% electricity as it consumes 4.8 gallons per 100 mi in EV mode (all-electric range = 0 mi)[108] The P1 has a rating for combined EV/hybrid operation of 17 mpg-e.[82] |
| Gasoline only | 17 mpg | 16 mpg | 20 mpg | $5.60 | ||||
| Notes: (1) In November 2010, EPA introduced MPGe as comparison metric on its new sticker for fuel economy for the Nissan Leaf and the Chevrolet Volt.[109][110] Before, the EPA rating for on board energy efficiency for electric vehicles was expressed as kilowatt-hour per 100 miles.[111][112] The window sticker of the 2009 Mini E showed an energy consumption of 33 kW-hrs/100 mi in the city and 36 kW-hrs/100 mi on the highway (equivalent to 102 mpg city and 94 mpg on the highway).[111] The 2009 Tesla Roadster was rated 32 kW-hrs/100 mi in city and 33 kW-hrs/100 mi on the highway (equivalent to 105 mpg city and 102 mpg highway).[113]
(2) Based on 45% highway and 55% city driving. Values rounded to the nearest $50. Electricity cost of US$0.12/kw-hr, premium gasoline price of US$3.81 per gallon (used by the Volt, Karma, BMW i3 REx, McLaren P1 and all Porsche models), and regular gasoline price of US$3.48 per gallon (as of 12 March 2014). Conversion 1 gallon of gasoline=33.7 kW-hr. | ||||||||
Air pollution and greenhouse gas emissions
Electric cars, as well as plug-in hybrids operating in all-electric mode, emit no harmful tailpipe pollutants from the onboard source of power, such as particulates (soot), volatile organic compounds, hydrocarbons, carbon monoxide, ozone, lead, and various oxides of nitrogen. The clean air benefit is usually local because, depending on the source of the electricity used to recharge the batteries, air pollutant emissions are shifted to the location of the generation plants.[114] In a similar manner, plug-in electric vehicles operating in all-electric mode do not emit greenhouse gases from the onboard source of power, but from the point of view of a well-to-wheel assessment, the extent of the benefit also depends on the fuel and technology used for electricity generation. From the perspective of a full life cycle analysis, the electricity used to recharge the batteries must be generated from renewable or clean sources such as wind, solar, hydroelectric, or nuclear power for PEVs to have almost none or zero well-to-wheel emissions.[114][115]
EPA estimates
_row_retouched.jpg)
The following table compares tailpipe and upstream CO2 emissions estimated by the U.S. Environmental Protection Agency for all series production model year 2014 plug-in electric vehicles available in the U.S. market. Total emissions include the emissions associated with the production and distribution of electricity used to charge the vehicle, and for plug-in hybrid electric vehicles, it also includes emissions associated with tailpipe emissions produced from the internal combustion engine. These figures were published by the EPA in October 2014 in its annual report "Light-Duty Automotive Technology, Carbon Dioxide Emissions, and Fuel Economy Trends." All emissions are estimated considering average real world city and highway operation based on the EPA 5-cycle label methodology, using a weighted 55% city and 45% highway driving.[82]
For purposes of an accurate estimation of emissions, the analysis took into consideration the differences in operation between plug-in hybrids. Some, like the Chevrolet Volt, can operate in all-electric mode without using gasoline, and others operate in a blended mode like the Toyota Prius PHV, which uses both energy stored in the battery and energy from the gasoline tank to propel the vehicle, but that can deliver substantial all-electric driving in blended mode. In addition, since the all-electric range of plug-in hybrids depends on the size of the battery pack, the analysis introduced a utility factor as a projection of the share of miles that will be driven using electricity by an average driver, for both, electric only and blended EV modes. Since all-electric cars do not produce tailpipe emissions, the utility factor applies only to plug-in hybrids. The following table shows the overall fuel economy expressed in terms of miles per gallon gasoline equivalent (mpg-e) and the utility factor for the ten MY2014 plug-in hybrids available in the U.S. market, and EPA's best estimate of the CO2 tailpipe emissions produced by these PHEVs.[82]
In order to account for the upstream CO2 emissions associated with the production and distribution of electricity, and since electricity production in the United States varies significantly from region to region, the EPA considered three scenarios/ranges with the low end scenario corresponding to the California powerplant emissions factor, the middle of the range represented by the national average powerplant emissions factor, and the upper end of the range corresponding to the powerplant emissions factor for the Rocky Mountains. The EPA estimates that the electricity GHG emission factors for various regions of the country vary from 346 g CO2/kWh in California to 986 g CO2/kWh in the Rockies, with a national average of 648 g CO2/kWh.[82]
| Comparison of tailpipe and upstream CO2 emissions(1) estimated by EPA for the MY 2014 plug-in electric vehicles available in the U.S. market[82] | ||||||
|---|---|---|---|---|---|---|
| Vehicle | Overall fuel economy (mpg-e) | Utility factor(2) (share EV miles) | Tailpipe CO2 (g/mi) | Tailpipe + Total Upstream CO2 | ||
| Low (g/mi) | Avg (g/mi) | High (g/mi) | ||||
| BMW i3 | 124 | 1 | 0 | 93 | 175 | 266 |
| Chevrolet Spark EV | 119 | 1 | 0 | 97 | 181 | 276 |
| Honda Fit EV | 118 | 1 | 0 | 99 | 185 | 281 |
| Fiat 500e | 116 | 1 | 0 | 101 | 189 | 288 |
| Nissan Leaf | 114 | 1 | 0 | 104 | 194 | 296 |
| Mitsubishi i | 112 | 1 | 0 | 104 | 195 | 296 |
| Smart electric drive | 107 | 1 | 0 | 109 | 204 | 311 |
| Ford Focus Electric | 105 | 1 | 0 | 111 | 208 | 316 |
| Tesla Model S (60 kWh) | 95 | 1 | 0 | 122 | 229 | 348 |
| Tesla Model S (85 kWh) | 89 | 1 | 0 | 131 | 246 | 374 |
| BMW i3 REx(3) | 88 | 0.83 | 40 | 134 | 207 | 288 |
| Mercedes-Benz B-Class ED | 84 | 1 | 0 | 138 | 259 | 394 |
| Toyota RAV4 EV | 76 | 1 | 0 | 153 | 287 | 436 |
| BYD e6 | 63 | 1 | 0 | 187 | 350 | 532 |
| Chevrolet Volt | 62 | 0.66 | 81 | 180 | 249 | 326 |
| Toyota Prius Plug-in Hybrid | 58 | 0.29 | 133 | 195 | 221 | 249 |
| Honda Accord Plug-in Hybrid | 57 | 0.33 | 130 | 196 | 225 | 257 |
| Cadillac ELR | 54 | 0.65 | 91 | 206 | 286 | 377 |
| Ford C-Max Energi | 51 | 0.45 | 129 | 219 | 269 | 326 |
| Ford Fusion Energi | 51 | 0.45 | 129 | 219 | 269 | 326 |
| BMW i8 | 37 | 0.37 | 198 | 303 | 351 | 404 |
| Porsche Panamera S E-Hybrid | 31 | 0.39 | 206 | 328 | 389 | 457 |
| McLaren P1 | 17 | 0.43 | 463 | 617 | 650 | 687 |
| Average gasoline car | 24.2 | 0 | 367 | 400 | 400 | 400 |
| Notes: (1) Based on 45% highway and 55% city driving. (2) The utility factor represents, on average, the percentage of miles that will be driven using electricity (in electric only and blended modes) by an average driver. (3) The EPA classifies the i3 REx as a series plug-in hybrid[66][82] | ||||||
Union of Concerned Scientists
The Union of Concerned Scientists (UCS) published a study in 2012 that assessed average greenhouse gas emissions in the U.S. resulting from charging plug-in car batteries from the perspective of the full life-cycle (well-to-wheel analysis) and according to fuel and technology used to generate electric power by region. The study used the Nissan Leaf all-electric car to establish the analysis baseline, and electric-utility emissions are based on EPA's 2009 estimates. The UCS study expressed the results in terms of miles per gallon instead of the conventional unit of grams of greenhouse gases or carbon dioxide equivalent emissions per year in order to make the results more friendly for consumers. The study found that in areas where electricity is generated from natural gas, nuclear, hydroelectric or renewable sources, the potential of plug-in electric cars to reduce greenhouse emissions is significant. On the other hand, in regions where a high proportion of power is generated from coal, hybrid electric cars produce less CO2-e equivalent emissions than plug-in electric cars, and the best fuel efficient gasoline-powered subcompact car produces slightly less emissions than a PEV. In the worst-case scenario, the study estimated that for a region where all energy is generated from coal, a plug-in electric car would emit greenhouse gas emissions equivalent to a gasoline car rated at a combined city/highway driving fuel economy of 30 mpg-US (7.8 L/100 km; 36 mpg-imp). In contrast, in a region that is completely reliant on natural gas, the PEV would be equivalent to a gasoline-powered car rated at 50 mpg-US (4.7 L/100 km; 60 mpg-imp).[116][117]
The study concluded that for 45% of the U.S. population, a plug-in electric car will generate lower CO2 equivalent emissions than a gasoline-powered car capable of combined 50 mpg-US (4.7 L/100 km; 60 mpg-imp), such as the Toyota Prius and the Prius c. The study also found that for 37% of the population, the electric car emissions will fall in the range of a gasoline-powered car rated at a combined fuel economy of 41 to 50 mpg-US (5.7 to 4.7 L/100 km; 49 to 60 mpg-imp), such as the Honda Civic Hybrid and the Lexus CT200h. Only 18% of the population lives in areas where the power-supply is more dependent on burning carbon, and the greenhouse gas emissions will be equivalent to a car rated at a combined fuel economy of 31 to 40 mpg-US (7.6 to 5.9 L/100 km; 37 to 48 mpg-imp), such as the Chevrolet Cruze and Ford Focus.[117][118][119] The study found that there are no regions in the U.S. where plug-in electric cars will have higher greenhouse gas emissions than the average new compact gasoline engine automobile, and the area with the dirtiest power supply produces CO2 emissions equivalent to a gasoline-powered car rated at 33 mpg-US (7.1 L/100 km).[116]
The following table shows a representative sample of cities within each of the three categories of emissions intensity used in the UCS study, showing the corresponding miles per gallon equivalent for each city as compared to the greenhouse gas emissions of a gasoline-powered car:
| Regional comparison of full life cycle assessment of greenhouse gas emissions resulting from charging plug-in electric vehicles expressed in terms of miles per gallon of a gasoline-powered car with equivalent emissions[116][118][119] | |||||
|---|---|---|---|---|---|
| Rating scale by emissions intensity expressed as miles per gallon | City | PEV well-to-wheels carbon dioxide equivalent (CO2-e) emissions per year expressed as mpg US | Percent reduction in CO2-e emissions compared with 27 mpg US average new compact car | Combined EPA's rated fuel economy and GHG emissions for reference gasoline-powered car[120] | |
| Best LowestCO2-e emissions equivalent to over 50 mpg-US (4.7 L/100 km) | Juneau, Alaska | 112 mpg-US (2.10 L/100 km) | 315% | 2012 Toyota Prius/Prius c 50 mpg-US (4.7 L/100 km) | |
| San Francisco | 79 mpg-US (3.0 L/100 km) | 193% | |||
| New York City | 74 mpg-US (3.2 L/100 km) | 174% | |||
| Portland, Oregon | 73 mpg-US (3.2 L/100 km) | 170% | Greenhouse gas emissions (grams/mile) | ||
| Boston | 67 mpg-US (3.5 L/100 km) | 148% | Tailpipe CO2 | Upstream GHG | |
| Washington, D.C. | 58 mpg-US (4.1 L/100 km) | 115% | 178 g/mi (111 g/km) | 44 g/mi (27 g/km) | |
| Better Moderate CO2-e emissions equivalent to between 41 mpg-US (5.7 L/100 km) to 50 mpg-US (4.7 L/100 km) | Phoenix, Arizona | 48 mpg-US (4.9 L/100 km) | 78% | 2012 Honda Civic Hybrid 44 mpg-US (5.3 L/100 km) | |
| Miami | 47 mpg-US (5.0 L/100 km) | 74% | |||
| Houston | 46 mpg-US (5.1 L/100 km) | 70% | Greenhouse gas emissions (grams/mile) | ||
| Columbus, Ohio | 41 mpg-US (5.7 L/100 km) | 52% | Tailpipe CO2 | Upstream GHG | |
| Atlanta | 41 mpg-US (5.7 L/100 km) | 52% | 202 g/mi (125 g/km) | 50 g/mi (31 g/km) | |
| Good Highest CO2-e emissions equivalent to between 31 mpg-US (7.6 L/100 km) to 40 mpg-US (5.9 L/100 km) | Detroit | 38 mpg-US (6.2 L/100 km) | 41% | 2012 Chevrolet Cruze 30 mpg-US (7.8 L/100 km) | |
| Des Moines, Iowa | 37 mpg-US (6.4 L/100 km) | 37% | |||
| St. Louis, Missouri | 36 mpg-US (6.5 L/100 km) | 33% | Greenhouse gas emissions (grams/mile) | ||
| Wichita, Kansas | 35 mpg-US (6.7 L/100 km) | 30% | Tailpipe CO2 | Upstream GHG | |
| Denver | 33 mpg-US (7.1 L/100 km) | 22% | 296 g/mi (184 g/km) | 73 g/mi (45 g/km) | |
| Source: Union of Concerned Scientists, 2012.[116] Notes: The Nissan Leaf is the baseline car for the assessment, with an energy consumption rated by EPA at 34 kWh/100 mi or 99 miles per gallon gasoline equivalent (2.4 L/100 km) combined. The ratings are based on a region's mix of electricity sources and its average emissions intensity over the course of a year. In practice the electricity grid is very dynamic, with the mix of power plants constantly changing in response to hourly, daily and seasonal electricity demand, and availability of electricity resources. | |||||
In September 2014 the UCS published an updated analysis of its 2012 report. The 2014 analysis found that 60% of Americans, up from 45% in 2012, live in regions where an all-electric car produce fewer CO2 equivalent emissions per mile than the most efficient hybrid. The UCS study found several reasons for the improvement. First, electric utilities have adopted cleaner sources of electricity to their mix between the two analysis. The 2014 study used electric-utility emissions based on EPA's 2010 estimates, but since coal use nationwide is down by about 5% from 2010 to 2014, actual efficiency in 2014 is expected to be better than estimated in the UCS study. Second, electric vehicles have become more efficient, as the average model year 2013 all-electric vehicle used 0.325 kWh/mile, representing a 5% improvement over 2011 models. The Nissan Leaf, used as the reference model for the baseline of the 2012 study, was upgraded in model year 2013 to achieved a rating of 0.30 kWh/mile, a 12% improvement over the 2011 model year model rating of 0.34 kWh/mile. Also, some new models are cleaner than the average, such as the BMW i3, which is rated at 0.27 kWh by the EPA. An i3 charged with power from the Midwest grid would be as clean as a gasoline-powered car with about 50 mpg-US (4.7 L/100 km), up from 39 mpg-US (6.0 L/100 km) for the average electric car in the 2012 study. In states with a cleaner mix generation, the gains were larger. The average all-electric car in California went up to 95 mpg-US (2.5 L/100 km) equivalent from 78 mpg-US (3.0 L/100 km) in the 2012 study. States with dirtier generation that rely heavily on coal still lag, such as Colorado, where the average BEV only achieves the same emissions as a 34 mpg-US (6.9 L/100 km; 41 mpg-imp) gasoline-powered car. The author of the 2014 analysis noted that the benefits are not distributed evenly across the U.S. because electric car adoptions is concentrated in the states with cleaner power.[121][122]
National Bureau of Economic Research
One criticism to the UCS analysis and several other that have analyze the benefits of PEVs is that these analysis were made using average emissions rates across regions instead of marginal generation at different times of the day. The former approach does not take into account the generation mix within interconnected electricity markets and shifting load profiles throughout the day.[123][124] An analysis by three economist affiliated with the National Bureau of Economic Research (NBER), published in November 2014, developed a methodology to estimate marginal emissions of electricity demand that vary by location and time of day across the United States. The study used emissions and consumption data for 2007 through 2009, and used the specifications for the Chevrolet Volt (all-electric range of 35 mi (56 km)). The analysis found that marginal emission rates are more than three times as large in the Upper Midwest compared to the Western U.S., and within regions, rates for some hours of the day are more than twice those for others.[124] Applying the results of the marginal analysis to plug-in electric vehicles, the NBER researchers found that the emissions of charging PEVs vary by region and hours of the day. In some regions, such as the Western U.S. and Texas, CO2 emissions per mile from driving PEVs are less than those from driving a hybrid car. However, in other regions, such as the Upper Midwest, charging during the recommended hours of midnight to 4 a.m. implies that PEVs generate more emissions per mile than the average car currently on the road. The results show a fundamental tension between electricity load management and environmental goals as the hours when electricity is the least expensive to produce tend to be the hours with the greatest emissions. This occurs because coal-fired units, which have higher emission rates, are most commonly used to meet base-level and off-peak electricity demand; while natural gas units, which have relatively low emissions rates, are often brought online to meet peak demand. This pattern of fuel shifting explains why emission rates tend to be higher at night and lower during periods of peak demand in the morning and evening.[124]
Environmental footprint
In February 2014, the Automotive Science Group (ASG) published the result of a study conducted to assess the life-cycle of over 1,300 automobiles across nine categories sold in North America. The study found that among advanced automotive technologies, the Nissan Leaf holds the smallest life-cycle environmental footprint of any model year 2014 automobile available in the North American market with minimum four-person occupancy. The study concluded that the increased environmental impacts of manufacturing the battery electric technology is more than offset with increased environmental performance during operational life. For the assessment, the study used the average electricity mix of the U.S. grid in 2014.[125] In the 2014 mid-size cars category, the Leaf also ranked as the best all-around performance, best environmental and best social performance. The Ford Focus Electric, within the 2014 compact cars category, ranked as the best all-around performance, best environmental and best social performance. The Tesla Model S ranked as the best environmental performance in the 2014 full-size cars category.[126]
Charging infrastructure
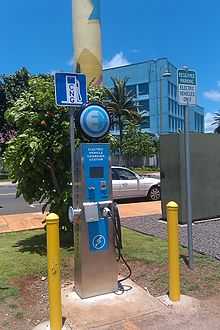
As of March 2013, the United States had 5,678 charging stations across the country, a third of which were located in the three westernmost continental states. Deployments are led by California with 1,207 stations (21.3%), Texas with 432 stations (7.6%), Florida with 352 (6.2%), Washington with 326 (5.7%), and Oregon with 310 stations (5.5%).[19] In terms of public charging points, there were 19,472 public outlets available across the country by the end of December 2013, led by California with 5,176 charging points (26.6%), followed by Texas with 1,599 (8.2%), and Washington state with 1,325 (6.8%).[20] There are 592 CHAdeMO quick charging stations across the country by April 2014.[127]
| Top fifteen states ranked by number of public charging points available in the United States (as of December 2013)[20] | |||||
|---|---|---|---|---|---|
| State | Number of points | % Total | State | Number of points | % Total |
| California | 5,176 | 26.6% | New York | 693 | 3.6% |
| Texas | 1,599 | 8.2% | Maryland | 553 | 2.8% |
| Washington | 1,325 | 6.8% | Massachusetts | 546 | 2.8% |
| Florida | 996 | 5.1% | Illinois | 527 | 2.7% |
| Oregon | 915 | 4.7% | North Carolina | 524 | 2.7% |
| Tennessee | 866 | 4.4% | Georgia/Virginia | 370 | 1.9% |
| Michigan | 721 | 3.7% | Hawaii | 351 | 1.8% |
| Arizona | 710 | 3.6% | Total U.S. | 19,472 | |
| Note: The U.S. DoE Alternative Fuels Data Center counts electric charging units or points, or EVSE, as one for each outlet available, and does not include residential electric charging infrastructure. Number of public charging points as of as of 25 December 2013.[20] | |||||
Markets and sales
Highway legal plug-in electric vehicles
As of September 2014, the United States has the largest fleet of highway-capable plug-in electric vehicles in the world, with about 260,000 plug-in electric cars sold since 2008.[2] Sales are led by California with over 100,000 plug-in electric vehicles delivered between December 2010 and August 2014, representing about 40% of all plug-in cars sold in the country.[3] National sales increased from 17,800 units delivered in 2011 to 53,200 during 2012, and reached 97,100 in 2013, up 83% from the previous year.[128] Between January and September 2014 plug-in electric car sales totaled 87,949 units, up 29.8% year-on-year.[129] The market share of plug-in electric passenger cars increased from 0.14% of new car sales in 2011 to 0.37% in 2012 and reached 0.62% of new car sales during 2013.[6][7] During the first nine months of 2014 the plug-in car market share was 0.71%.[129]
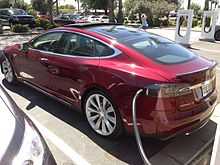
As of November 2014, cumulative sales are led by the Chevrolet Volt plug-in hybrid with 71,867 units, followed by the Nissan Leaf electric car with 69,220 units. Both PEVs were released in December 2010.[1] Launched in the U.S. market in February 2012, the Prius PHV ranks as the third top selling plug-in electric car with 37,610 units,[10][11][12] followed by the all-electric Tesla Model S, released in June 2012, with about 34,350 units,[12][13][14][15] the Ford C-Max Energi plug-in hybrid, launched in October 2012, with 17,302 units delivered,[6][9][133] and the Ford Fusion Energi, released in February 2013, with 16,850 units.[9][133]
During 2013 sales were led by the Chevrolet Volt with 23,094 units, followed by the Nissan Leaf with 22,610 cars, and the Tesla Model S with almost 18,000 units.[15] In 2013 the Model S was the top selling car in the American full-size luxury sedan category, ahead of the Mercedes-Benz S-Class (13,303), the top selling car in the category in 2012, and also surpassing the BMW 7 Series (10,932), Lexus LS (10,727), Audi A8 (6,300) and Porsche Panamera (5,421).[15] During the first quarter of 2014, plug-in car sales captured a 3.0% market share of the luxury vehicle segment, of which, the Model S represented 94% of the plug-in sales.[134]
The best monthly PEV sales volume on record ever was achieved in May 2014, with over 12,000 units delivered, representing a market share of 0.78% of new car sales.[135][136] The highest-ever market share for plug-in vehicles was achieved in October 2013 with 0.85% of new car sales.[137] Sales during the first half of 2014 sales were led by the Nissan Leaf with 12,736 units, followed by the Prius PHEV with 9,300 units, the Volt with 8,615, the Model S with an estimated 7,400 units, and the Fusion Energi with 6,235 units.[138]
As of September 2014, the U.S. is the world's leader in plug-in electric car sales with a 43.0% share of global sales, followed by Japan (15.8%), China (12.8%), the Netherlands (6.8%), France (6.4%) and Norway (6.3%).[2] When sales are broken down by type of powertrain, the United States was the leader in plug-in hybrid sales in 2012 with a 70% share of global sales, while Japan was the leader in pure electric car sales with a 28% share, closely followed by the U.S. with 26%.[139] The American-built Chevrolet Volt was the world's top selling PEV in 2012, with more than 30,000 units sold including its sibling Ampera sold in Europe.[140]
During 2011, all-electric cars (10,064 units) oversold plug-in hybrids (7,671 units), but increased Volt sales, together with the introduction of the Prius PHV and the Ford C-Max, allowed plug-in hybrids to take the lead over pure electric cars during 2012, with 38,584 PHEVs sold versus 14,251 BEVs.[130][141] As of early March 2013, the California Air Resources Board (CARB) reported that owners of 9,559 all-electric vehicles and 8,842 plug-in hybrids had applied for the state's Clean Vehicle Rebate since January 2011. However, CARB noticed that approximately 2,300 Chevy Volt’s were sold in California before the Volt became eligible for the rebate in February 2012. These figures show that plug-in hybrid electric vehicles were also outselling pure electric vehicles in California.[142][143] Despite this trend, during the first half of 2013, all-electric vehicle sales outsold plug-in hybrids in California, out of 15,444 new plug-in electric vehicles sold in the state, plug-in hybrids represented a market share of 0.7% of new vehicle sales, while battery electric vehicle market share was 1.1%.[144][145]

Several industry forecasts agree that plug-in hybrids will continue to outsell pure electric cars in the United States at least until 2020, as the longer driving range of PHEVs is expected to be more attractive to consumers.[146][147] According to a June 2013 forecast by Navigant Research, the U.S. and Canada are the only markets anticipated to have significantly higher sales of plug-in hybrids than pure electric vehicles, at a 1.5:1 sales ratio.[148] Nevertheless, during 2013, sales of pure electric cars (about 47,600 units) were almost even with plug-in hybrids (about 49,000 units), due to large sales of the Tesla Model S and Nissan Leaf during 2013.[149] As of August 2014, cumulative sales of plug-in electric vehicles in the U.S. since December 2010 are led by plug-in hybrids, with 136,378 units sold representing 55.3% of all plug-in car sales, while 110,048 all-electric cars (44.7%) have been delivered to retail customers.[130] In another forecast made in a white paper by Navigant Research published in January 2014, the firm predicted that the stock of plug-in electric vehicles on the U.S. roads by the end of 2014 will be over 304,000 units. Of these, Navigant forecast that 170,000 will be plug-in hybrids (55.9%) and 134,000 all-electric cars (44.1%).[150]
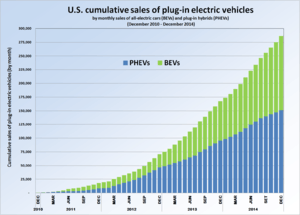
Sales of series production PEVs during its first two years in the U.S. market have been lower than the initial expectations.[22][23][29][147][151] According to a July 2012 study by Pike Research, about 410,000 PEVs will be sold between 2011 and 2015 in the United States, with cumulative sales reaching the 1 million goal set by the Obama Administration only in 2018.[30] However, according to the U.S. Department of Energy, combined sales of plug-in hybrids and battery electric cars are climbing more rapidly and outselling by more than double sales of hybrid-electric vehicles over their respective 24 month introductory periods, as shown in the graph at the right.[56] A more detailed analysis by the Office of Energy Efficiency and Renewable Energy over the same two-year introductory periods found that except for the initial months in the market, monthly sales of the Volt and the Leaf have been higher than the Prius HEV, and the Prius PHEV has outsold the regular Prius during its 8 months in the market. Over the first 24 months from introduction, the Prius HEV achieved monthly sales of over 1,700 in month 18, the Leaf achieved about 1,700 units in month 7, the Prius PHEV achieved nearly 1,900 sales in month 8, and the Volt achieved more than 2,900 sales in month 23.[152]
An analysis by Scientific American found a similar trend at the international level when considering the global top selling PEVs over a 36 month introductory period. Monthly sales of the Volt, Prius PHV and Leaf are performing better than the conventional Prius during their respective introductory periods, with the exception of the Mitsubishi i-MiEV, which has been outsold most of the time by the Prius HEV over their 36 month introductory periods.[153] According to Peak Research, global sales of PEVs will surpass 1 million per year in 2017, after 7 years in the market and almost half the time it took hybrid electric vehicles to reach that sales threshold.[154]
Regional markets
During 2013 the top selling all-electric car markets at the state level in terms of their market share of new light-vehicle registrations were Washington (1.4%), California (1.28%) and Hawaii (1.21%), while the U.S. average was 0.32%. During the first half of 2014 the leading states were Georgia (1.6%), California (1.41%) and Washington (1.13%), and the national average remained at 0.32%.[155] In the 12 months between April 2013 and March 2014, the top selling pure electric car metropolitan markets in terms of market share were San Francisco-Oakland-San Jose (3.33%), Atlanta (2.15%), Seattle-Tacoma (1.83%), Honolulu (1.71%), and Monterey-Salinas (1.51%).[156]
The following table summarizes the ten states and metropolitan areas leading all-electric car adoption in terms of their market share of new light-vehicle registrations or sales.
| Rank 2014(1) | State[155] | Market share(2) 2014 CYTD(1) | Rank 2013 | State[155] | Market share(2) 2013 | Rank | Metro Area[156] | Market share 2013-2014(3) | |
| 1 | Georgia | 1.60% | 1 | Washington | 1.40% | 1 | San Francisco-Oakland-San Jose | 3.33% | |
| 2 | California | 1.41% | 2 | California | 1.28% | 2 | Atlanta | 2.15% | |
| 3 | Washington | 1.13% | 3 | Hawaii | 1.21% | 3 | Seattle-Tacoma | 1.83% | |
| 4 | Hawaii | 1.04% | 4 | Georgia | 0.94% | 4 | Honolulu | 1.71% | |
| 5 | Oregon | 0.67% | 5 | Oregon | 0.89% | 5 | Monterey-Salinas | 1.51% | |
| 6 | Utah | 0.31% | 6 | Washington, D.C. | 0.52% | 6 | San Diego | 1.34 % | |
| 7 | Colorado | 0.27% | 7 | Colorado | 0.33% | 7 | Santa Barbara-Santa Maria-San Luis Obispo | 1.29% | |
| 8 | Arizona | 0.20% | 8 | Utah | 0.31% | 8 | Portland | 1.25% | |
| 9 | Tennessee | 0.19% | 9 | Tennessee | 0.28% | 9 | Los Angeles | 1.08% | |
| 10 | Connecticut | 0.19% | 10 | Illinois | 0.25% | 10 | Eugene | 0.86% | |
| U.S. average | 0.32%[155] | 0.38%[157] | |||||||
| Notes: (1) CYTD: current year-to-date sales as of 30 June 2014 (2) New all-electric vehicle (BEV) registrations as % of total new registrations of light-vehicles only. (3) Sales of new all-electric vehicles as % of total new light-vehicle sales between April 2013 and March 2014. | |||||||||
A total of 52% of American plug-in electric car registrations from January to May 2013 were concentrated in five metropolitan areas: San Francisco (19.5%), Los Angeles (15.4%), Seattle (8.0%), New York (4.6%) and Atlanta (4.4%).[158][159] From January to July 2013, the three cities with the highest all-electric car registrations were all located in California, Atherton and Los Altos in the Silicon Valley, followed by Santa Monica, located in Los Angeles County.[160][161]
California
California is the largest American car market and also the leading PEV market in the country with about 40% of all new plug-in electric vehicles sold nationwide during 2011 and 2012, while the state represents about 10% of all new car sales in the country.[162] As of December 2014, a total of 129,470 plug-in electric vehicles have been registered in California between December 2010 and December 2014, representing about 45% of all plug-in cars sold in the U.S. since 2010.[163] During 2014 California's PEV market share reached 3.2% of total new car sales in the state, up from 2.5% in 2013, while the national PEV market share in 2014 was 0.71%. Registrations of plug-in electric cars in the state in 2014 represented 50.1% of total PEV sales in the U.S. that year.[163][164]

As of December 2014, California not only has more plug-in electric vehicles than any other American state but also more than any other country in the world,[163] and its market share is surpassed only by Norway and the Netherlands.[163][164][165] According to Navigant Research, the Los Angeles metropolitan area is the world's largest PEV city market, with over 15,000 PEV sales expected in 2014, and Navigant forecasts its PEV stock will grow from over 36,000 in 2014 to over 250,000 by 2023.[166]
- Goals
Governor Jerry Brown issued an executive order in March 2012 that established the goal of getting 1.5 million zero-emission vehicles (ZEVs) in California by 2025.[25][26] In addition, in September 2014, Governor Brown signed into law bill SB 1275 that created the Charge Ahead California Initiative, and set the goal of placing at least 1 million zero-emission vehicles and near-zero-emission vehicles on the road in California by January 1, 2023. He expects the initiative will help the state to reach the initial goal set for 2025.[26][27] California's ZEV regulation was first adopted in 1990 as part of the Low Emission Vehicle Program, and it has been modified several times over the years. The ZEV program is under the responsibility of the California Air Resources Board (CARB).[167] The program goal is to reduce the pervasive air pollution affecting the main metropolitan areas in the state, particularly in Los Angeles, where prolonged pollution episodes are frequent.[114]
- Sales
Annual registrations of plug-in electric vehicles in California increased from 6,984 units in 2011 to 20,093 in 2012, and reached 42,545 units in 2013.[164] Plug-in car sales during 2014 climbed to 59,471 units representing 3.2% of total new passenger vehicle sales in California that year.[164] The following table presents annual registrations and market share of new car sales for all-electric and plug-in hybrids sold in California since 2010 through December 2014.
| Year | California[164] | United States[6][7][168][169] | CA share of U.S. PEV sales(3) | Ratio CA/US market shares | ||||||||
|---|---|---|---|---|---|---|---|---|---|---|---|---|
| All-electric | BEV market share(1) | Plug-in hybrid | PHEV market share(1) | Total PEV California | PEV market share(1) | Total PEV sales | PEV market share(2) | |||||
| 2010 | 300 | 0.0% | 97 | 0.0% | 397 | 0.0% | 397 | 0.003% | 100% | - | ||
| 2011 | 5,302 | 0.4% | 1,682 | 0.1% | 6,984 | 0.5% | 17,821 | 0.14% | 39.1% | 3.57 | ||
| 2012 | 5,990 | 0.4% | 14,103 | 0.9% | 20,093 | 1.3% | 53,392 | 0.37% | 37.6% | 3.51 | ||
| 2013 | 21,912 | 1.3% | 20,633 | 1.2% | 42,545 | 2.5% | 96,602 | 0.62% | 44.0% | 4.03 | ||
| 2014 | 29,536 | 1.6% | 29,935 | 1.6% | 59,471 | 3.2% | 118,682 | 0.71% | 50.1% | 4.51 | ||
| Total | 63,040 | n.a. | 66,430 | n.a. | 129,470 | n.a. | 286,842 | n.a. | 45.1% | n.a. | ||
| Notes: (1) Market share of total new car registrations in California. (2) U.S. market share of total nationwide sales. (3) California's market share of total nationwide registrations. | ||||||||||||
California is the leading Volt market and accounted for almost 23% of Volt sales during the second quarter of 2012, followed by Michigan with 6.3% of national sales. The leading regional markets in California were San Francisco, Los Angeles, and San Diego, all metropolitan areas notorious for their high congestion levels and where free access to high-occupancy lanes for solo drivers has been a strong incentive to boost Volt sales in the state.[170] As of November 2011 over 60% of the Leafs sold in the U.S. were bought in California.[171] San Francisco-Oakland-San Jose, Los Angeles, San Diego and Sacramento were among the top selling markets for Leaf sales during the first eight months of 2013. Nissan noted that in San Francisco the Leaf is among the ten top selling vehicles regardless of powertrain.[172]
California is the largest American market for the Tesla Model S.[173] In March 2013, Tesla Motors reported the delivery of the 3,000th Model S in California, representing around 50% of total Model S sales in the U.S.[174][175] According to Edmunds.com, between January and August 2013 the Model S achieved a high market share of new car sales among the U.S. most expensive ZIP codes, as rated by Forbes. Among the top 25 wealthiest ZIP codes, the highest Model S market shares are all found in California, with Atherton ranking first in the U.S. with a 15.4% share, followed by Los Altos Hills with 11.9%, and Portola Valley with 11.2%. Edmunds' analysis also found that during this period the Model S was the most registered passenger car in 8 of the 25 most expensive American ZIP codes.[176]
The Model S, with 8,347 units sold, ended 2013 as the third best selling luxury car in California after the Mercedes-Benz E-Class and BMW 5 Series sedans,[177] and captured a 9.8% market share of the Californian luxury and sports segment.[178] During the first half of 2014, with 2,487 units registered, the Model S market share fell to 5.7% of the luxury and sports segment in California.[179] As of November 2013, with the Model S available nationwide, California continued to lead U.S. sales with a 48% share of national sales.[180]
California is also the leading American market for the BMW i3, with about 3,000 units sold in the state in 2014, representing about half of total U.S. sales that year.[181]
- Incentives

California has been a leader in the promotion of plug-in electric vehicles as the state has in place several financial and non-financial incentives. In addition to the existing federal tax credit, PEVs are eligible for a purchase rebate of up to US$2,500 through the Clean Vehicle Rebate Project (CVRP).[44] Also, battery electric vehicles and initially, the first 40,000 applicants that purchase or lease a plug-in hybrid meeting California’s Enhanced Advanced Technology Partial Zero Emission Vehicle (Enhanced AT PZEV), are entitled to a clean air sticker that allows the vehicle to be operated by a single occupant in California's carpool or high-occupancy vehicle lanes (HOV). The white access sticker is reserved for zero-emissions vehicles, while plug-in hybrids use the green sticker.[182] As of 9 May 2014, the 40,000 green stickers available had been issued.[183] The green sticker limit was increased to 55,000 units beginning July 1, 2014, through the budget trailer bill SB 853.[183][184] In September 2014, law AB 2013 raised the cap for the green stickers from 55,000 to 70,000 new plug-in hybrids.[26][27] As part of the package of bills signed into law by Governor Brown in September 2014, through SB 1275 the California Air Resources Board was mandated to draft a financial plan to meet California's goal of 1 million vehicles on the road while making sure that disadvantaged communities can participate. For this purpose CARB has to change the Clean Vehicle Rebate program to provide an extra credit for low-income residents who wish to purchase or lease an electric car. CARB also should provide assistance to carsharing programs in low-income neighborhoods and install charging stations in apartment buildings in those communities. Under SB 1275, low-income residents who agree to scrap older, polluting cars will also get a clean vehicle rebate on top of existing payments for junking smog-producing vehicles.[26][27]
Another bill signed into law in September 2014, AB1721, grants clean air vehicles free or reduced rates in high-occupancy toll lanes (HOT) lanes. Drivers of clean vehicles already enjoyed discounted rates in some facilities, such the toll to cross the San Francisco Bay Area bridges and to use the State Route 91 Express Lanes in Orange and Riverside Counties.[26][185] AB 2565 facilitates access to charging stations by requiring commercial and residential property owners to approve installation if the charging station meets requirements and complies with the owner’s process for approving a modification to the property. The law makes a term in a lease of a commercial property, executed, renewed, or extended on or after 1 January 2015, void and unenforceable if it prohibits or unreasonably restricts the installation of an electric vehicle charging station in a parking space.[26][185]
- Clean Vehicle Rebate Project

As of 10 March 2014, a total of 52,264 clean vehicle rebates have been issued, for a total of US$110,222,866 disbursed, with only US$3.8 million remaining for fiscal year 2013-2014. The distribution of the rebates issued correspond to 27,210 zero-emission vehicles (ZEVs), including both battery electric vehicles (BEVs) and fuel cell vehicles (FCVs); 24,657 plug-in hybrids (PHEVs); 49 commercial zero-emission vehicles (CZEVs); 210 zero-emission motorcycles (ZEMs); and 138 neighborhood electric vehicles (NEVs).[186] The Clean Vehicle Rebate Project notes their figures do not capture all plug-in electric vehicles sold in California because not every PEV owner applies for the rebate. Also, about 2,300 Chevrolet Volts were sold in California before the Volt became eligible for the rebate in February 2012, and therefore, these sales are not accounted in the CVRP database. In terms of market share, plug-in hybrids represented 47.2% of all clean vehicle rebates, while ZEVs, predominantly all-electric cars, represented 52.11% of all rebates issued since January 2011 through early March 2014. Accounting for sales of the 2,300 Volts, the distribution becomes 49.9% for ZEVs and 49.4% for PHEVs.[186]
The following table presents the geographical distribution of the rebates by county and by type of vehicle (ZEV or PHEV) for the top 15 counties, which together represent 93% of all rebates issued by early March 2014.[186] Based on the CVRP database, Southern California is the leading region in plug-in electric vehicle adoption, with over 28,500 rebates issued for PEVs, while the San Francisco Bay Area has benefited with more than 18,300 rebates. Southern California has captured 54.7% of all rebated issued. The top five counties in the state by early March 2014 are Los Angeles (14,420), Santa Clara (7,735), Orange (6,182), San Diego (4,659), and Alameda (3,870). In Southern California plug-in hybrids (15,201) are outselling all-electric cars (13,200), while in the Bay Area electric cars (10,992) are outselling plug-in hybrids (7,249).[186]
| California Clean Vehicle Rebate Project (CVRP) beneficiaries by county with over 500 rebates issued as of 10 March 2014[186] | |||||
|---|---|---|---|---|---|
| County | Total rebates(1) | ZEVs (BEV/FCV) | PHEVs(2) | Rebate funding | % State |
| Top counties Southern California | |||||
| Los Angeles | 14,420 | 6,277 | 8,015 | $29,117,973 | 27.6% |
| Orange | 6,182 | 2,537 | 3,622 | $12,109,099 | 11.8% |
| San Diego | 4,659 | 3,060 | 1,563 | $10,827,189 | 8.9% |
| Riverside | 1,308 | 501 | 804 | $2,512,933 | 2.5% |
| Ventura | 1,083 | 488 | 593 | $2,214,494 | 2.1% |
| San Bernardino | 943 | 337 | 604 | $1,780,950 | 1.8% |
| Top counties SoCal | 28,595 | 13,200 | 15,201 | $58,562,638 | 54.7% |
| Top counties San Francisco Bay Area | |||||
| Santa Clara | 7,735 | 4,630 | 3,080 | $16,957,252 | 14.8% |
| Alameda | 3,870 | 2,291 | 1,552 | $8,354,469 | 7.4% |
| San Mateo | 2,123 | 1,419 | 657 | $4,865,466 | 4.1% |
| Contra Costa | 1,951 | 985 | 959 | $4,027,554 | 3.7% |
| San Francisco | 1,082 | 681 | 371 | $2,557,025 | 2.1% |
| Marin | 845 | 536 | 305 | $1,907,300 | 1.6% |
| Sonoma | 781 | 450 | 325 | $1,695,800 | 1.5% |
| Top counties Bay Area | 18,387 | 10,992 | 7,249 | $40,364,866 | 35.2% |
| Other top counties | |||||
| Sacramento | 1,062 | 634 | 427 | $2,272,609 | 2.0% |
| Santa Cruz | 542 | 330 | 204 | $1,193,900 | 1.0% |
| Total Top 15 counties | 48,586 | 25,156 | 23,081 | $102,394,013 | 93.0% |
| Total California(3) | 52,264 | 27,210 | 24,657 | $110,222,866 | 100% |
| Notes: (1) Total includes ZEVs (both BEVs and FCVs), PHEVs, CZEVs, ZEMs and NEVs. (2) About 2,300 Chevrolet Volts sold in California before the car became eligible for the rebate in February 2012 are not included. (3) Not all plug-in electric vehicles sold in California are captured in the CVRP database as not every PEV owner applies for the rebate. | |||||
Georgia
Georgia ranked second in the U.S. after California in terms of total plug-in electric vehicles on the road by mid 2014 .[187] During the first half of 2014 Georgia ranked as the top selling all-electric car market in the U.S. at the state level with a 1.6% share of new light-vehicle registrations, ahead of California (1.41%), and up from 0.94% during 2013.[155] As of August 2014, there were about 12,000 electric vehicles registered in the state, of which, about 80% are registered in metro Atlanta’s five core counties.[188] In the 12 months between April 2013 and March 2014, metro Atlanta was the second top selling all-electric car metropolitan market in the U.S., with a market share of 2.15% of total new light-vehicle sales in the state, 5.6 times the national average share of 0.38%.[157] Savannah ranks second in the state after Atlanta, with a market share of 0.13% of total new light-vehicle sales.[156]
Between August 2013 and May 2014, Atlanta was the top U.S. metropolitan market for the Nissan Leaf for eight out of the 10 months,[157] and until July 2013, Atlanta was the third largest Leaf market behind San Francisco and Los Angeles.[189] Leaf sales are favored by Georgia's law, which caps sales of electric vehicles sold direct by a manufacturer to 150, setting a restrictive limit to Tesla Model S sales, and the law excludes plug-in hybrids for eligibility to the state's tax credit.[157]
- Tax credits
The State of Georgia considers alternative fuel vehicles (AFVs) those that run solely on alternative fuel and do not run on regular gasoline. AFVs includes vehicles that operate using battery electricity, propane, natural gas, and hydrogen fuel cell.[190] As incentives to accelerate all-electric vehicle adoption, in addition to the existing US$7,500 federal tax credit, Georgia offers an income tax credit of 20% of the vehicle cost up to US$5,000 for the purchase or leasing of a zero emission vehicle (ZEV). Plug-in hybrids are not eligible for this incentive because sometimes they are powered by electricity from their on-board combustion engine. There is also a 10% tax credit up to US$2,500 for the purchase and installation of qualified electric vehicle charger. This tax credit applies only to non-retail business enterprises and chargers installed at homes do not qualify.[191]

An income tax credit for the purchase of a new commercial medium-duty or heavy-duty AFVs will go into effect on July 1, 2015. Medium-duty hybrid electric vehicles also qualify. Eligible medium-duty AFVs with a gross vehicle weight rating (GVWR) between 8,500 to 26,001 lb (3,856 to 11,794 kg) qualify for a credit of up to US$12,000, while heavy-duty AFVs with a GVWR over 26,001 lb (11,794 kg) qualify for a credit of up to US$20,000. The credit is capped at US$250,000 per taxpayer. Qualified AFVs must be purchased before June 30, 2017, remain registered in Georgia for at least five years, and accumulate at least 75% of their annual mileage in Georgia. Up to US$2.5 million in total credits will be available each fiscal year.[192]
- Access to HOV lanes
The definition of alternate fuel vehicle for the purposes of an AFV License Plate in Georgia is different from the one for tax credit purposes. The Official Code of Georgia Annotated defines an AFV as a vehicle that has been certified by the EPA in accordance with the Federal Clean Air Act, therefore, both all-electric vehicles and plug-in hybrids are eligible for Georgia's AFV license plate.[193] All vehicles displaying a GA alternative fuel license plate are allow to use high occupancy vehicle lanes (HOV) regardless of number of passengers. Alternative fuel vehicles displaying the proper alternative fuel license plat may obtain a Peach Pass electronic tag that grants them toll-free access to all Peach Pass controlled high-occupancy toll lanes (HOT) lanes.[194]
- Time-of-use electricity rates
Georgia Power, the primary utility in Atlanta, offers a time-of-use electric vehicle plan designed for plug-in charging. As of September 2014, the plan has about 1,500 customers statewide.[195] For a monthly fee of US$10, the utility lowers the overnight rate to 1.3 cents per Kilowatt hour (kWh) while raising the peak rate, from 2-7 p.m. from June through September, to 20.3 cents per kWh. There is also a shoulder rate of 6.2 cents per Kwh in between those times.[195] The average U.S. rate is 11.88 cents per kWh.[157]
- Charging infrastructure
As of April 2014, Georgia had 238 charging stations with 548 public outlets available across the state.[20] Of these, about 120 public charging stations are located in metro Atlanta, with only about half of these located inside the city limits of Atlanta. Considering the rapid growth of electric cars in the city, there is a shortage of charging infrastructure relative to supply of electric vehicles.[188]
The city of Atlanta is considering legislation to attend the needs of electric car owners and others who want to provide electric vehicle charging at their business, multifamily dwelling or private home. The measure aims to remove a major barrier to owning an electric vehicle by encouraging office and residential landlords to install electric vehicle chargers and reserved parking. Under the proposal, each electric vehicle charging station would be counted as one parking space, and the minimum parking requirement for developers and builders would be reduced by one space for each charging station provided, allowing up to a 10 percent reduction in minimum parking requirements. The city also wants to simplify the process required to obtain a permit to install electric vehicle chargers and make the spaces more identifiable.[188]
Hawaii
Hawaii has a high potential for mass adoption of plug-in electric vehicles due to the limited driving range imposed by the island geographies, and its high fuel costs, with gasoline prices, as of September 2013, ranging between US$4.25 and US$5.00 a gallon.[196][197] The number of registered plug-in electric vehicles increased from 581 units in 2011, to 967 in 2012,[198] and reached 1,551 units in June 2013.[199] As of August 2014, a total of 2,821 plug-in highway legal plug-in electric cars have been registered in Hawaii.[200]
In terms of EV adoption, Hawaii ranked in 2013 as the state with the third highest all-electric car market share with 1.21% of new car sales, and during the first half of 2014 ranked fourth with a 1.04% market share.[155] Accounting for sales of pure electric cars between April 2013 and March 2014, the Honolulu metropolitan area ranks as the fourth top selling BEV metro market in the United States, with 1.71% of new car sales.[156]
In January 2011 the state implemented a purchase rebate of up to US$5,000 available for both the purchase of a plug-in electric car purchase and a charging station, but limited to US$4,500 for the vehicle.[201] The rebate ended in May 2012 as high consumer demand depleted the fund. More than 450 rebates were issued totaling about US$2 million. Several efforts to add more funds were unsuccessful.[202]
New York
The stock of plug-in electric vehicles in New York climbed from 1,000 units in early 2012, to over 10,000 plug-in vehicles by mid-September 2,014. The state of New York set the goal to deploy up to 3,000 EV charging stations in public and workplace locations across the state by 2018. As of September 2014, there are about 1,000 charging stations.[203]
Plug-in electric vehicles and hybrid electric vehicles with a combined fuel economy rating of at least 45 mpg-US (5.2 L/100 km; 54 mpg-imp) and that also meet the California Air Resources Board SULEV emissions standard, are eligible for the Clean Pass Program. Eligible vehicles which display the Clean Pass vehicle sticker are allowed to use the Long Island Expressway HOV lanes, regardless of the number of occupants.[204] Drivers of qualified vehicles may also receive a 10% discount on established E-ZPass accounts with proof of registration.[205] In New York state there are no purchase incentives.
Oregon
As of November 2013, there were about 3,500 plug-in electric vehicles registered in Oregon.[206] In 2013 the state was the fifth top selling all-electric car market in the U.S. at the state level with a 0.89% market share of new light-vehicle registrations, more than twice the national average share of 0.32%. During the first half of 2014 Oregon BEV share fell to 0.67% but continued to rank in the fifth place among the top selling states.[155]
In the 12 months between April 2013 and March 2014, two metropolitan areas in Oregon ranked among the top ten selling all-electric car metropolitan markets in the U.S. Portland ranked eighth with a 1.25% market share of total new light-vehicle sales, ahead of Los Angeles metropolitan area, and Eugene ranked in number 10 with a market share of 0.86%. The national average share during this period was 0.38%.[156]

- Incentives
A US$1,500 tax credit for the purchase of a new all-electric vehicle is no longer available.[206][207] There is a tax credit up to US$750 to cover 25% of the cost of purchasing and installing an electric vehicle charger station, and 35% for business owners. Beginning January 1, 2015, business owners that purchase two or more all-electric vehicles may be eligible for a tax credit of 35% of eligible costs for the incremental cost of purchasing the vehicles. This incentive ends on December 31, 2018.[194]
- Electric Avenue
Electric Avenue is a joint research and development initiative of Portland State University (PSU), Portland General Electric (PGE), and the City of Portland. The Electric Avenue was launched in August 2011 to learn about the interaction and performance of charging stations and a variety of electric vehicles. The initiative also aimed to understand the charging preferences and travel patterns of electric vehicle visitors. The charging infrastructure includes quick chargers and both Level 1 and Level 2 charging stations powered by 100% renewable energy from PGE, and offers charging at standard city parking rates. The site comprises eight on street parking spaces with seven available charging stations located along an entire block. The Electric Avenue is located in the south end of downtown Portland, at the PSU’s campus adjacent to Portland’s Sixth Avenue Transit Mall where light rail trains, electric street cars, buses, cars, bikes, and pedestrians share a well-integrated personal and public transit corridor.[208]
Texas
Texas is the second largest light-duty vehicle market in the U.S. after California, with over 20 million passenger and light truck vehicles registered at the end of 2013.[209] As of May 2014, there were about 5,000 plug-in electric vehicles registered in the state.[210] Accounting for sales of new all-electric vehicles between April 2013 and March 2014, the top three selling metropolitan markets in Texas in terms of market share of total new light-vehicle sales were the Austin metropolitan area with 0.47%, followed by Dallas-Ft. Worth with 0.21% and Houston area with 0.15%.[156] The national average share for the period was 0.38%, with Austin ranking in 15th place, and together with metro Atlanta, the only two cities in the top 15 that are not located on the West Coast.[157]
In November 2013 the Texas Commission on Environmental Quality approved a rebate program to provide financial incentives up to US$2,500 for the purchase or lease of new eligible vehicles powered by compressed natural gas (CNG), liquefied petroleum gas (LPG), or plug-in electric drive with battery capacity larger than 4 kWh.[210] The rebate amount for leasing depends on the lease term, only 4-year lease terms are eligible for the full US$2,500, just like new car purchases.[211] Total funding for the program is US$7.7 million, and the maximum number of vehicles allowed is 2,000 units for each plug-in electric drive and natural gas/propane vehicles for the length of the program.[210][211] Only purchases made on or after May 13, 2014 are eligible to apply for a rebate, and the program ends June 26, 2015 or until funding ends. As of 22 September 2014, there were US$6,7 million remaining in the rebate fund.[212]

Among plug-in cars sold nationwide, the Tesla Model S is not eligible for the rebate because only new PEVs purchased or leased from a dealer or leasing company licensed to operate in Texas may qualify. Tesla Motors is not authorized to sell its vehicles in the state due to its direct-sales business model.[210][213][214]
- Texas River Cities Plug-In Electric Vehicle Initiative
Despite the low penetration of plug-in electric vehicles in the state, the Texas River Cities Plug-In Electric Vehicle Initiative (TRC) is one of the most comprehensive plans for electric vehicles and their infrastructure aimed to increase the long-term success of PEV adoption. The TRC initiative encompasses two major metropolitan areas in and around Austin and San Antonio.[215] Austin Energy, one of the project partners, had deployed 239 utility-operated publicly accessible charging stations in the TRC region by 2012. The utility company is the recipient of the U.S. Department of Energy funding for this initiative. The TRC region is projected to have 4,259 PEVs in 2015 and 17,336 in 2020.[216]
- Pecan Street demonstration project
This demonstration project is run by the Pecan Street Inc., a University of Texas based research consortium of research and industry partners focused on developing and testing advanced technology, business model, and customer behavior surrounding energy management systems. The project is supported by a US$10.4 million smart grid demonstration grant from the U.S. Department of Energy and more than US$14 million in matching funds from the project partners. The demonstration project began in 2010 and is taken place with volunteer residents at the Mueller neighborhood, a planned green community in Austin. The Pecan Street hosts an electric vehicle research program and provides incentives to participants with rebates of US$3,000 and US$7,500 to lease or purchase a PEV that is in addition to the federal tax credits. Through the research program, Pecan Street is studying grid load and monitoring home energy use through management equipment. As a result of the incentive program, Mueller has more plug-in electric vehicles per capita than any other U.S. neighborhood.[217][218][219]
General Motors is a sponsor of the Pecan Street demonstration and is supporting the project to learn the charging patterns of plug-in electric car owners, and to study how a residential fleet of electric vehicles might strain the electric grid if all owners try to charge them at the same, which is what the preliminary monitoring found when the plug-in cars return home in the evening. As of June 2013, the community had nearly 60 Chevrolet Volt owners alone thanks to GM's commitment to match the federal government's US$7,500 rebate incentive, which halves the purchase price of the Volt.[220]
Washington
The state set a goal to have 50,000 electric or other clean vehicles on the road by 2020.[18] As of 31 July 2014, there were 9,745 electric vehicles registered in Washington, consisting of 6,798 are all-electric vehicles and 2,947 plug-in hybrids.[221] Washington was the top selling all-electric car market in the U.S. at the state level in 2013 with a 1.40% market share of new light-vehicle registrations, ahead of California (1.28%). Washington PEV share in 2013 was more than four times the national average share of 0.32%.[155] Washington fell to third place with a market share of 1.13%, behind Georgia (1.6%), California (1.41%).[155]

As of July 2014, the Seattle metropolitan area concentrated 74.2% of the state PEV registrations, with 5,420 plug-ins in King County (55.6%), where the city of Seattle is located, 1,011 in Snohomish County (10.4%), and 804 in Pierce County (8.3%). Outside the metro area, Clark County has the largest number of PEV registrations with 516 units (5.3%).[221] In the 12 months between April 2013 and March 2014, Seattle-Tacoma metro ranked as the third top selling all-electric car metropolitan market with a 1.83% market share of total new light-vehicle sales, only behind San Francisco-Oakland-San Jose (3.33%) and Atlanta (2.15%).[156]
- Incentives
New passenger cars, light-duty trucks, and medium-duty passenger vehicles that operate exclusively on electricity, hydrogen, natural gas, or propane are exempt from state motor vehicle sales and use taxes. Qualified vehicles must also meet the California motor vehicle emissions standards, and comply with the rules of the Washington Department of Ecology. The sales tax exemption expires July 1, 2015.[222] The sales tax varies from 7% to 9.6% depending on location.[18]
In November 2014 Governor Jay Inslee announced his intention to extend the sale tax break for electric vehicles beyond July 2015 and explore giving them access to carpool lanes. According to the Washington's Department of Revenue the extension would translate in nearly US$13 million less tax revenues in fiscal year 2016, and US$17 million in 2017.[18]
Puget Sound Energy (PSE) provides a $500 rebate to the first 5,000 qualified customers for the purchase and installation of Level 2 electric vehicle charging station (EVSE). Eligible applicants must be PSE residential electric schedule 7 customers, must be the registered owner of an electric vehicle, and must install the charging station within a specified timeframe. PSE expects the rebate program to remain available until November 1, 2016, depending on available funds.[223][224]
Sales by model
As of December 2014, there are 23 highway-capable plug-in cars available in the American market for retail sales from 12 car manufacturers: BMW, Daimler AG, Fiat Chrysler Automobiles, Ford Motor Company, General Motors, Honda, Kia Motors, Mitsubishi Motors, Nissan, Tesla Motors, Toyota, and Volkswagen.[8][9] As of November 2014, only the Chevrolet Volt, Nissan Leaf, Tesla Model S, BMW i3, Mitsubishi i, Porsche Panamera S E-Hybrid, Cadillac ELR, and Ford’s C-Max and Fusion Energi plug-in hybrids are available nationwide. Several models, such as the Toyota RAV4, Fiat 500e, Honda Fit EV, and Chevrolet Spark EV, are compliance cars sold in limited markets, mainly California, available in order to raise an automaker’s fleet average fuel economy to satisfy regulator requirements.[225][226][227][228]
The following table presents key features and cumulative sales of highway-capable plug-in electric cars launched in the American market since 2008 through November 2014.
| Key features and sales of series-production plug-in electric cars available for retail sales or leasing in the United States (as of November 2014 ) | ||||
|---|---|---|---|---|
| Model | Type of PEV | All-electric range | Market launch | Production/Sales |
 | Plug-in hybrid | 35 mi (56 km) | December 2010 | 71,867 units sold through November 2014.[1] The Volt is the top selling plug-in electric car in the United States.[229] |
 | Electric car | 73 mi (117 km) | December 2010 | 69,220 Leafs sold through November 2014.[1] The Leaf is the top selling all-electric car in the United States. |
 | Electric car | 63 mi (101 km) | January 2011 | 3,693 units registered through November 2014 (includes 2nd and 3rd gen models).[6][9][10][230] Deliveries of the third generation model began in May 2013.[231] |
 | Electric car | 62 miles (100 km) | December 2011 | 1,881 units sold through November 2014.[232] |
 | Electric car | 76 mi (122 km)[233] | December 2011 | 4,342 units sold through November 2014.[6][9][10][234] Deliveries to retail customers began in May 2012. Availability is limited to New York, New Jersey and California.[235][236] |
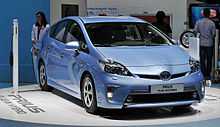 | Plug-in hybrid | 11 mi (18 km)[237] | February 2012 | 37,610 units sold through November 2014.[10][11][12] Available only in 15 states.[238] |
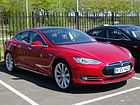 | Electric car | 265 mi (426 km) (85 kW·h battery) 208 mi (335 km) (60 kW·h battery) | June 2012 | About 34,355 units sold through November 2014.[10][12][13][14][15] |
 | Electric car | 82 mi (132 km) | July 2012 | 1,035 units delivered through November 2014.[6][10] Production is limited to 1,100 units over the first three years. Initial availability is limited to California and Oregon.[12][239] In July 2014 Honda announced the end of production of the Fit EV |
second generation | Electric SUV | 103 mi (166 km) | September 2012 | 2,425 units sold through November 2014.[6][10][12] Available only in California.[241] Production is limited to 2,600 units. The battery supply deal between Toyota and Tesla is set to conclude by the end of 2014.[242] |
| Plug-in hybrid | 20 mi (32 km) | October 2012 | 17,302 units sold through November 2014.[6][9][133] | |
 | Plug-in hybrid | 13 mi (21 km) | January 2013 | 912 units sold through November 2014.[10][12] |
| Plug-in hybrid | 20 mi (32 km) | February 2013 | 16,850 units sold through November 2014.[9][133] | |
 | Electric car | 82 mi (132 km) | June 2013 | 1,553 units sold through November 2014.[9][10] Initial availability limited to California and Oregon. |
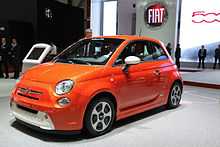 | Electric car | 87 mi (140 km) | July 2013 | About 2,033 units sold through November 2014.[9][10] |
.jpg) | Plug-in hybrid | 16 mi (26 km) | October 2013 | 934 units sold through November 2014.[9][10] |
 | Plug-in hybrid | 35 mi (56 km) | December 2013 | 1,198 units sold though November 2014.[10][9] |
 | Electric/REx | 81 mi (130 km) | May 2014 | 5,079 units sold through November 2014.[9] |
 | Plug-in hybrid | 12 mi (19 km) | June 2014 | 57 units delivered through November 2014.[243] The limited production run was sold out in December 2014. The country with the most orders was the United States with 297 units out of 918 to be produced.[244] Production is scheduled to end in July 2015.[245] |
 | Electric | 87 mi (140 km) | July 2014 | 448 units were sold through November 2014.[9] |
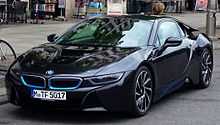 | Plug-in hybrid | 15 mi (24 km) | August 2014 | 397 units delivered through November 2014.[9] |
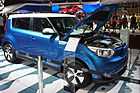 | Electric car | 93 mi (150 km) | October 2014 | 249 units delivered through November 2014.[9] |
_%E2%80%93_Frontansicht%2C_19._Juni_2014%2C_D%C3%BCsseldorf.jpg) | Electric car | 83 mi (134 km) | October 2014 | 120 units delivered through November 2014.[9] |
 | Plug-in hybrid | 14 mi (23 km) | November 2014 | 45 units were sold during its first month in the market.[9] |
| Out-of-production plug-in electric cars that were available for retail sales or leasing in the United States since 2008 | ||||
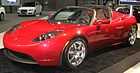 | Electric car | 245 mi (394 km) | March 2008 | About 1,800 units through December 2011.[246][247][248] Production ended in January 2012.[249] |
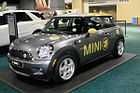 | Electric car | 100 mi (160 km) | June 2009 | 500 units leased for field testing that ended in December 2011.[250][251] |
 | Electric car | 100 mi (160 km) | Late 2010 | About 100 units sold mostly in Indiana through March 2011[252] After Think Global filed for bankruptcy in June 2011,[253] the remaining 150 cars in stock in the U.S. were put on sale at a discounted price.[254] |
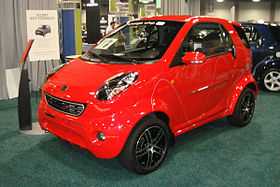 | Electric car | 100 mi (160 km) | April 2011[255] | 34 units sold by March 2012.[256] |
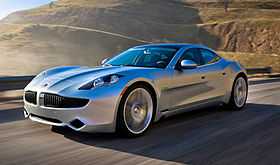 | Plug-in hybrid | 32 mi (51 km) | November 2011 | 1,635 units were sold through December 2013.[10][257][258] Production was suspended in November 2012.[259] Fisker Automotive filed for bankruptcy in November 2013.[260] |
.jpg) | Electric car | 94 mi (151 km)[261] | January 2012 | 673 units were leased in the U.S. through December 2012.[137] Limited production available only for leasing as part of a demonstration program.[250][262] |
 | Electric car | 88 mi (142 km) | March 2012 | 117 units were delivered in California through April 2013.[263] By September 2013, a total of 50 cars left in stock and 100 gliders were available for sale at a discounted price in the U.S. and abroad.[264] |
Future trends
According to a 2011 study by Pike Research, annual sales of plug-in electric vehicles in the U.S. were predicted to reach 360,000 vehicles by 2017. The study projected that the highest sales between 2011 and 2017 would take place in California, New York and Florida.[265] In 2012, and as sales have fallen short of projections, Pike Research projected that annual sales of plug-in electric vehicles in the U.S. will reach 400,073 units in 2020, with California as the state with the highest PEV sales over the remainder of this decade, with nearly 25% of all PEVs sold in the United States between 2012 and 2020. In terms of market share, California will be followed by New York, Florida, Texas, and Washington, but Hawaii is expected by 2020 to have the highest penetration rate of PEVs as a percentage of all light duty vehicle sales. California is predicted to have four of the top ten metropolitan areas for PEV sales: Los Angeles–Long Beach, San Francisco Bay Area, Silicon Valley, and Greater Sacramento. Pike Research forecasts that cumulative sales of PEVs in the largest 102 American cities will reach more than 1.8 million from 2012 through 2020, with a share of more than 25% of all annual sales concentrated in the top five metropolitan areas for PEV sales: New York, Los Angeles, San Francisco, Seattle, and Portland.[266][267][268]
In a separate analysis published in September 2013, Navigant Research forecasts that PEVs will represent a 2.4% market share of total new vehicle sales in the United States in 2022. Navigant also predicted that Hawaii will have the highest concentration of plug-in electric vehicle sales in the U.S., with 10.1% of total Hawaiian new light-duty vehicle sales in 2022; followed by Northern California with 9.7%, California as a whole will be 6.0%, and Oregon with 5.8%.[269] Hawaii has a high potential for mass adoption of plug-in electric vehicles due to the limited driving range imposed by the islands size and its high fuel costs.[196][197] In an updated report published in April 2014 Navigant forecasts that the United States will remain the largest national market for light-duty plug-in electric vehicles during the next 10 years, with the PEV segment growing at a compound annual growth rate of 16.3% between 2014 and 2023, predicting that annual PEV sales in the U.S. will exceed 514,000 in 2023.[270]
According to forecasts made by Pike Research in January 2013, the United States will continue to be the largest market for PEVs in 2020, but the European market is anticipated to have a higher market penetration (4.0% market share) due to its higher gasoline prices and supportive government policies, while Japan is expected to become the largest market for hybrid electric vehicles.[147][271] A similar trend is predicted by Navigant Research in a geographical forecast published in April 2014. Navigant predicts that by 2023 the fleet of light duty plug-in electric vehicles in use in Oslo is expected to represent 10.7% of the city's total registered light-duty fleet, 7.7% in Amsterdam, and 2.5% in Paris. Navigant also predicts that by 2020 annual PEV sales in the Greater Tokyo Area will surpass Los Angeles, currently the city with the largest PEV market. The PEV fleet in Tokyo is expected to reach a market penetration of 2.3% of the city's light-duty stock in 2023, and become the world's largest PEV city market with a PEV stock of around 260,000 in 2023, while Los Angeles is expected to have a stock of over 250,000 PEVs.[166]
Neighborhood electric vehicles
The chart and table are based on Department of Energy tables.[272] (Table V1 and the Historical Data.) Figures for electric vehicles do not include privately owned vehicles, but do include Low-Speed Vehicles (LSVs), defined as "four-wheeled motor vehicles whose top speed is ...20 to 25 mph (32 to 40 km/h) ... to be used in residential areas, planned communities, industrial sites, and other areas with low density traffic, and low-speed zones."[273] LSVs, more commonly known as neighborhood electric vehicles (NEVs), were defined in 1998 by the National Highway Traffic Safety Administration's Federal Motor Vehicle Safety Standard No. 500, which required safety features such as windshields and seat belts, but not doors or side walls.[274][275][276]
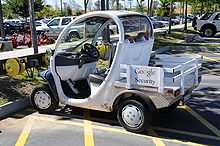
| Electric Cars in the United States | |
|---|---|
| Year | Number |
| 1992 | 1,607 |
| 1993 | 1,690 |
| 1994 | 2,224 |
| 1995 | 2,860 |
| 1996 | 3,280 |
| 1997 | 4,453 |
| 1998 | 5,243 |
| 1999 | 6,964 |
| 2000 | 11,830 |
| 2001 | 17,847 |
| 2002 | 33,047 |
| 2003 | 47,485 |
| 2004 | 49,536 |
| 2005 | 51,398 |
| 2006 | 53,526 |
| 2007 | 55,730 |
| 2008 | 56,901 |
| 2009 | 57,185 |
| Average annual growth | 26.0% |
Since 1998 Global Electric Motorcars (GEM), the market leader in North America, has sold more than 50,000 GEM battery-electric vehicles worldwide as of mid 2014.[277]
Modern production timeline
.jpg)
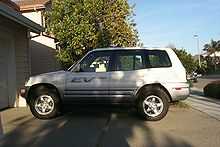

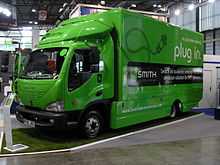


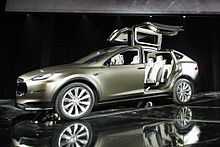
This is a list of all highway-capable plug-in electric vehicles available for retail customers in the U.S. for sale or leasing since the early 1990s.
1990-2003
- Chrysler TEVan (1993-1995)
- General Motors EV1 (1996-2003)
- Toyota RAV4 EV (1997-2003)
- Honda EV Plus (1997-1999)
- Nissan Altra (1998-2001)
- Dodge Caravan EPIC (1999 to 2001)
- Ford TH!NK City (1999-2003)
2008-2014
- 2008
- Tesla Roadster (production ended in 2011)
- 2009
- Mini E (demonstration program ended in 2011)
- 2010
- Chevrolet Volt
- Nissan Leaf
- Navistar eStar utility van
- 2011
- Th!nk City (no longer in production)
- Smart ED 2nd gen (available for leasing only)
- Wheego Whip LiFe
- Fisker Karma (no longer in production)
- Azure Transit Connect Electric delivery van (no longer in production)
- Mitsubishi i (Mitsubishi i MiEV in the rest of the world)
- Smith Newton delivery truck
- 2012
- BMW ActiveE (demonstration program ended in 2014)
- Coda (no longer in production)
- Ford Focus Electric (limited production)
- Toyota Prius PHV
- Boulder DV-500 delivery truck
- Amp Electric Vehicles (SUV and light truck conversions)
- Tesla Model S
- Honda Fit EV (limited production)
- Toyota RAV4 EV (2nd gen) (limited production)
- Ford C-Max Energi
- 2013
- Honda Accord Plug-in Hybrid
- Ford Fusion Energi
- Scion iQ EV (limited production available only for carsharing fleets, not for retail customers)
- Smart electric drive 3rd gen (available with battery leasing option)
- Chevrolet Spark EV (limited production)
- Fiat 500e (limited production)
- Porsche Panamera S E-Hybrid
- Cadillac ELR (limited production)
- 2014
- BMW i3
- Porsche 918 Spyder (limited edition)
- Mercedes-Benz B-Class Electric Drive
- BMW i8
- Volkswagen e-Golf
- Kia Soul EV
- Porsche Cayenne S E-Hybrid
Future cars
- Market launch scheduled between 2015 and 2016
- Second generation Chevrolet Volt
- Audi A3 Sportback e-tron
- Mitsubishi Outlander P-HEV
- Mercedes-Benz S 500 Plug-in Hybrid
- Tesla Model X
- Detroit Electric SP.01 (limited production)
- Chrysler Town & Country plug-in hybrid
- Audi R8 e-tron (limited production)
- Cadillac CT6 Plug-in Hybrid
U.S. electric vehicle organizations
- CalCars (The California Cars Initiative)
- Electric Auto Association (EAA) (North America)
- Electric Auto Association of Northern Nevada
- Electric Auto Association Silicon Valley
- Electric Car Society
- Humboldt Electric Vehicle Association
- NEDRA National Electric Drive Racing Association
- Oregon Electric Vehicle Association
- Plug In America
- PHEV Research Center
- Project EVIE
- RechargeIT (Google.org)
- San Francisco BayLEAFs
- Seattle Electric Vehicle Association
- World Electric Vehicle Association
See also
- CalCars
- Electric car use by country
- Government incentives for plug-in electric vehicles
- Hybrid electric vehicles in the United States
- List of modern production plug-in electric vehicles
- Plug In America
- Plug-in electric vehicle
- Plug-in electric vehicles in Japan
- Plug-in electric vehicles in the Netherlands
- Plug-in electric vehicles in Norway
- Plug-in electric vehicles in the United Kingdom
- Plug-in hybrids in California
- Plug-in hybrids in New York
References
- ↑ 1.0 1.1 1.2 1.3 1.4 "Plug-In Electric Car Sales In Nov: Leaf Grows, Volt Wanes (UPDATED)". Green Car Reports. 2014-12-02. Retrieved 2014-12-03. As of November 2014, a total of 71,867 Chevrolet Volts and 69,220 Nissan Leafs have been sold in the U.S. since December 2010.
- ↑ 2.0 2.1 2.2 Jeff Cobb (2014-10-22). "Global Plug-in Car Sales Now Over 600,000". HybridCars.com. Retrieved 2014-10-23. Cumulative global sales totaled 603,932 highway legal plug-in electric passenger cars and light utility vehicles through September 2014, consisting of 356,232 all-electric cars and utility vans and 247,700 plug-in hybrids. Sales figures account for sales only in the top ten world's markets.
- ↑ 3.0 3.1 Alan Ohnsman (2014-09-09). "Californians Propel Plug-In Car Sales With 40% of Market". Bloomberg News. Retrieved 2014-09-09.
- ↑ Jennifer Medina (2014-09-21). "Jerry Brown Seeks More Electric Cars in California". The New York Times. Retrieved 2014-09-27.
- ↑ Dana Hull (2014-09-08). "California charges ahead with electric vehicles". San Jose Mercury News. Retrieved 2015-03-15.
- ↑ 6.0 6.1 6.2 6.3 6.4 6.5 6.6 6.7 6.8 Jeff Cobb (2013-01-08). "December 2012 Dashboard". HybridCars.com and Baum & Associates. Retrieved 2013-01-14. See the section: U.S. Plug-in Electric sales for December 2012. A total of 53,172 plug-in electric vehicles were sold during 2012. Sales of the Fisker Karma, Coda and Wheego are not included in this figure, because these carmakers does not report monthly sales on a regular basis. Tesla Model S sales are estimated.
- ↑ 7.0 7.1 7.2 Jeff Cobb (2014-01-06). "December 2013 Dashboard". HybridCars.com and Baum & Associates. Retrieved 2014-01-07.
- ↑ 8.0 8.1 Mark Glover (2014-08-09). "Electric-vehicle charging stations sprouting all over California". Sacramento Bee. Retrieved 2014-08-10.
- ↑ 9.0 9.1 9.2 9.3 9.4 9.5 9.6 9.7 9.8 9.9 9.10 9.11 9.12 9.13 9.14 9.15 9.16 9.17 Jeff Cobb (2014-12-03). "November 2014 Dashboard". HybridCars.com and Baum & Associates. Retrieved 2014-12-04. A total of 107,396 plug-in electric cars were sold between January and November 2014, consisting of 55,906 all-electric cars and 51,490 plug-in hybrids. See sections: "November 2014 Plug-in Hybrid Car Sales Numbers" and "November 2014 Battery Electric Car Sales Numbers"
- ↑ 10.0 10.1 10.2 10.3 10.4 10.5 10.6 10.7 10.8 10.9 10.10 10.11 10.12 10.13 Cole, Jay (2014-01-06). "December 2013 Plug-In Electric Vehicle Sales Report Card". InsideEvs.com. Retrieved 2014-01-06.
- ↑ 11.0 11.1 11.2 John Voelcker (2013-01-03). "Plug-In Electric Car Sales Triple In 2012 As Buyers, Models Increase". Green Car Reports. Retrieved 2013-01-03.
- ↑ 12.0 12.1 12.2 12.3 12.4 12.5 12.6 12.7 12.8 Jay Cole (2014-12-03). "November 2014 Plug-In Electric Vehicle Sales Report Card". InsideEVs.com. Retrieved 2014-12-04.
- ↑ 13.0 13.1 13.2 Jay Cole (2014-05-07). "Monthly Plug-In Sales Scorecard - 2014". InsideEVs.com. Retrieved 2014-05-08. Out of 6,457 units delivered globally during 1Q 2014, about 3,000 were sold in Europe, leaving around 3,500 units sold in North America. Of these, 158 units were sold in Canada. An estimated 1,100 were sold in the U.S. in April 2014.
- ↑ 14.0 14.1 14.2 Domenick Yoney (2013-02-20). "Tesla delivered 2,650 Model S EVs last year, Musk confident of profit in Q1 and beyond". Autoblog Green. Retrieved 2014-01-04. Around 2,650 Model S cars were delivered by Tesla during 2012, mostly in the U.S. and some units delivered in Canada.
- ↑ 15.0 15.1 15.2 15.3 15.4 Mark Rogowsky (2014-01-16). "Tesla Sales Blow Past Competitors, But With Success Comes Scrutiny". Forbes. Retrieved 2014-01-18. Almost 18,000 units were sold in the U.S. in 2013.
- ↑ 16.0 16.1 16.2 16.3 16.4 16.5 "Notice 2009-89: New Qualified Plug-in Electric Drive Motor Vehicle Credit". Internal Revenue Service. 2014-08-15. Retrieved 2014-09-22.
- ↑ 17.0 17.1 "Consumer Energy Tax Incentives: Plug-In Hybrid Conversion Kits". U.S. Department of Energy. Retrieved 2010-04-01.
- ↑ 18.0 18.1 18.2 18.3 18.4 Phuong Le (2014-11-27). "Inslee pushes incentives for electric cars". The Associated Press (The Seattle Times). Retrieved 2014-11-29.
- ↑ 19.0 19.1 Danny King (2013-04-10). "US public charging stations increase by 9% in first quarter". Autoblog Green. Retrieved 2013-09-02.
- ↑ 20.0 20.1 20.2 20.3 20.4 U.S. Department of Energy (2013-12-25). "Alternative Fueling Station Counts by State". Alternative Fuels Data Center (AFDC). Retrieved 2013-12-31. The AFDC counts electric charging units or points, or EVSE, as one for each outlet available, and does not include residential electric charging infrastructure.
- ↑ 21.0 21.1 21.2 Jerry Mitlitski (2011-02-18). "Raising the Volt-Age: Is Obama's Goal of 1 Million Electric Vehicles on U.S. Highways by 2015 Realistic?". Scientific American. Retrieved 2012-05-11.
- ↑ 22.0 22.1 22.2 Bill Vlasic and Matthew L. Wald (2012-06-11). "Shaky Battery Maker Claims an Advance". The New York Times. Retrieved 2012-06-12.
- ↑ 23.0 23.1 23.2 Sharyl Attkisson (2012-06-02). "Electric vehicles fall drastically short of Obama's 1 million goal". CBS News. Retrieved 2012-06-12.
- ↑ David Shepardson (2012-04-17). "Battery-powered autos proving a tough sell". The Detroit News. Retrieved 2012-06-12.
- ↑ 25.0 25.1 Staff (2012-03-23). "Governor Brown Announces $120 Million Settlement To Fund Electric Car Charging Stations Across California". Office of Governor Edmund G. Brown Jr. Retrieved 2014-09-22.
- ↑ 26.0 26.1 26.2 26.3 26.4 26.5 26.6 Marisa Lagos (2014-09-22). "Brown signs several clean-air vehicle bills". San Francisco Chronicle. Retrieved 2014-09-22.
- ↑ 27.0 27.1 27.2 27.3 Melanie Mason and Patrick McGreevy (2014-09-21). "Gov. Jerry Brown signs bills to boost purchases of electric cars". Los Angeles Times. Retrieved 2014-09-21.
- ↑ U.S. Department of Energy (February 2011). "One Million Electric Vehicles By 2015 - February 2011 Status Report" (PDF). Office of Energy Efficiency and Renewable Energy (EERE). Retrieved 2013-02-27.
- ↑ 29.0 29.1 Reuters (2013-01-31). "U.S. resets expectations for electric vehicle sales". Long Island Newsday. Retrieved 2013-02-24.
- ↑ 30.0 30.1 Pike Research (2012-07-02). "Pike Research projects plug-in sales to fall short of US 2015 target; strong growth through 2020". Green Car Congress. Retrieved 2013-03-03.
- ↑ Woodyard, Chris (2010-07-14). "Obama pushes electric cars, battery power this week". USA Today.
- ↑ "EERE News: Recovery Act Announcement: President Obama Announces $2.4 Billion for Electric Vehicles". Apps1.eere.energy.gov. 2009-03-19. Retrieved 2009-09-19.
- ↑ "Obama's Pitches for Plug-In Hybrids: Videos, Transcripts, Clips". Calcars.org. Retrieved 2009-09-19.
- ↑ "EERE News: President Obama Announces $2.4 Billion for Electric Vehicles". Apps1.eere.energy.gov. 2009-03-19. Retrieved 2009-09-19.
- ↑ "Mayor Office Press Room". Sfgov.org. Retrieved 2009-09-19.
- ↑ Woodyard, Chris (2008-11-28). "Local authorities get in on push for electric cars". Usatoday.Com. Retrieved 2009-09-19.
- ↑ Leighton W. Klein (2013-03-14). "Cost-effectiveness of Plug-in Hybrid Electric Vehicle Battery Capacity and Charging Infrastructure Investment for Reducing U.S. Gasoline Consumption". JournalistsResource.org. Retrieved 2013-03-27.
- ↑ Peterson, Scott B.; Michalek, Jeremy J. (2013). "Cost-effectiveness of Plug-in Hybrid Electric Vehicle Battery Capacity and Charging Infrastructure Investment for Reducing U.S. Gasoline Consumption". Energy Policy 52: 429–438. doi:10.1016/j.enpol.2012.09.059. Retrieved 2013-03-27.
- ↑ 39.0 39.1 "Nissan will sell electric car for just over $25K". Yahoo Finance. 2010-03-30. Retrieved 2010-03-30.
- ↑ John Voelcker (2009-12-14). "Toyota Prius Plug-In Hybrid On Sale in 2011, Less Than $10K More". GreenCarReports.com. Retrieved 2010-04-18.
- ↑ "CVRP Eligible Vehicles". Center for Sustainable Energy California. Retrieved 2013-01-21.
- ↑ "Clean Vehicle Rebate Project". Center for Sustainable Energy. Retrieved 2010-04-01.
- ↑ "CVRP Eligible Vehicles". Center for Sustainable Energy California. Retrieved 2010-06-08.
- ↑ 44.0 44.1 "Clean Vehicle Rebate Project FAQ: Changes in CVRP FY 2011-2012". Center for Sustainable Energy California. Retrieved 2011-05-22.
- ↑ John Voelcker (2011-02-08). "Senator Stabenow: $7,500 Electric-Car Credit Should Be Rebate". GreenCarReports.com. Retrieved 2011-02-16.
- ↑ "Obama FY 2012 budget proposes big boost for EVs and EV technology, cuts for hydrogen". Green Car Congress. 2011-02-14. Retrieved 2011-02-16.
- ↑ Nick Chambers (2011-02-09). "White House Pushes For a $7,500 Instant Cash Rebate Towards Electric Car Purchases". PluginCars.com. Retrieved 2011-02-16.
- ↑ David Sheparson (2014-03-04). "White House: Boost EV, alternative vehicle tax credits to $10,000". The Detroit News. Retrieved 2014-03-10.
- ↑ David Shepardson (2014-09-19). "Top Democrat urges new EV incentives". The Detroit News. Retrieved 2014-09-19.
- ↑ Sarah Shelton (2015-02-03). "White House Seeking Expanded $10,000 Alternative Vehicle Rebate". HybridCars.com. Retrieved 2015-02-03.
- ↑ "US Tax Incentives for Plug-in Hybrids and Electric Cars". HybridCars.com. 2010-03-08. Retrieved 2010-01-04.
- ↑ "Electric Car Charging Station Tax Credit Extended, But at Lower 30% Pre-Stimulus Levels". PluginCars.com. 2010-12-17. Retrieved 2010-12-23.
- ↑ "Federal and Local Incentives for Plug-in Hybrids and Electric Cars". plugincars.com. 2013-05-08. Retrieved 2013-08-11.
- ↑ U.S. Department of Energy (DoE) (2012-03-07). "President Obama Launches EV-Everywhere Challenge as Part of Energy Department's Clean Energy Grand Challenges". DoE. Retrieved 2013-03-01.
- ↑ Danny King (2012-03-11). "Obama's EV Everywhere plan sets 2022 goals for U.S.-made electric vehicles". Autoblog Green. Retrieved 2013-03-01.
- ↑ 56.0 56.1 56.2 56.3 56.4 U.S. Department of Energy (January 2013). "EV Everywhere Grand Challenge Blueprint" (PDF). Office of Energy Efficiency and Renewable Energy (EERE), US DoE. Retrieved 2013-02-24. See pp. 5.
- ↑ 57.0 57.1 Jeff Cobb (2012-12-07). "Energy Department Backs Plan To Develop Five-Times More Energy Dense EV Battery". HybridCars.com. Retrieved 2013-03-01.
- ↑ Benson Kong (2012-12-02). "New JCESR Consortium Aims to Make U.S. a Battery Powerhouse". Motor Trend. Retrieved 2013-03-01.
- ↑ U.S. Department of Energy (January 2014). "EV Everywhere Grand Challenge: Road to Success" (PDF). U.S. DoE. Retrieved 2014-09-25.
- ↑ Mohana Ravindranath (2013-02-04). "Five take-aways from the Washington Auto Show's energy efficiency policy summit". The Washington Post. Retrieved 2013-03-01.
- ↑ Sebastian Blanco (2013-01-31). "EV Everywhere expands with Workplace Charging Challenge". Autoblog Green. Retrieved 2013-03-01.
- ↑ "Army announces historic electric vehicle lease". Army.mil. 2009-01-20. Retrieved 2009-09-19.
- ↑ "Los Angeles AFB to go electric". af.mil. 2011-08-31. Retrieved 2011-10-04.
- ↑ Loveday, Eric (May 2013). "US Military to Soon Own Largest Federal Fleet of V2G Plug-In Vehicles". Inside EVs. Retrieved 17 September 2014.
- ↑ EERE Network News, (2009-11-18). "United States and China to Cooperate on Clean Energy". U.S. Department of Energy. Retrieved 2014-09-19.
- ↑ 66.0 66.1 66.2 66.3 66.4 66.5 66.6 66.7 66.8 66.9 United States Environmental Protection Agency and U.S. Department of Energy (2014-09-10). "Model Year 2014 Fuel Economy Guide - Electric vehicles & Plug-in Hybrid Electric Vehicles (updated September 2014)" (PDF). fueleconomy.gov. Retrieved 2014-09-12. pp. 33-36
- ↑ 67.0 67.1 67.2 United States Environmental Protection Agency and U.S. Department of Energy (2014-07-04). "Compare Side-by-Side: 2014 BMW i3 BEV & 2014 BMW i3 REx". fueleconomy.gov. Retrieved 2014-07-26.
- ↑ 68.0 68.1 U. S. Environmental Protection Agency and U.S. Department of Energy (2014-07-25). "Most Efficient EPA Certified Vehicles". fueleconomy.gov. Retrieved 2014-07-26. Current Model Year excludes all-electric vehicles.
- ↑ U. S. Environmental Protection Agency and U.S. Department of Energy (2014-03-12). "2013 Scion iQ EV". Fueleconomy.gov. Retrieved 2014-03-14.
- ↑ Associated Press (2012-09-24). "Toyota beefs up green vehicles, plans electric car for this year, fuel cell vehicle by 2015". Toledo Blade. Retrieved 2013-03-27.
- ↑ UC Irvine Press Release (2013-03-21). "UC Irvine’s car-sharing program charges ahead". University of California, Irvine. Retrieved 2013-03-28.
- ↑ Sebastian Blanco (2013-09-12). "City CarShare fires up Dash carsharing network with 30 Scion iQ EVs". Autoblog Green. Retrieved 2013-09-16.
- ↑ U. S. Environmental Protection Agency and U.S. Department of Energy (2014-03-12). "2014 Chevrolet Spark EV". Retrieved 2014-03-24.
- ↑ U. S. Environmental Protection Agency and U.S. Department of Energy (2014-03-12). "2013/2014 Honda Fit EV". Fueleconomy.gov. Retrieved 2014-03-14.
- ↑ John Voelcker (2013-10-23). "2014 BMW i3 Electric Car: Why California Set Range Requirements, Engine Limits". Green Car Reports. Retrieved 2014-01-19.
- ↑ John Voelcker (2014-05-02). "2014 BMW i3 Range-Extended Model Gets Full $2,500 CA Rebate For Electric Cars". Green Car Reports. Retrieved 2014-05-02.
- ↑ 77.0 77.1 77.2 77.3 77.4 U. S. Environmental Protection Agency and U.S. Department of Energy (2014-07-25). "Fueleconomy.gov's Top Ten EPA-Rated Fuel Sippers (1984 to present) - All Years". fueleconomy.gov. Retrieved 2014-07-26. Excludes all-electric vehicles. Click on the tab "EPA Rated - All Years. The 2013-2014 Chevrolet Volt has a combined fuel economy of 62 mpg-e.
- ↑ U. S. Environmental Protection Agency and U.S. Department of Energy (2014-11-14). "2015 Volkswagen e-Golf". Fueleconomy.gov. Retrieved 2014-11-15.
- ↑ U. S. Environmental Protection Agency and U.S. Department of Energy (2014-03-12). "2013/2014 Fiat 500e". Fueleconomy.gov. Retrieved 2014-03-14.
- ↑ 80.0 80.1 U.S. Environmental Protection Agency and U.S. Department of Energy (2014-03-12). "2013 Nissan Leaf/2014 Nissan Leaf". Fueleconomy.gov. Retrieved 2014-03-12.
- ↑ U. S. Environmental Protection Agency and U.S. Department of Energy (2014-03-12). "2014 Honda Accord Plug-in Hybrid". Fueleconomy.gov. Retrieved 2014-03-13.
- ↑ 82.0 82.1 82.2 82.3 82.4 82.5 82.6 82.7 82.8 U. S. Environmental Protection Agency (October 2014). "Light-Duty Automotive Technology, Carbon Dioxide Emissions, and Fuel Economy Trends: 1975 Through 2014" (PDF). EPA. Retrieved 2014-10-11. See Table 7.2 - MY 2014 Alternative Fuel Vehicle Powertrain and Range; pp. 98; Table 7.3 for overall fuel economy (mpg-e), pp. 100; Table 7.4 for tailpipe CO2 emissions, pp. 102; and Table 7.5 for upstream CO2 Emission, pp. 105.
- ↑ U.S. Environmental Protection Agency and U.S. Department of Energy (2014-11-14). "2012/2013/2014 Mitsubishi i-MiEV". Fueleconomy.gov. Retrieved 2014-11-15.
- ↑ 84.0 84.1 U. S. Environmental Protection Agency and U.S. Department of Energy (2014-03-12). "2011 and 2013/2014 smart fortwo electric drive cabriolet & coupe". Fueleconomy.gov. Retrieved 2014-03-12.
- ↑ U. S. Environmental Protection Agency and U.S. Department of Energy (2014-09-12). "2015 Kia Soul Electric". Fueleconomy.gov. Retrieved 2014-09-12.
- ↑ Eric Loveday (2014-09-12). "2015 Kia Soul EV Gets Official EPA Range Rating Of 93 Miles – City Range Will Blow Your Mind". InsideEVs.com. Retrieved 2014-09-12.
- ↑ U. S. Environmental Protection Agency and U.S. Department of Energy (2014-03-12). "2012/2013/2014 Ford Focus Electric". Fueleconomy.gov. Retrieved 2014-03-14.
- ↑ U.S. Environmental Protection Agency and U.S. Department of Energy (2014-03-12). "2011 BMW Acive E". Fueleconomy.gov. Retrieved 2014-03-14.
- ↑ U.S. Environmental Protection Agency and U.S. Department of Energy (2012-11-30). "2012 Nissan Leaf". Fueleconomy.gov. Retrieved 2012-12-02.
- ↑ U.S. Environmental Protection Agency and U.S. Department of Energy (2014-03-12). "2014 Chevrolet Volt/2013 Chevrolet Volt". Fueleconomy.gov. Retrieved 2014-03-12.
- ↑ 91.0 91.1 U. S. Environmental Protection Agency and U.S. Department of Energy (2014-03-12). "2013/2014 Tesla Model S (60 kW-hr battery pack) 2012/2014 Tesla Model S (85 kW-hr battery pack)". Fueleconomy.gov. Retrieved 2014-03-14.
- ↑ U. S. Environmental Protection Agency and U.S. Department of Energy (2014-07-25). "Compare Side-by-Side - 2012/2013/2014 Toyota Prius Plug-in Hybrid". Fueleconomy.gov. Retrieved 2014-07-26.
- ↑ U. S. Environmental Protection Agency and U.S. Department of Energy (2014-03-12). "2012 Chevrolet Volt/2011 Chevrolet Volt". Fueleconomy.gov. Retrieved 2014-03-12.
- ↑ U. S. Environmental Protection Agency and U.S. Department of Energy (2014-03-12). "2013 Tesla Model S (40 kW-hr battery pack)". Fueleconomy.gov. Retrieved 2014-03-15.
- ↑ "Tesla Model S Sales Exceed Target" (Press release). Tesla Motors. 2013-03-31. Retrieved 2014-03-15.
- ↑ 96.0 96.1 U. S. Environmental Protection Agency and U.S. Department of Energy (2014-06-12). "Compare Side-by-Side - 2013/14 Ford C-Max Plug-in Hybrid and 2013/14 Ford Fusion Plug-in Hybrid". Fueleconomy.gov. Retrieved 2014-06-12.
- ↑ 97.0 97.1 Jeff Cobb (2014-06-12). "Ford Downgrades Hybrid Model MPG Ratings". HybridCars.com. Retrieved 2014-06-12.
- ↑ U.S. Environmental Protection Agency and U.S. Department of Energy (2014-07-25). "2014 Mercedes-Benz B-Class Electric Drive". Fueleconomy.gov. Retrieved 2014-07-26.
- ↑ U.S. Environmental Protection Agency and U.S. Department of Energy (2014-03-07). "2014 Cadillac ELR". Fueleconomy.gov. Retrieved 2014-03-10.
- ↑ U.S. Environmental Protection Agency and U.S. Department of Energy (2014-03-12). "2012/2013/2014 Toyota RAV4 EV". Fueleconomy.gov. Retrieved 2014-03-14.
- ↑ U.S. Environmental Protection Agency and U.S. Department of Energy (2014-08-21). "2014 BMW i8". Fueleconomy.gov. Retrieved 2014-08-21.
- ↑ U.S. Environmental Protection Agency and U.S. Department of Energy (2014-03-12). "2012/13 CODA Automotive CODA". Fueleconomy.gov. Retrieved 2014-03-14.
- ↑ U.S. Environmental Protection Agency and U.S. Department of Energy (2014-05-30). "2015 Porsche 918 Spyder". Fueleconomy.gov. Retrieved 2014-06-01.
- ↑ U.S. Environmental Protection Agency and U.S. Department of Energy (2014-03-12). "2012 BYD e6". Fueleconomy.gov. Retrieved 2014-03-12.
- ↑ U. S. Environmental Protection Agency and U.S. Department of Energy (2014-03-12). "Compare Side-by-Side - 2012 Fisker Karma". Fueleconomy.gov. Retrieved 2014-03-14.
- ↑ 106.0 106.1 U. S. Environmental Protection Agency and U.S. Department of Energy (2014-04-02). "Compare Side-by-Side - Porsche Panamera S E-Hybrid". Fueleconomy.gov. Retrieved 2014-04-05. Gasoline price was adjusted to $3.81 per gallon for comparison purposes to reflect the same price used for the other cars shown in this table.
- ↑ U. S. Environmental Protection Agency and U.S. Department of Energy (2014-12-05). "Compare Side-by-Side - Porsche Cayenne S E-Hybrid". Fueleconomy.gov. Retrieved 2014-12-11. Gasoline price was adjusted to $3.81 per gallon for comparison purposes to reflect the same price used for the other cars shown in this table.
- ↑ 108.0 108.1 U. S. Environmental Protection Agency and U.S. Department of Energy (2014-09-12). "Compare Side-by-Side - 2014 McLaren Automotive P1". Fueleconomy.gov. Retrieved 2014-09-12. Gasoline price was adjusted to $3.81 per gallon for comparison purposes to reflect the same price used for the other plug-in hybrid cars shown in this table.
- ↑ Nick Bunkley (2010-11-22). "Nissan Says Its Electric Leaf Gets Equivalent of 99 M.P.G.". The New York Times. Retrieved 2014-03-15.
- ↑ Fred Meier (2010-11-24). "Volt is rated 93 mpg on electricity alone, 37 mpg on gas generator". USA Today. Retrieved 2014-03-15.
- ↑ 111.0 111.1 Brad Berman (2009-07-29). "Confusion Over MPG Ratings for Electric Cars". HybridCars.com. Retrieved 2014-03-15.
- ↑ "Why are the VOLT and LEAF EVs measured in Miles Per Gallon". Electric Vehicle News. 2009-08-15. Retrieved 2014-03-15.
- ↑ Don Sherman (2008-11-13). "Cranking the Volt to 100 M.P.G.". The New York Times. Retrieved 2014-03-15.
- ↑ 114.0 114.1 114.2 Sperling, Daniel and Deborah Gordon (2009). Two billion cars: driving toward sustainability. Oxford University Press, New York. pp. 22–26 and 114–139. ISBN 978-0-19-537664-7.
- ↑ David B. Sandalow, ed. (2009). Plug-In Electric Vehicles: What Role for Washington? (1st. ed.). The Brookings Institution. pp. 2–5. ISBN 978-0-8157-0305-1.See definition on pp. 2.
- ↑ 116.0 116.1 116.2 116.3 Don Anair and Amine Mahmassani (April 2012). "State of Charge: Electric Vehicles' Global Warming Emissions and Fuel-Cost Savings across the United States" (PDF). Union of Concerned Scientists. Retrieved 2012-04-16. pp. 16-20.
- ↑ 117.0 117.1 Paul Stenquist (2012-04-13). "How Green Are Electric Cars? Depends on Where You Plug In". The New York Times. Retrieved 2012-04-14.
- ↑ 118.0 118.1 Paul Stenquist (2012-04-13). "Carbon In, Carbon Out: Sorting Out the Power Grid". The New York Times. Retrieved 2012-04-14. See map for regional results
- ↑ 119.0 119.1 Paul Stenquist (2012-04-13). "When it Comes to Carbon Dioxide, Lower is Better and Zero is Perfect". The New York Times. Retrieved 2012-04-14.
- ↑ "Compare side-by-side". U.S. Department of Energy and U.S. Environmental Protection Agency. 2012-04-13. Retrieved 2012-04-15. Energy and Environment tab: cars selected Toyota Prius, Prius c, Honda Civic Hybrid, and Chevrolet Cruze automatical, all model year 2012.
- ↑ Paul Stenquist (2014-09-19). "Coal Fades, So Electrics Get Cleaner". The New York Times. Retrieved 2014-10-12.
- ↑ Don Anair (2014-09-16). "How do EVs Compare with Gas-Powered Vehicles? Better Every Year….". Union of Concerned Scientists (UCS). Retrieved 2014-10-12.
- ↑ "The ZEV’s invisible tailpipe - Are zero-emission vehicles cleaner than petrol cars? It all depends...". The Economist. 2014-11-24. Retrieved 2014-12-08.
- ↑ 124.0 124.1 124.2 Graff Zivina, Joshua S.; Kotchenb, Matthew J.; Mansur, Erin T. (November 2014). "Spatial and temporal heterogeneity of marginal emissions: Implications for electric cars and other electricity-shifting policies". Journal of Economic Behavior and Organization 107 (Part A): 248–268. doi:10.1016/j.jebo.2014.03.010. Published on line 2014-03-24. See pp. 251
- ↑ Automotive Science Group (ASG) (2014-02-04). "Life-cycle Assessment of 1,300 Models Reveals Best of 2014". ASG Press Room. Retrieved 2014-02-22.
- ↑ Eric Loveday (2014-02-11). "Nissan LEAF Has Smallest Lifecycle Footprint of Any 2014 Model Year Automobile Sold in North America". Inside EVs. Retrieved 2014-02-22.
- ↑ Mark Kane (2013-04-22). "Sweden and UK Drive Growth Of CHAdeMO Chargers In Europe To 1,117". InsideEVs.com. Retrieved 2014-04-28.
- ↑ Stacy C. Davis, Susan W. Diegel, and Robert G. Boundy (July 2014). "Transportation Energy Data Book Edition 33" (PDF). Office of Energy Efficiency and Renewable Energy, U.S. Department of Energy. Retrieved 2014-09-02. See Table 6.5: Hybrid and Plug-in Vehicle Sales, 1999-2013, pp. 6-9.
- ↑ 129.0 129.1 Jeff Cobb (2014-10-02). "September 2014 Dashboard". HybridCars.com and Baum & Associates. Retrieved 2014-10-02. A total of 87,949 plug-in electric cars were sold during the first nine months of 2014, consisting of 43,803 all-electric cars and 44,146 plug-in hybrids. See sections: "U.S. Plug-in Hybrid sales for September 2014" and "U.S. Battery Electric sales for September 2014"
- ↑ 130.0 130.1 130.2 Electric Drive Transportation Association (EDTA) (January 2014). "Electric drive vehicle sales figures (U.S. Market) - EV sales". EDTA. Retrieved 2015-01-11.
- ↑ 131.0 131.1 HybridCars.com and Baum & Associates. "HybridCars Dashboard". HybridCars.com. Retrieved 2015-03-15.
- ↑ Jeff Cobb (2014-09-09). "Americans Buy Their 250,000th Plug-In Car". HybridCars.com. Retrieved 2014-09-09. As of August 2014, sales are led by the Chevrolet Volt plug-in hybrid with 67,698 units, followed by the Nissan Leaf electric car with 61,063 units. The total of 250,609 units sold includes 1,800 Roadsters, 1,600 Fisker Karmas, and 500 Mini Es usually not captured by most statistics.
- ↑ 133.0 133.1 133.2 133.3 Jeff Cobb (2014-01-03). "US Plug-in Vehicle Sales Surge in 2013". HybridCars.com. Retrieved 2014-01-04.
- ↑ John Gartner (2014-05-13). "Luxury EV Sales Outpace Overall Market". Navigant Research. Retrieved 2014-09-20.
- ↑ Jay Cole (2014-06-04). "Electric Vehicle Sales In The US Hit All-Time High In May". InsideEVs.com. Retrieved 2014-06-04.
- ↑ Jeff Cobb (2014-06-04). "May 2014 Dashboard". HybridCars.com and Baum & Associates. Retrieved 2014-06-04. A total of 43,144 plug-in electric cars were sold during the first five months of 2014, consisting of 20,256 all-electric cars and 22,618 plug-in hybrids. See sections: "May 2014 Battery Electric Car Sales Numbers" and "May 2014 Plug-In Hybrid Car Sales Numbers"
- ↑ 137.0 137.1 Jeff Cobb (2013-11-04). "October 2013 Dashboard". HybridCars.com and Baum & Associates. Retrieved 2013-11-10. See the section: October 2013 Plug-in Electric Car Sales Numbers: A total of 10,191 plug-in electric cars were delivered in October with a market share of 0.85% of new car sales.
- ↑ Cole, Jay (2014-07-01). "June 2014 Plug-In Electric Vehicle Sales Report Card". InsideEvs.com. Retrieved 2014-07-01.
- ↑ International Energy Agency, Clean Energy Ministerial, and Electric Vehicles Initiative (April 2013). "Global EV Outlook 2013 - Understanding the Electric Vehicle Landscape to 2020" (PDF). International Energy Agency. Retrieved 2013-04-20. See pp. 11-12.
- ↑ Siddharth Philip (2013-03-12). "GM's Chevy Volt Outsold Nissan Leaf Last Year, BNEF Says". Bloomberg L.P. Retrieved 2013-03-30.
- ↑ Jerry Hirsch (2012-07-13). "Plug-in hybrid sales soar; all-electric cars stay in low gear". Los Angeles Times. Retrieved 2013-02-12.
- ↑ "Clean Vehicle Rebate Project Statistics". California Center for Sustainable Energy. 2014-08-26. Retrieved 2014-09-08. As of 26 August 2014, a total of 38,989 all-electric vehicles and 34,466 plug-in hybrids have been benefited with the clean rebate. In addition, about 2,300 Chevrolet Volts were sold in California before February 2012 which were not eligible for the rebate.
- ↑ Danny King (2012-12-17). "Plug-in hybrids outselling pure EVs in California". Autoblog Green. Retrieved 2013-02-12.
- ↑ California Auto Outlook (August 2013). "Hybrids take 7% of California market in 1H 2013; PHEVs 0.7%; EVs 1.1%". Green Car Congress. Retrieved 2013-09-02. Volume 9, Number 3.
- ↑ California Auto Outlook (2013-08-07). "California's New Vehicle Market Continues to Post Impressive Gains". California New Car Dealer Association. Retrieved 2013-09-02.
- ↑ Bradley Berman (2012-12-21). "Make Way for Kilowatts: A Growing-Up Year for Plug-Ins". The New York Times. Retrieved 2013-02-12.
- ↑ 147.0 147.1 147.2 Pike Research (2013-01-03). "Worldwide Electric Vehicle Sales to Reach 3.8 Million Annually by 2020". Pike Research. Retrieved 2013-03-03.
- ↑ Navigant (2013-06-11). "Navigant forecasts hybrids to account for almost 4% of global LDV sales by 2020, plug-ins 3%". Green Car Congress. Retrieved 2013-06-19.
- ↑ David Shepardson (2014-01-03). "2013 electric vehicle sales jump 84%". The Detroit News. Retrieved 2014-01-04.
- ↑ Navigant Research (2014-01-08). "Navigant Research forecasts new EV global sales of > 346,000 units in 2014; 10 predictions for the year". Green Car Congress. Retrieved 2014-01-09.
- ↑ Norihiko Shirouzu, Yoko Kubota and Paul Lienert (2013-02-04). "Insight: Electric cars head toward another dead end". Reuters. Retrieved 2013-02-24.
- ↑ Argonne National Laboratory (2013-01-14). "Fact #762: Sales from Introduction: Hybrid Vehicles vs. Plug-in Vehicles". Office of Energy Efficiency and Renewable Energy. Retrieved 2013-02-24.
- ↑ Melissa C. Lott (2013-02-20). "Electric Vehicle Deployment – Where Should We Be Today?". Scientific American. Retrieved 2013-02-24.
- ↑ Pike Research (2012-10-31). "Ford, Toyota Will Lead Plug-in Electric Vehicle Sales in the U.S. Through 2020, Forecasts Pike Research". Market Watch. Retrieved 2013-03-03.
- ↑ 155.0 155.1 155.2 155.3 155.4 155.5 155.6 155.7 155.8 Jay Cole (2014-09-13). "Exclusive: Georgia Leads US In EV Adoption For 2014". InsideEVs.com. Retrieved 2014-09-15. Source: IHS Automotive with R.L. Polk & Company new vehicle registration data.
- ↑ 156.0 156.1 156.2 156.3 156.4 156.5 156.6 Mike Ramsey (2014-06-02). "States With the Most and Least Electric-Vehicle Sales". The Wall Street Journal. Retrieved 2014-09-20. Sales of new all-electric vehicles in the 12 months that ended March 31, 2014. Source: IHS Automotive.
- ↑ 157.0 157.1 157.2 157.3 157.4 157.5 Mike Ramsey (2014-06-04). "Atlanta's Incentives Lift Electric Car Sales". The Wall Street Journal. Retrieved 2014-09-28. Sales of new all-electric vehicles in the 12 months that ended March 31, 2014. Source: IHS Automotive.
- ↑ David C. Smith (2013-08-07). "Scrappage Rate Hits Historic High, Bodes Well for Future". Wards Auto. Retrieved 2013-08-14.
- ↑ Gene Balk (2013-08-20). "Seattle among cities that dominate U.S. electric vehicle sales". The Seattle Times. Retrieved 2013-10-01.
- ↑ Greg Asciutto (2013-09-25). "Santa Monica a top city for electric vehicles". Santa Monica Daily Press. Retrieved 2013-09-29.
- ↑ Jaclyn Trop (2013-09-20). "Santa Monica Bets on Electric Cars, but Consumers Are Slow to Switch". The New York Times. Retrieved 2013-09-29.
- ↑ California Energy Commission (2013-03-01). "California Energy Commission awards $4.5M to ARB for more clean vehicle rebates". Green Car Congress. Retrieved 2013-03-03.
- ↑ 163.0 163.1 163.2 163.3 Jeff Cobb (2015-03-18). "Californians Bought More Plug-in Cars Than China Last Year". HybridCars.com. Retrieved 2015-03-18.
- ↑ 164.0 164.1 164.2 164.3 164.4 164.5 California New Car Dealers Association (CNCDA) (February 2015). "California Auto Outlook Covering Fourth Quarter 2014: New Light Vehicle Registrations Likely to Exceed 1.9 million units in 2015" (PDF). CNCDA. Retrieved 2015-03-15. Registrations through December 2014.
- ↑ Jeff Cobb (2015-02-18). "Top 6 Plug-In Vehicle Adopting Countries – 2014". HybridCars.com. Retrieved 2015-03-15.
- ↑ "Zero-Emission Vehicle Legal and Regulatory Activities: The ZEV Program Timeline". California Air Resources Board. 2011-10-14. Retrieved 2014-09-22.
- ↑ Jeff Cobb (2015-01-06). "December 2014 Dashboard". HybridCars.com and Baum & Associates. Retrieved 2015-03-15. A total of 118,682 plug-in electric cars were sold in 2014, consisting of 63,325 all-electric cars and 55,357 plug-in hybrids. See sections: "December 2014 Plug-in Hybrid Car Sales Numbers" and "December 2014 Battery Electric Car Sales Numbers"
- ↑ Brad Berman (2011-01-07). "December 2010 Dashboard: Year End Tally". HybridCARS.com. Retrieved 2014-09-20.
- ↑ Nathan Bomey (2012-06-05). "California can't get enough of the Chevy Volt as sales surge". Detroit Free Press. Retrieved 2012-06-06.
- ↑ AutoblogGreen (2011-11-30). "Nissan sells 20,000 Leafs worldwide, 10,000 in U.S. by end of the year". Retrieved 2012-06-11.
- ↑ Nissan News Release (2013-08-26). "Top 15 Nissan LEAF markets in US in 2013". Green Car Congress. Retrieved 2013-09-29.
- ↑ Angelo Young (2014-09-02). "Tesla Motors' Tesla Model S Is Outselling Nissan Leaf In Northern European Markets". International Business Times. Retrieved 2014-09-21.
- ↑ John Voelcker (2013-03-22). "Tesla Model S Update: 3,000th Electric Sedan Delivered In CA". Green Car Reports. Retrieved 2013-03-22.
- ↑ Jay Cole (2013-03-22). "Tesla: Model S Production Now More Than 500 Per Week, Over 12 Million Total Miles Driven So Far". Inside EVs. Retrieved 2013-03-22.
- ↑ Jessica Caldwell (2013-10-31). "Drive by Numbers - Tesla Model S is the vehicle of choice in many of America's wealthiest zip codes". Edmunds.com. Retrieved 2013-11-02.
- ↑ Bloomberg (2014-02-13). "Toyota Prius keeps Calif. sales crown; Tesla moves up". Automotive News. Retrieved 2014-02-16.
- ↑ California New Car Dealers Association (CNCDA) (February 2014). "California Auto Outlook: Fourth Quarter 2013". CNCDA. Retrieved 2014-02-16.
- ↑ California New Car Dealers Association (CNCDA) (August 2014). "California Auto Outlook: Second Quarter 2014" (PDF). CNCDA. Retrieved 2014-09-20. Registrations through June 2014.
- ↑ Hull, Dana (2014-01-29). "With a registration in Jackson, Mississippi, Tesla’s Model S now has sales in all 50 states". SiliconBeat. Retrieved 2014-06-05.
- ↑ Nikki Gordon-Bloomfield (2015-03-24). "BMW: Incentives Key to Helping BMW i3, Other EV Sales Soar". Transport Evolved. Retrieved 2015-03-28.
- ↑ California Department of Motor Vehicles (March 2014). "Clean Air Vehicle (CAV) Decals - High Occupancy Vehicle HOV Lane Usage". DMV California. Retrieved 2014-03-23.
- ↑ 183.0 183.1 California Air Resources Board (CARB) (2014-05-13). "Eligible vehicle list - Single occupant carpool lane sticker". CARB. Retrieved 2014-07-12.
- ↑ Jay Cole (2014-06-23). "California Ups HOV Green Sticker Program By 15,000 to 55,000 Total". InsideEVs.com. Retrieved 2014-07-12.
- ↑ 185.0 185.1 Mike Millikin (2014-09-22). "California governor signs 6 bills to advance state’s electric vehicle market; HOT and HOV benefits". Green Car Congress. Retrieved 2014-09-23.
- ↑ 186.0 186.1 186.2 186.3 186.4 Clean Vehicle Rebate Project (2014-03-10). "Clean Vehicle Rebate Project Statistics". California Center for Sustainable Energy. Retrieved 2014-03-23.
- ↑ Alexi Friedman (2014-06-29). "Report urges NJ must do more to promote 'promise of electric vehicles'". The Star-Ledger. Retrieved 2014-09-27.
- ↑ 188.0 188.1 188.2 Urvaksh Karkaria and Dave Williams (2014-08-08). "Atlanta eyeing incentives to install vehicle chargers". Atlanta Business Chronicle. Retrieved 2014-09-27.
- ↑ Eric Loveday (2013-09-04). "Atlanta Becomes #1 Market for Nissan LEAF". InsideEVs.com. Retrieved 2014-09-28.
- ↑ Georgia Department of Natural Resources. "Low Emission "Alternative Fuel" Vehicle Tax Credits in Georgia". Environmental Protection Division, Air Protection Branch. Retrieved 2014-09-27.
- ↑ "LEV/ZEV and Electric Vehicle Charger Tax Credit Fact Sheet" (PDF). Georgia Department of Natural Resources. 2004-04-14. Retrieved 2014-09-27.
- ↑ Office of Energy Efficiency and Renewable Energy (2014-06-04). "Georgia Laws and Incentives". Alternative Fuels Data Center. Retrieved 2014-09-28.
- ↑ Plug-in Georgia. "Georgia’s Alternative Fuel Vehicle Incentives". PluginGeorgia.com. Retrieved 2014-09-27. Download the Word file "GA_AFV_Incentive_Guide.docx"
- ↑ 194.0 194.1 PlugIncentives.org (2014-09-04). "List of U.S. Electric Vehicle and EVSE Incentives by State". PlugIncentives.org. Retrieved 2014-09-27.
- ↑ 195.0 195.1 Mary Landers (2014-09-26). "Getting a charge from electric vehicles in Savannah". Savannah Morning News. Retrieved 2014-09-28.
- ↑ 196.0 196.1 John Gartner (2013-09-26). "Hawaii Becoming an EV Paradise". PluginCars.com. Retrieved 2013-09-30.
- ↑ 197.0 197.1 Berkeley Law, University of California, Berkeley and Maui College, University of Hawaiʻi (September 2013). "Electric Vehicle Paradise: How Hawai'i Can Lead the World in Deployment" (PDF). Maui Vehicle Alliance (Maui EVA). Retrieved 2013-09-30.
- ↑ Staff (2013-07-19). "Friday Factoid: Hybrid and Electric Cars in Hawaii". The Civil Beat. Retrieved 2014-09-24. Click on graph for annual sales of PEVS.
- ↑ Eric Loveday (2013-07-31). "Electric Vehicles Registrations Up 83% Percent in Hawaii". InsideEVs.com. Retrieved 2014-09-23.
- ↑ Research & Economic Analysis Division, DBEDT (September 2014). "Monthly Energy Trend Highlights August 2014" (PDF). Hawaii State Department of Business, Economic Development & Tourism (DBEDT). Retrieved 2014-09-24. See Registered Taxable Vehicles, pp. 2.
- ↑ "Hawaii's Electric Vehicle (EV) Rebate Program". Retrieved 2010-08-16.
- ↑ Yonan, Alan Jr. (2012-05-18). "State runs short of funds for EV rebate". Honolulu Star-Advertiser. Retrieved 2014-09-20. (subscription required)
- ↑ "New Electric Vehicle Charging Stations Installed at Niagara Falls International Airport to Mark National Drive Electric Week" (Press release). Niagara Falls: New York Power Authority. 2014-09-14. Retrieved 2014-10-25.
- ↑ New York State Department of Transportation (NYSDOT) (2014-07-28). "New York's Clean Pass Program". NYSDOT. Retrieved 2014-10-25.
- ↑ Alternative Fuels Data Center (AFDC) (2014-06-04). "New York: High Occupancy Vehicle (HOV) Lane Exemption and Discount". AFDC. Retrieved 2014-10-25.
- ↑ 206.0 206.1 Jim Motavalli (2013-11-18). "Why some states are selling more electric cars than others". Mother Nature Network. Retrieved 2014-09-28.
- ↑ Brad Berman (2014-08-25). "Federal and Local Incentives for Plug-in Hybrids and Electric Cars". PluinCars.com. Retrieved 2014-09-28.
- ↑ Electric Avenue Initiative (June 2012). "Charging Forward: lessons learned from the first six months at Electric Avenue" (PDF). Portland State University. Retrieved 2014-09-28.
- ↑ National Automobile Dealers Association (NADA) (2014). "NADA Data 2014: Annual Financial Profile of America's Franchised New-Car Dealerships" (PDF). NADA. Retrieved 2014-09-27. See table "Total light vehicles in operation in 2013, by state" pp. 16.
- ↑ 210.0 210.1 210.2 210.3 Stephen Edelstein (2014-05-08). "Texas Electric-Car Purchase Rebates Up To $2,500 To Start Soon". Green Car Reports. Retrieved 2014-09-27.
- ↑ 211.0 211.1 "TCEQ Accepting Applications for Light-Duty Purchase or Lease Incentive Program". Lone Star Clean Fuels Alliance. May 2014. Retrieved 2014-09-27.
- ↑ Texas Commission on Environmental Quality (TCEQ) (2014-09-23). "Light-Duty Motor Vehicle Purchase or Lease Incentive Program". TCEQ. Retrieved 2014-09-27.
- ↑ David Noland (2013-10-22). "Tesla Underground: Texas Franchise Rules Make Model S Owners Skirt The Law". Green Car Reports. Retrieved 2014-09-27.
- ↑ Texas Commission on Environmental Quality (TCEQ) (2014-08-29). "Texas Commission on Environmental Quality (TCEQ) Light-Duty Motor Vehicle Purchase or Lease Incentive Program (LDPLI) - Eligible Vehicle List" (PDF). TCEQ. Retrieved 2014-09-27.
- ↑ Texas River Cities Plug-In Electric Vehicle Initiative (2014-09-16). "Texas River Cities Plug-In Electric Vehicle Initiative". Central Texas Fuel Independence Project. Retrieved 2014-09-27.
- ↑ Texas River Cities Plug-In Electric Vehicle Initiative (TRC). "Executive Summary of the Texas River Cities Plug-in Electric Vehicle Infrastructure Plan" (PDF). Central Texas Fuel Independence Project. Retrieved 2014-09-27.
- ↑ Pecan Street Inc. "The Pecan Street Project". PecanStreet.org. Retrieved 2014-09-27.
- ↑ Bryan Walsh (2014-06-24). "Is This America’s Smartest City?". Time (magazine). Retrieved 2014-09-27.
- ↑ Texas River Cities Plug-In Electric Vehicle Initiative (TRC). "Texas River Cities Plug-in Electric Vehicle Initiative Regional Plan and Final Report" (PDF). Central Texas Fuel Independence Project. Retrieved 2014-09-27. See pp. 3
- ↑ David Biello (2013-06-18). "Will You or the Grid Control Your Electric Car?". Scientific America. Retrieved 2014-09-27.
- ↑ 221.0 221.1 Jay Cole (2014-09-18). "Washington State: Closes In On 10,000 EVs On The Road – Full Map". InsideEVs.com. Retrieved 2014-09-28.
- ↑ Office of Energy Efficiency and Renewable Energy (2014-06-04). "Alternative Fuel Vehicle (AFV) Tax Exemption (Washington state)". Alternative Fuels Data Center. Retrieved 2014-09-28.
- ↑ Puget Sound Energy (PSE). "Electric vehicle charger rebate". PSE. Retrieved 2014-09-28.
- ↑ Office of Energy Efficiency and Renewable Energy (2014-06-04). "Electric Vehicle Supply Equipment (EVSE) Rebate - PSE (Washington state)". Alternative Fuels Data Center. Retrieved 2014-09-28.
- ↑ Jeff Cobb (2014-08-13). "Has The Electrification Revolution Fizzled?". HybridCars.com. Retrieved 2014-08-13.
- ↑ Jeff Cobb (2014-11-14). "Eight Perks of Owning an Electric Car". HybridCars.com. Retrieved 2014-11-15.
- ↑ Eric Loveday (2013-12-20). "Porsche Panamera S E-Hybrid Available at All Porsche Dealerships Nationwide". InsideEVs.com. Retrieved 2014-11-15.
- ↑ Alysha Webb (2014-02-26). "Cadillac ELR Is Selling Nationwide, But At Only About Half of Dealerships". PluginCars.com. Retrieved 2014-11-15.
- ↑ Peter Valdes (2012-10-19). "Year of the electric car blows a fuse". CNN Money. Retrieved 2012-10-22.
- ↑ "December 2011 Dashboard: Sales Still Climbing". HybridCARS.com. 2012-01-09. Retrieved 2012-01-10.
- ↑ Jay Cole (2013-05-05). "Another EV Hits US Shores, As Smart Sells 60 ForTwo Electric Drive Mini-Cars In May". InsideEVs.com. Retrieved 2013-06-06.
- ↑ Timothy Cain (December 2014). "Mitsubishi i MiEV Sales Figures". Good Car Bad Car. Retrieved 2014-12-05.
- ↑ Keith Naughton (2012-03-02). "Ford Says Focus Electric Car Rated at 105 MPG Equivalent by EPA". Bloomberg News. Retrieved 2012-03-02.
- ↑ "Chevy Volt continues to lead plug-in sales in US in July". Green Car Congress. 2012-08-03. Retrieved 2012-08-04. 8 unites were delivered in December 2011.
- ↑ Sebastian Blanco (2012-03-13). "Ford says selling 10 Focus Electrics in three months is "on track"". Autoblog Green. Retrieved 2012-03-16.
- ↑ John Voelcker (2012-03-09). "2012 Ford Focus Electric: 105 MPGe, 76-Mile Range...10 Sales". Green Car Reports. Retrieved 2012-03-16.
- ↑ Toyota News Release (2012-02-28). "Prius Plug-In eligibile for a $1,500 California consumer incentive plus $2,500 Federal tax credit". Green Car Congress. Retrieved 2012-02-29.
- ↑ Toyota USA (2012-09-11). "Toyota Prius Plug-In Model Helping Propel Hybrid Cause". Toyota Newsroom. Retrieved 2012-09-12.
- ↑ Zach McDonald (2012-07-20). "Honda Registers First Fit EV Delivery". Plugincars.com. Retrieved 2012-07-21.
- ↑ John Voelcker (2014-07-29). "Honda Ends Three Green Models For 2015: Insight, Fit EV, FCX Clarity". Green Car Reports. Retrieved 2014-08-20.
- ↑ Brad Berman (2012-01-16). "Toyota Confirms Limited Production of Electric RAV4 and Scion iQ in 2012". PluginCars.com. Retrieved 2012-01-22.
- ↑ Alan Ohnsman (2014-05-10). "Tesla Says Battery-Supply Deal for Toyota RAV4 EV to End". Bloomberg News. Retrieved 2014-08-20.
- ↑ Timothy Cain (December 2014). "Porsche 918 Spyder". Good Car Bad Car. Retrieved 2014-12-05.
- ↑ Porsche Cars North America (2014-12-10). "Porsche exceeds previous year's sales by November - Last unit of the 918 Spyder sold" (Press release). Atlanta: Yahoo! News. Retrieved 2014-12-12.
- ↑ Amy Wilson (2014-10-20). "918 Spyder nearly sold out, Porsche says". Automotive News. Retrieved 2014-11-11.
- ↑ Chris Woodyard (2011-08-03). "Tesla boasts about electric car deliveries, plans for sedan". USA Today. Retrieved 2011-10-04.
- ↑ Tesla Motors (2012-11-05). "Tesla Q3 report: $50M revenues, $111M GAAP net loss, 253 Model S delivered in Q3". Green Car Congress. Retrieved 2012-11-06. Sales during the 3Q 2012: 68 Roadsters and 253 Model S. A total of 575 units sold in Europe through October 2012
- ↑ Tesla Motors (2013-02-20). "Tesla Motors, Inc. – Fourth Quarter & Full Year 2012 Shareholder Letter" (PDF). Tesla Motors. Retrieved 2013-02-13. Most of the remaining Tesla Roadsters were sold during the 4Q 2012, and about 2,650 Model S vehicles during 2012.
- ↑ Tesla Motors (2012-03-07). "Tesla Motors Inc - 10-K - Management's Discussion And Analysis Of Financial Condition And Results of Operations". TMCNet. Retrieved 2013-09-07.
- ↑ 250.0 250.1 Jim Motavalli (2012-01-12). "The Mini-E's True Believer Gets the Keys to the First BMW ActiveE". PluginCars. Retrieved 2012-01-13.
- ↑ Peter Whoriskey (2009-12-24). "Recharging and other concerns keep electric cars far from mainstream". Washington Post. Retrieved 2010-04-03.
- ↑ Brad Berman (2011-03-25). "Think Quietly Sets Price of City Electric Car at $41,695 (Update)". PluginCars.com. Retrieved 2013-09-07.
- ↑ Douglas A. Bolduc (2011-06-22). "Norwegian EV maker Think files for bankruptcy". Automotive News. Retrieved 2011-06-23.
- ↑ John Voelcker (2012-03-30). "Discontinued 2011 Think City Electric Cars For Sale: $22,500". Green Car Reports. Retrieved 2013-09-07.
- ↑ Blanco, Sebastian (2011-12-17). "Wheego delivers first LiFe vehicle in time for Earth Day". AutoblogGreen. Retrieved 2011-01-21.
- ↑ Jim Motavalli (2012-03-14). "Can The Tiny Wheego Win The Electric Car Race?". Forbes. Retrieved 2012-03-22.
- ↑ Jose Pontes (2013-01-06). "USA Full Year 2012". EV Sales. Retrieved 2013-07-19.
- ↑ Jose Pontes (2013-07-19). "USA June 2013". EV Sales. Retrieved 2013-07-20.
- ↑ Bradley Berman (2013-03-13). "Henrik Fisker Resigns From Fisker Automotive". The New York Times. Retrieved 2013-06-18.
- ↑ Angela Greiling Keane (2013-11-23). "Fisker Selling Assets to Li Group at $139 Million Loss to U.S.". Bloomberg (The Washington Post). Retrieved 2013-11-23.
- ↑ John Voelcker (2012-01-18). "BMW ActiveE Electric Car First Drive: What's It Really Like?". Green Car Reports. Retrieved 2012-04-19.
- ↑ Jim Motavalli (2010-09-27). "BMW ActiveE Electric Car Headed for U.S. Trial". New York Times. Retrieved 2010-09-28.
- ↑ Mark Kane (2013-06-11). "Turns Out Coda Sold Way More Electric Sedans Than We Thought! Recall Notice Says So". InsideEVs.com. Retrieved 2013-06-18.
- ↑ Sebastian Blanco (2013-09-14). "Coda Cars brings Sedan EV back at 'substantial discount'". Autoblog Green. Retrieved 2013-10-02.
- ↑ Pike Research (2011-09-23). "Electric Vehicle Penetration Rates to be Highest in Smaller States". Pike Research. Retrieved 2012-06-27.
- ↑ Pike Research (2013-03-01). "Electric Vehicle Geographic Forecasts". Pike Research. Retrieved 2013-03-03.
- ↑ Pike Research (2012-09-18). "Nearly 1 in 4 Plug-In Electric Vehicles Sold in the United States From 2012 to 2020 Will be Sold in California". Pike Research. Retrieved 2013-03-03.
- ↑ Pike Research (2013-01-21). "More than 1.8 Million Plug-In Electric Vehicles Will Be Sold in the Largest 102 U.S. Cities From 2012 to 2020". Pike Research. Retrieved 2013-03-03.
- ↑ Navigant Research (2013-09-10). "Navigant forecasts 18.6% CAGR for plug-ins in North America to 2022; 2.4% new vehicle share in US". Green Car Congress. Retrieved 2013-09-30.
- ↑ Pike Research (2013-01-02). "Pike Research forecasts hybrids and plug-ins to grow to 4% of European market in 2020". Green Car Congress. Retrieved 2013-03-03.
- ↑ "Alternatives to Traditional Transportation Fuels". Energy Information Administration. 2005. Archived from the original on 2007-12-07. Retrieved 2009-04-27
- ↑ Hendrickson, Gail; Kelly, Ross (May 2005). "The Drive to Efficient Transportation" (PDF). Alliance to Save Energy. p. 36. Archived from the original (PDF) on 2007-07-15. Retrieved 2007-08-30
- ↑ "Low-Speed Vehicles". Hawaii Senate. 1999. p. 3. Retrieved 2007-08-30
- ↑ "Advanced Vehicle Testing Activity: Neighborhood Electric Vehicles". United States Department of Energy, Office of Energy Efficiency and Renewable Energy. Retrieved 2007-08-30
- ↑ Alternative Transport Vehicles
- ↑ Polaris Industries (2014-07-24). "Polaris GEM Introduces 2015 Models". The Wall Street Journal. Retrieved 2014-08-09.
External links
- 2013 VehicleTechnologies Market Report, Oak Ridge National Laboratory
- 2013 ZEV Action Plan: A roadmap toward 1.5 million zero-emission vehicles on California roadways by 2025, Office of the Governor of California, February 2013.
- AAA Electric Vehicle webpage (American Automobile Association)
- A Guide to the Lessons Learned from the Clean Cities Community Electric Vehicle Readiness Projects, Clean Cities, U.S. Department of Energy, January 2013.
- California: Beyond cars? Bulletin of the Atomic Scientists, Tom Turrentine, August 2014.
- Clean Car Calculator (Institute for Energy Efficiency)
- Clean Cities - 2014 Vehicle Buyer's Guide, National Renewable Energy Laboratory (NREL), U.S. Department of Energy, December 2013.
- Driving Cleaner - More Electric Vehicles Mean Less Pollution, Environment North Carolina Research & Policy Center, June 2014.
- Early Plug-in Electric Vehicle Sales: Trends, Forecasts, and Determinants, Luskin Center for Innovation, UCLA, July 2012
- Effects of Federal Tax Credits for the Purchase of Electric Vehicles Congressional Budget Office, September 2012
- Effects of Regional Temperature on Electric Vehicle Efficiency, Range, and Emissions in the United States, Tugce Yuksel and Jeremy Michalek, Carnegie Mellon University. 2015
- eGallon Calculator: Compare the costs of driving with electricity, U.S. Department of Energy
- Electric drive vehicle sales figures (U.S. Market) - EV sales, Electric Drive Transportation Association
- Electric Vehicles and Public Charging Infrastructure: Impediments and Opportunities for Success in the United States, Texas A&M Transportation Institute, July 2013
- Electric Vehicle Guide, Sierra Club
- Electric Vehicle Paradise: How Hawai'i Can Lead the World in Deployment, Center for Law, Energy and the Environment at the University of California, Berkeley, September 2013
- Electric Vehicle Sales Analysis, Luskin Center for Innovation, UCLA, August 2013
- Electric Vehicle Timeline: Electric Cars, Plug-In Hybrids, and Fuel Cell Vehicles (1900-2014), Union of Concerned Scientists
- EPA Green Vehicle Guide
- EV Driver Survey Dashboard, California's Clean Vehicle Rebate Project (CVRP)
- EV Everywhere Grand Challenge Blueprint, U.S. Department of Energy, January 2013.
- Evaluating the Impact of High Occupancy Vehicle (HOV) Lane Access on Plug-In Vehicles (PEVs) Purchasing and Usage in California, University of California, Davis, Working Paper UCD-ITS-WP-14-01, 2014
- Fact Sheet: Plug-in Electric Vehicles (2014), Environmental and Energy Study Institute, June 2014.
- Federal Tax Credits For Plug-In Hybrids, Electric Cars: What You Need To Know, The Washington Post, August 2014.
- Global EV Outlook - Understanding the Electric Vehicle Landscape to 2020, International Energy Agency (IEA), April 2013
- Influence of driving patterns on life cycle cost and emissions of hybrid and plug-in electric vehicle powertrains, Carnegie Mellon Vehicle Electrification Group
- Light-Duty Automotive Technology, Carbon Dioxide Emissions, and Fuel Economy Trends: 1975 Through 2014 (See Chapter 7), U.S. Environmental Protection Agency, October 2014.
- Light Duty Electric Drive Vehicles Monthly Sales Updates, Argonne National Laboratory
- List of vehicles eligible for California's single occupant carpool lane stickers
- List of U.S. Electric Vehicle and EVSE Incentives by State, September 2014
- Model Year 2014 Fuel Economy Guide, U.S. Environmental Protection Agency and U.S. Department of Energy, August 2014 (see pp. 33–36 for plug-in electric models available).
- New Car Dealers and Retail Innovation in California’s Plug-In Electric Vehicle Market. Institute of Transportation Studies, University of California, Davis, Working Paper UCD-ITS-WP-14-04, 2014.
- Overcoming Barriers to Electric-Vehicle Deployment: Interim Report (2013), Transportation Research Board, U.S National Research Council
- Plug-In Electric Vehicles: A Case Study of Seven Markets (Norway, Netherlands, California, United States, France, Japan, and Germany), UC Davis, October 2014.
- Plug-In Electric Vehicle Handbook for Workplace Charging Hosts, Clean Cities, U.S. Department of Energy, August 2013
- Plug-in Electric Vehicles: the First Three Years (of the post-modern electric-vehicle era) Dec 2010 — Nov 2013, Luskin Center for Innovation, UCLA, December 2013
- Qualified Plug-In Electric Drive Motor Vehicles (IRC 30D), Internal Revenue Service (IRS), June 2014
- Roadmap to Climate-Friendly Cars: 2013, Climate Central, August 2013.
- State of the Plug-in Electric Vehicle Market, Electrification Coalition, July 2013.
- Supporting the Plug-In Electric Vehicle Market - Best Practices from State Programs, Georgetown Climate Center, December 2014.
- The Great Debate -- All-Electric Cars vs. Plug-In Hybrids, April 2014.
- Top Ten EPA-Rated Fuel Sippers (2014) - including BEVs and PHEVs
- U.S. PEV Sales by Model, Alternative Fuels and Advanced Vehicle Data Center, U.S. Department of Energy
| ||||||||||