Piper's Hill (Kettering BC Ward)
| Piper's Hill Ward (Kettering Borough Council) | |
|---|---|
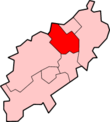
 Piper's Hill within Kettering Borough | |
 Kettering Borough within Northamptonshire |
 Northamptonshire within England |
Piper's Hill Ward is a 2-member ward within Kettering Borough Council which is statistically regarded as a marginal ward between Liberal Democrats and the Conservatives. The ward was last fought at Borough Council level in the 2007 local council elections, in which both seats were won by the Conservatives.
The current councillors are Cllr. Duncan Bain and Cllr. Philip Hollobone MP.
Councillors
Kettering Borough Council Elections 2007
- Duncan Bain (Conservative)
- Philip Hollobone MP (Conservative)
Kettering Borough Council Elections 2003
- Ursula Jones (Conservative)
- Jamie Richardson (Conservative)
Kettering Borough Council Elections 1999
- John Coleman (Liberal Democrat) - served as Mayor from 2000-2001.
- Fred Brown (Conservative)
Current Ward Boundaries (2007-)
Kettering Borough Council Elections 2007
- At the 2007 elections, Piper's Hill ward was enlarged with part of the former Warkton ward, a Labour-held ward.
| Piper's Hill (2 seats) | |||||
|---|---|---|---|---|---|
| Party | Candidate | Votes | % | ±% | |
| Conservative | Philip Hollobone (E) | 836 | 25.7 | ||
| Conservative | Duncan Bain (E) | 740 | 22.7 | ||
| Labour | Eileen Hales | 461 | 14.2 | ||
| Liberal Democrat | John Coleman | 458 | 14.1 | ||
| Labour | Eddie Brace | 457 | 14.0 | ||
| Liberal Democrat | Philip Sharman | 301 | 9.3 | ||
| Turnout | 1,702 | 42.4 | |||
Historic Ward Boundaries (1999-2007)
Kettering Borough Council Elections 2003
| Kettering Borough Council Elections 2003: Piper's Hill Ward | |||||
|---|---|---|---|---|---|
| Party | Candidate | Votes | % | ±% | |
| Conservative | Ursula Jones (E) | 487 | 25.4 | +7.6 | |
| Conservative | Jamie Richardson (E) | 437 | 22.8 | +6.6 | |
| Liberal Democrat | John Coleman | 391 | 20.4 | -0.7 | |
| Liberal Democrat | Helen Gatehouse | 291 | 15.2 | -2.4 | |
| Labour | Philip Hales | 171 | 8.9 | -5.6 | |
| Labour | David Joyce | 140 | 7.3 | -5.5 | |
| Ward Summary | ||||||
|---|---|---|---|---|---|---|
| Party | Votes | % Votes | % Change | Seats | Change | |
| Conservative | 462 | 48.2 | +14.2 | 2 | +1 | |
| Liberal Democrat | 341 | 35.6 | -3.1 | 0 | -1 | |
| Labour | 156 | 16.2 | -11.1 | 0 | 0 | |
| Total Votes Cast | 959 | |||||
| Electorate | 2,392 | |||||
| Turnout | 40.1% | |||||
(Vote count shown is ward average)
Kettering Borough Council Elections 1999
| Kettering Borough Council Elections 1999: Piper's Hill Ward | |||||
|---|---|---|---|---|---|
| Party | Candidate | Votes | % | ±% | |
| Liberal Democrat | John Coleman (E) | 353 | 21.0 | ||
| Conservative | Fred Brown (E) | 299 | 17.8 | ||
| Liberal Democrat | Lilian Coleman | 295 | 17.6 | ||
| Conservative | Mark Ingram | 272 | 16.2 | ||
| Labour | Linda Adams | 243 | 14.5 | ||
| Labour | Sushila Wright | 215 | 12.8 | ||
| Ward Summary | |||||
|---|---|---|---|---|---|
| Party | Votes | % Votes | Seats | Change | |
| Liberal Democrat | 324 | 38.6 | 1 | 0 | |
| Conservative | 286 | 34.0 | 1 | +1 | |
| Labour | 229 | 27.3 | 0 | -1 | |
| Total Votes Cast | 839 | ||||
| Electorate | |||||
| Turnout | |||||
(Vote count shown is ward average)
See also
| ||||||||||