The 2003 Pendle Borough Council election took place on 1 May 2003 to elect members of Pendle Borough Council in Lancashire, England. One third of the council was up for election and the council stayed under no overall control.[1]
After the election, the composition of the council was
Campaign
Before the election the council had 19 Labour, 19 Liberal Democrat and 11 Conservative councillors,[3] with Labour holding power as a minority administration.[4] 18 seats were being elected, with 2 seats contested in Boulsworth after the death of councillor Jo Belbin.[3] In total 63 candidates stood, with only one sitting councillor, Abdul Jabbar in Brierfield, not standing for re-election.[3] As well as candidates from the Conservative, Labour and Liberal Democrat parties, there were also 3 candidates from the Socialist Alliance, 4 independents and 4 from the British National Party.[3][4] This was the first time the British National Party had put up candidates in Pendle.[3]
Issues in the election included the proposed redevelopment of Nelson town centre, plans for an A56 bypass and the proposed demolition of houses in Nelson West.[5] Other issues as usual were council tax levels, litter, street safety and crime, while the national issue of the Iraq War was expected to influence voters.[5]
Election result
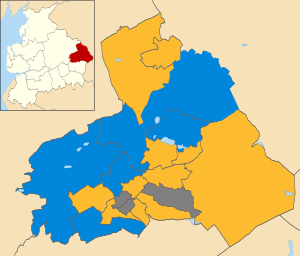
The results saw the Liberal Democrats become the largest party on the council, but without a majority, after making four gains from Labour.[6] This took the Liberal Democrats to 23 seats, compared to 15 for Labour and 11 Conservatives,[6] after the Liberal Democrats nearly won as many votes as the Conservative and Labour parties combined.[7] The Labour leader of the council, Azhar Ali, was among the councillors to lose their seats in the election, which saw the party fail to win any seats.[6] Ali blamed the defeats both on a backlash against the Iraq War and on an alleged "dirty tricks campaign".[6] Meanwhile the British National Party failed to win any seats, but did poll a significant number of votes.[8]
Following the election many of the Liberal Democrat councillors boycotted the swearing in of a new mayor in protest against the way he was elected instead of the previous years deputy mayor.[9][10] Liberal Democrat Alan Davies became the new leader of the council, but his party initially refused to take places on the executive committee.[11] This was because the council had voted for a 4-3-3 party split on the committee rather than the 5-3-2 split the Liberal Democrats had proposed.[11] Meanwhile the Labour group chose Frank Clifford to become the new leader of their group.[12]
| Pendle local election result 2003[13][14] |
| Party |
Seats |
Gains |
Losses |
Net gain/loss |
Seats % |
Votes % |
Votes |
+/− |
| |
Liberal Democrat |
12 |
4 |
0 |
+4 |
66.7 |
44.5 |
10,798 |
+5.9% |
| |
Conservative |
6 |
0 |
0 |
0 |
33.3 |
24.0 |
5,821 |
-3.3% |
| |
Labour |
0 |
0 |
4 |
-4 |
0 |
21.4 |
5,202 |
-11.1% |
| |
BNP |
0 |
0 |
0 |
0 |
0 |
7.3 |
1,769 |
+7.3% |
| |
Independent |
0 |
0 |
0 |
0 |
0 |
2.2 |
530 |
+1.4% |
| |
Socialist Alliance |
0 |
0 |
0 |
0 |
0 |
0.6 |
148 |
+0.1% |
Ward results
| Barrowford[13] |
| Party |
Candidate |
Votes |
% |
±% |
|
Conservative |
Linda Crossley |
565 |
31.0 |
|
|
Liberal Democrat |
Michael Simpson |
535 |
29.4 |
|
|
BNP |
Michael Brennan |
482 |
26.5 |
|
|
Labour |
Anthony Hargreaves |
240 |
13.2 |
|
| Majority |
30 |
1.6 |
|
| Turnout |
1,822 |
46.5 |
-1.2 |
|
Conservative hold |
Swing |
|
|
| Blacko and Higherford[13] |
| Party |
Candidate |
Votes |
% |
±% |
|
Conservative |
Shelagh Derwent |
552 |
84.4 |
+2.6 |
|
Labour |
Helen Ingham |
62 |
9.5 |
-0.1 |
|
Liberal Democrat |
Carman Stanworth |
40 |
6.1 |
-2.5 |
| Majority |
490 |
74.9 |
+2.8 |
| Turnout |
654 |
49.1 |
-2.9 |
|
Conservative hold |
Swing |
|
|
| Boulsworth (2)[13] |
| Party |
Candidate |
Votes |
% |
±% |
|
Liberal Democrat |
David Robertson |
784 |
|
|
|
Liberal Democrat |
Laurence Turner |
625 |
|
|
|
Conservative |
Michael Calvert |
493 |
|
|
|
Conservative |
Geoffrey Riley |
370 |
|
|
|
Labour |
Christine Dawson |
188 |
|
|
|
Labour |
David Foat |
160 |
|
|
| Turnout |
2,620 |
36.6 |
-4.6 |
|
Liberal Democrat hold |
Swing |
|
|
|
Liberal Democrat hold |
Swing |
|
|
| Bradley[13] |
| Party |
Candidate |
Votes |
% |
±% |
|
Liberal Democrat |
Mohammed Munir |
1,208 |
62.4 |
|
|
Labour |
Mohammad Sakib |
727 |
37.6 |
|
| Majority |
481 |
24.9 |
|
| Turnout |
1,935 |
46.9 |
-5.2 |
|
Liberal Democrat gain from Labour |
Swing |
|
|
| Clover Hill[13] |
| Party |
Candidate |
Votes |
% |
±% |
|
Liberal Democrat |
Kathleen Shore |
768 |
43.8 |
|
|
BNP |
Trevor Dawson |
452 |
25.8 |
|
|
Labour |
Mohammed Ansar |
445 |
25.4 |
|
|
Conservative |
Michael Landriau |
87 |
5.0 |
|
| Majority |
316 |
18.0 |
|
| Turnout |
1,752 |
47.7 |
+4.3 |
|
Liberal Democrat hold |
Swing |
|
|
| Coates[13] |
| Party |
Candidate |
Votes |
% |
±% |
|
Liberal Democrat |
Allan Buck |
989 |
55.4 |
|
|
BNP |
Geoffrey Whitehead |
394 |
22.1 |
|
|
Labour |
William Skinner |
176 |
9.9 |
|
|
Independent |
Jennifer Purcell |
114 |
6.4 |
|
|
Conservative |
Valerie Langtree |
112 |
6.3 |
|
| Majority |
595 |
33.3 |
|
| Turnout |
1,785 |
44.8 |
+5.0 |
|
Liberal Democrat hold |
Swing |
|
|
| Craven[13] |
| Party |
Candidate |
Votes |
% |
±% |
|
Liberal Democrat |
Marlene Hill-Crane |
880 |
53.7 |
|
|
Labour |
Frank Neal |
548 |
33.4 |
|
|
Conservative |
Barbara Watson-Davison |
212 |
12.9 |
|
| Majority |
332 |
20.2 |
|
| Turnout |
1,640 |
40.8 |
-2.4 |
|
Liberal Democrat hold |
Swing |
|
|
| Foulridge[13] |
| Party |
Candidate |
Votes |
% |
±% |
|
Conservative |
Carol Belshaw |
294 |
62.0 |
+7.3 |
|
Labour |
Jillian Smith |
114 |
24.1 |
-5.1 |
|
Liberal Democrat |
David Stopforth |
66 |
13.9 |
-2.2 |
| Majority |
180 |
38.0 |
+12.5 |
| Turnout |
474 |
35.6 |
-11.9 |
|
Conservative hold |
Swing |
|
|
| Higham and Pendleside[13] |
| Party |
Candidate |
Votes |
% |
±% |
|
Conservative |
John Nutter |
366 |
51.5 |
-25.2 |
|
Liberal Democrat |
Valerie Skinner |
279 |
39.2 |
+39.2 |
|
Labour |
Sheila Wicks |
66 |
9.3 |
-14.0 |
| Majority |
87 |
12.2 |
-41.3 |
| Turnout |
711 |
50.9 |
-2.8 |
|
Conservative hold |
Swing |
|
|
| Horsfield[13] |
| Party |
Candidate |
Votes |
% |
±% |
|
Liberal Democrat |
Ann Kerrigan |
490 |
41.8 |
|
|
Independent |
Peter Nowland |
297 |
25.4 |
|
|
Labour |
Paul Broughton |
213 |
18.2 |
|
|
Conservative |
Alexandra Thompson |
135 |
11.5 |
|
|
Socialist Alliance |
Kevin Bean |
36 |
3.1 |
|
| Majority |
193 |
16.5 |
|
| Turnout |
1,171 |
30.7 |
-5.6 |
|
Liberal Democrat hold |
Swing |
|
|
| Old Laund Booth[13] |
| Party |
Candidate |
Votes |
% |
±% |
|
Liberal Democrat |
John David |
555 |
80.1 |
-4.5 |
|
Conservative |
Clive Bevan |
138 |
19.9 |
+4.5 |
| Majority |
417 |
60.2 |
-9.1 |
| Turnout |
693 |
56.5 |
-6.2 |
|
Liberal Democrat hold |
Swing |
|
|
| Southfield[13] |
| Party |
Candidate |
Votes |
% |
±% |
|
Liberal Democrat |
Sonia Robinson |
833 |
56.8 |
|
|
Labour |
Azhar Ali |
377 |
25.7 |
|
|
Conservative |
Peter Wildman |
138 |
9.4 |
|
|
Independent |
David Geddes |
96 |
6.5 |
|
|
Independent |
Azar Ali |
23 |
1.6 |
|
| Majority |
456 |
31.1 |
|
| Turnout |
1,467 |
39.8 |
+2.3 |
|
Liberal Democrat gain from Labour |
Swing |
|
|
| Vivary Bridge[13] |
| Party |
Candidate |
Votes |
% |
±% |
|
Liberal Democrat |
Sharon Robinson |
502 |
34.2 |
|
|
BNP |
Brian Parker |
441 |
30.1 |
|
|
Labour |
Frank Allanson |
375 |
25.6 |
|
|
Conservative |
James Farnell |
148 |
10.1 |
|
| Majority |
61 |
4.2 |
|
| Turnout |
1,466 |
37.0 |
+1.4 |
|
Liberal Democrat gain from Labour |
Swing |
|
|
References