Oxford City Council elections
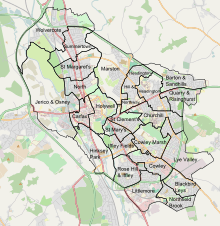
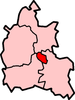
Wards for the local elections from 2002
Oxford City Council in Oxford, England is elected every two years, with half of the 48 seats in the City Council up for election on each occasion. Elections are held in even-numbered years; the next is due to take place in 2016. Until 2002 the council was elected by thirds.
As vacancies arise between elections, by-elections are held to elect a replacement councillor.
Election results
Detailed results are available, by year, as follows:
- Oxford City Council election, 2014
- Oxford City Council election, 2012
- Oxford City Council election, 2010
- Oxford City Council election, 2008
- Oxford City Council election, 2006
- Oxford City Council election, 2004
- Oxford City Council election, 2002
- Oxford City Council election, 2000
- Oxford City Council election, 1999
- Oxford City Council election, 1998
Political control
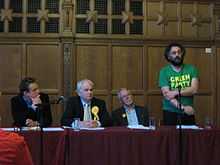
Political group leaders and senior politicians for the Oxford City Council (outgoing council at the election in 2010). From left to right: Jonathan Gittos candidate for the Conservatives, Councillor Stephen Brown leader of the political group of Liberal Democrats, Councillor John Tanner senior member of the Labour group, Councillor Craig Simmons leader of the Green group.
Since the foundation of the council, political control of the council has been held by the following parties:[1]
By-election results
| Quarry & Risinghurst By-Election 18 September 2014[2] |
| Party |
Candidate |
Votes |
% |
±% |
|
Labour |
Chewe Munkonge |
782 |
42.3 |
-1.3 |
|
Liberal Democrat |
Roz Smith |
615 |
33.2 |
+7.8 |
|
Conservative |
Katharine Harborne |
222 |
12.0 |
-7.2 |
|
Green |
Liz Taylor |
186 |
10.0 |
-1.7 |
|
English Democrats |
Julia Gasper |
43 |
2.3 |
+2.3 |
| Majority |
167 |
9.1 |
|
| Turnout |
1848 |
38 |
|
|
Labour hold |
Swing |
|
|
| Carfax By-Election 4 September 2014[3] |
| Party |
Candidate |
Votes |
% |
±% |
|
Labour |
Alex Hollingsworth |
168 |
44.2 |
+11.9 |
|
Liberal Democrat |
Tony Brett |
101 |
26.6 |
+3.3 |
|
Green |
Richard Scrase |
63 |
16.6 |
-9.8 |
|
Conservative |
Maryam Ahmed |
24 |
6.3 |
-11.6 |
|
UKIP |
Kenrick Bird |
24 |
6.3 |
+6.3 |
| Majority |
67 |
17.6 |
|
| Turnout |
380 |
8.6 |
|
|
Labour hold |
Swing |
|
|
| Cowley By-Election 17 July 2014[3] |
| Party |
Candidate |
Votes |
% |
±% |
|
Labour |
David Henwood |
512 |
39.4 |
-11.9 |
|
Green |
Hazel Dawe |
269 |
20.7 |
-2.1 |
|
Independent |
Artwell |
257 |
19.8 |
+19.8 |
|
Conservative |
Katharine Harborne |
152 |
11.7 |
-4.5 |
|
UKIP |
Ian Macdonald |
72 |
5.5 |
+5.5 |
|
Liberal Democrat |
Prakash Sharma |
39 |
3.0 |
-13.2 |
| Majority |
243 |
18.7 |
|
| Turnout |
1301 |
28 |
|
|
Labour hold |
Swing |
|
|
| North By-Election 19 September 2013[4] |
| Party |
Candidate |
Votes |
% |
±% |
|
Labour |
Louise Upton |
367 |
34.7 |
+18.0 |
|
Liberal Democrat |
Tim Bearder |
330 |
31.2 |
-13.4 |
|
Green |
Sushila Dhall |
262 |
24.7 |
+10.6 |
|
Conservative |
John Walsh |
100 |
9.4 |
-15.1 |
| Majority |
37 |
3.5 |
|
| Turnout |
1059 |
23 |
|
|
Labour gain from Liberal Democrat |
Swing |
|
|
| Headington Hill and Northway By-Election 26 March 2009[5] |
| Party |
Candidate |
Votes |
% |
±% |
|
Labour |
Roy Darke |
548 |
38.3 |
+2.0 |
|
Conservative |
Marc Borja |
443 |
31.0 |
-2.6 |
|
Liberal Democrat |
Ruth Beer |
378 |
26.4 |
+2.4 |
|
Green |
Katherine Wedell |
62 |
4.3 |
-1.8 |
| Majority |
105 |
7.3 |
|
| Turnout |
1431 |
32.9 |
+1.7 |
|
Labour hold |
Swing |
|
|
| Holywell By-Election 12 June 2008[6] |
| Party |
Candidate |
Votes |
% |
±% |
|
Liberal Democrat |
Mark Mills |
188 |
40.4 |
-5.0 |
|
Conservative |
Paul Sargent |
112 |
24.1 |
+1.6 |
|
Labour |
Sarah Hutchinson |
93 |
20.0 |
+6.4 |
|
Green |
Chip Sherwood |
72 |
15.5 |
-3.0 |
| Majority |
76 |
16.3 |
|
| Turnout |
465 |
11.7 |
−15.2 |
|
Liberal Democrat hold |
Swing |
|
|
| Lye Valley By-Election 21 September 2006[7] |
| Party |
Candidate |
Votes |
% |
±% |
|
Labour |
Bob Timbs |
784 |
52.8 |
+8.4 |
|
Liberal Democrat |
Nathan Pyle |
487 |
32.8 |
-10.2 |
|
Conservative |
Judith Harley |
150 |
10.1 |
+10.1 |
|
Green |
Larry Sanders |
64 |
4.3 |
-8.4 |
| Majority |
297 |
20.0 |
|
| Turnout |
1,485 |
31.0 |
|
|
Labour hold |
Swing |
|
|
| Hinksey Park By-Election 27 July 2006[7] |
| Party |
Candidate |
Votes |
% |
±% |
|
Labour |
Oscar Van Nooijen |
676 |
45.6 |
-3.2 |
|
Green |
Lilian Sherwood |
436 |
29.4 |
-0.6 |
|
Liberal Democrat |
Nathan Pyle |
217 |
14.6 |
+5.7 |
|
Conservative |
Caroline Ten Holter |
155 |
10.4 |
-1.8 |
| Majority |
240 |
16.2 |
|
| Turnout |
1,484 |
33.5 |
|
|
Labour hold |
Swing |
|
|
| Jericho & Osney By-Election 8 December 2005[7] |
| Party |
Candidate |
Votes |
% |
±% |
|
Labour |
Colin Cook |
713 |
44.0 |
+10.7 |
|
Liberal Democrat |
John Ballance |
437 |
27.0 |
-12.1 |
|
Green |
Athene Reiss |
355 |
21.9 |
+6.6 |
|
Conservative |
Patricia Jones |
115 |
7.1 |
-5.2 |
| Majority |
276 |
17.0 |
|
| Turnout |
1,620 |
33.1 |
|
|
Labour gain from Liberal Democrat |
Swing |
|
|
| Carfax By-Election 21 October 2004[7] |
| Party |
Candidate |
Votes |
% |
±% |
|
Green |
Sushila Dhall |
203 |
33.3 |
-3.6 |
|
Liberal Democrat |
Pamela Bones |
175 |
28.7 |
-2.5 |
|
Labour |
Bill Turner |
161 |
26.4 |
+7.9 |
|
Conservative |
Michael Davis |
71 |
11.6 |
-1.8 |
| Majority |
28 |
4.6 |
|
| Turnout |
610 |
14.9 |
|
|
Green hold |
Swing |
|
|
| Blackbird Leys By-Election 11 October 2001[7] |
| Party |
Candidate |
Votes |
% |
±% |
|
Labour |
Molly Florey |
634 |
69.4 |
+8.0 |
|
Liberal Democrat |
Bernard Gowers |
138 |
15.1 |
+5.1 |
|
Conservative |
David Brown |
103 |
11.3 |
-7.2 |
|
Green |
Patricia Dickson |
38 |
4.2 |
-5.8 |
| Majority |
496 |
54.3 |
|
| Turnout |
913 |
11.3 |
|
|
Labour hold |
Swing |
|
|
| Central By-Election 7 June 2001[7] |
| Party |
Candidate |
Votes |
% |
±% |
|
Liberal Democrat |
Antony Brett |
1,165 |
33.4 |
|
|
Green |
Paul Williams |
995 |
28.5 |
|
|
Conservative |
Richard Sage |
692 |
19.8 |
|
|
Labour |
Joel Brookfield |
635 |
18.2 |
|
| Majority |
170 |
4.9 |
|
| Turnout |
3,487 |
|
|
|
Liberal Democrat gain from Green |
Swing |
|
|
| Old Marston and Risinghurst By-Election 9 September 1999 |
| Party |
Candidate |
Votes |
% |
±% |
|
Liberal Democrat |
|
719 |
43.7 |
-7.1 |
|
Labour |
|
506 |
30.7 |
+2.8 |
|
Conservative |
|
352 |
21.4 |
+3.8 |
|
Green |
|
69 |
4.2 |
+0.5 |
| Majority |
213 |
13.0 |
|
| Turnout |
1,646 |
33.0 |
|
|
Liberal Democrat hold |
Swing |
|
|
| West By-Election 4 September 1997 |
| Party |
Candidate |
Votes |
% |
±% |
|
Labour |
|
512 |
32.7 |
-12.8 |
|
Liberal Democrat |
|
511 |
32.6 |
+14.3 |
|
Green |
|
405 |
25.8 |
+3.7 |
|
Conservative |
|
139 |
8.9 |
-5.2 |
| Majority |
1 |
0.1 |
|
| Turnout |
1,567 |
26.8 |
|
|
Labour hold |
Swing |
|
|
| Quarry By-Election 4 September 1997 |
| Party |
Candidate |
Votes |
% |
±% |
|
Liberal Democrat |
|
780 |
50.2 |
+21.7 |
|
Labour |
|
462 |
29.7 |
-8.4 |
|
Conservative |
|
259 |
16.7 |
-10.0 |
|
Green |
|
54 |
3.5 |
-3.2 |
| Majority |
318 |
20.5 |
|
| Turnout |
1,555 |
25.5 |
|
|
Liberal Democrat gain from Labour |
Swing |
|
|
| Old Marston and Risinghurst By-Election 4 September 1997 |
| Party |
Candidate |
Votes |
% |
±% |
|
Liberal Democrat |
|
478 |
41.9 |
+30.5 |
|
Labour |
|
385 |
33.7 |
-24.6 |
|
Conservative |
|
222 |
19.5 |
-4.8 |
|
Green |
|
56 |
5.0 |
-1.1 |
| Majority |
93 |
8.2 |
|
| Turnout |
1,141 |
23.0 |
|
|
Liberal Democrat gain from Labour |
Swing |
|
|
See also
References
External links
|
|---|
| | | Wards, suburbs,
neighbourhoods
and districts | | |
|---|
| | Civil parishes | |
|---|
| Former district
and borough | |
|---|
| Former
constituencies | |
|---|
| |
|