Oxford City Council election, 2004
Elections to Oxford City Council were held on 10 June 2004. The council is elected by halves, so one seat in each ward was up for election (except in St Clements, where both seats were contested). Labour lost majority control of the council but remained in minority administration. Overall turnout was 37.6%, with the lowest turnout (26.5%) in Carfax ward and the highest (49.5%) in Wolvercote.
Election result
| Oxford Local Election Result 2004 |
| Party |
Seats |
Gains |
Losses |
Net gain/loss |
Seats % |
Votes % |
Votes |
+/− |
| |
Liberal Democrat |
10 |
4 |
1 |
+3 |
40.0 |
30.2 |
12,053 |
+4.1% |
| |
Labour |
7 |
0 |
9 |
-9 |
28.0 |
27.4 |
10,970 |
-11.0% |
| |
Green |
5 |
4 |
0 |
+4 |
20.0 |
20.4 |
8,161 |
+1.7% |
| |
Independent Working Class |
3 |
2 |
0 |
+2 |
12.0 |
3.6 |
1,435 |
+2.2% |
| |
Conservative |
0 |
0 |
0 |
0 |
0 |
17.6 |
7,019 |
+3.0% |
| |
Independent |
0 |
0 |
0 |
0 |
0 |
0.83 |
333 |
+0.61% |
Note: three Independents stood in 2004, compared with one in 2002.
The total number of seats on the Council after the election was:
Sources: BBC Oxford City Council
Results by ward
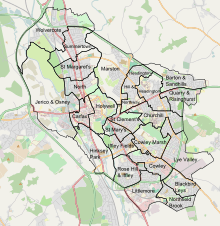
Map of the Oxford Wards
All results from Oxford City Council.
Barton and Sandhills
|
| Party |
Candidate |
Votes |
% |
±% |
|
Liberal Democrat |
Malcolm Murray |
497 |
36.6% |
|
|
Labour |
Peter Brennan |
414 |
30.5% |
|
|
Conservative |
Prudence Dailey |
285 |
21.0% |
|
|
Green |
Raymond Hitchins |
149 |
10.9% |
|
| Turnout |
1,357 |
31.1 |
|
Blackbird Leys
Carfax
|
| Party |
Candidate |
Votes |
% |
±% |
|
Liberal Democrat |
Paul Sargent |
479 |
|
|
|
Conservative |
Edward Watkins |
236 |
|
|
|
Green |
Pallas Reiss |
185 |
|
|
|
Labour |
Peter Morton |
185 |
|
|
| Turnout |
1,091 |
26.5 |
|
Churchill
Cowley
|
| Party |
Candidate |
Votes |
% |
±% |
|
Labour |
Beryl Keen |
616 |
|
|
|
Liberal Democrat |
Shakil Khan |
369 |
|
|
|
Green |
Martin Juckes |
323 |
|
|
|
Conservative |
Georgina Shomroni |
262 |
|
|
| Turnout |
1,577 |
37.8 |
|
Cowley Marsh
|
| Party |
Candidate |
Votes |
% |
±% |
|
Liberal Democrat |
Sajjad-Hussain Malik |
584 |
|
|
|
Labour |
Mumtaz Fareed |
377 |
|
|
|
Conservative |
Judith Harley |
222 |
|
|
|
Green |
David Bibby |
179 |
|
|
|
Independent |
Khurshid Ahmed |
74 |
|
|
| Turnout |
1,445 |
36.7 |
|
Headington
Headington Hill and Northway
|
| Party |
Candidate |
Votes |
% |
±% |
|
Labour |
Tony Gray |
451 |
|
|
|
Conservative |
Michael Davis |
434 |
|
|
|
Liberal Democrat |
Mohammed Altaf-Khan |
287 |
|
|
|
Green |
Katherine Wedell |
160 |
|
|
| Turnout |
1,337 |
33.8 |
|
Hinksey Park
|
| Party |
Candidate |
Votes |
% |
±% |
|
Labour |
Richard Muir |
869 |
|
|
|
Green |
Lilian Sherwood |
534 |
|
|
|
Liberal Democrat |
Christopher Bones |
282 |
|
|
|
Conservative |
Simon Mort |
258 |
|
|
| Turnout |
1,956 |
44.3 |
|
Holywell
|
| Party |
Candidate |
Votes |
% |
±% |
|
Green |
Matthew Sellwood |
443 |
|
|
|
Liberal Democrat |
Michael Gotch |
385 |
|
|
|
Conservative |
Gregory Stafford |
225 |
|
|
|
Labour |
Timothy Waters |
192 |
|
|
| Turnout |
1,264 |
32.1 |
|
Iffley Fields
|
| Party |
Candidate |
Votes |
% |
±% |
|
Green |
Elise Benjamin |
800 |
|
|
|
Labour |
Richard Tarver |
721 |
|
|
|
Liberal Democrat |
Bernard Gowers |
195 |
|
|
|
Conservative |
James Hayward-Bloomfield |
160 |
|
|
| Turnout |
1,946 |
45.9 |
|
Jericho and Osney
|
| Party |
Candidate |
Votes |
% |
±% |
|
Liberal Democrat |
Michael Collins |
846 |
|
|
|
Labour |
Colin Cook |
721 |
|
|
|
Green |
Lilia Patterson |
332 |
|
|
|
Conservative |
William Wilson |
266 |
|
|
| Turnout |
2,175 |
46.1 |
|
Littlemore
|
| Party |
Candidate |
Votes |
% |
±% |
|
Labour |
John Tanner |
539 |
|
|
|
Conservative |
Stuart Hand |
359 |
|
|
|
Green |
Mark Stevenson |
227 |
|
|
|
Liberal Democrat |
Nadeem Khan |
198 |
|
|
| Turnout |
1,334 |
30.0 |
|
Lye Valley
|
| Party |
Candidate |
Votes |
% |
±% |
|
Labour |
Daniel Paskins |
597 |
|
|
|
Liberal Democrat |
Nathan Pyle |
506 |
|
|
|
Conservative |
Marilyn Cox |
271 |
|
|
|
Green |
Tim Pizey |
141 |
|
|
| Turnout |
1,524 |
32.9 |
|
Marston
|
| Party |
Candidate |
Votes |
% |
±% |
|
Liberal Democrat |
Caroline van Zyl |
749 |
|
|
|
Labour |
Roy Darke |
693 |
|
|
|
Conservative |
Duncan Hatfield |
426 |
|
|
|
Green |
Jeremy Poster |
157 |
|
|
| Turnout |
2,030 |
46.3 |
|
North
|
| Party |
Candidate |
Votes |
% |
±% |
|
Liberal Democrat |
Clark Brundin |
706 |
|
|
|
Green |
Sushila Dhall |
500 |
|
|
|
Conservative |
Elizabeth Pryor |
214 |
|
|
|
Labour |
William Turner |
175 |
|
|
|
Independent |
John Rose* |
62 |
|
|
| Turnout |
1,669 |
39.0 |
|
*John Rose stood on the platform "Local Government Reform"
Northfield Brook
Quarry and Risinghurst
|
| Party |
Candidate |
Votes |
% |
±% |
|
Liberal Democrat |
Tia MacGregor |
953 |
|
|
|
Labour |
Oscar van Nooijen |
572 |
|
|
|
Conservative |
Elizabeth Mills |
356 |
|
|
|
Green |
Matthew Ormondroyd |
155 |
|
|
| Turnout |
2,053 |
46.0 |
|
Rose Hill and Iffley
|
| Party |
Candidate |
Votes |
% |
±% |
|
Labour |
Edward Turner |
676 |
|
|
|
Liberal Democrat |
David Penwarden |
505 |
|
|
|
Conservative |
Allen Mills |
256 |
|
|
|
Green |
Simon Brook |
185 |
|
|
| Turnout |
1,682 |
39.2 |
|
St Clement's
| Note: the top two candidates were elected |
| Party |
Candidate |
Votes |
% |
±% |
|
Green |
Claire Palmer |
741 |
|
|
|
Green |
Mary-Jane Sareva |
597 |
|
|
|
Labour |
Jane Darke |
357 |
|
|
|
Labour |
Mohammed Nawaz |
356 |
|
|
|
Liberal Democrat |
Ali Hydar |
236 |
|
|
|
Liberal Democrat |
Andrew MacGregor |
233 |
|
|
|
Conservative |
Peter Leeming |
201 |
|
|
|
Independent |
David Leake |
197 |
|
|
|
Conservative |
Gareth Jennings |
197 |
|
|
| Turnout |
1,564 |
33.9 |
|
Because both seats were up for election each voter had two votes (i.e. plurality-at-large). Turnout has been estimated by halving the number of votes cast.
St Margaret's
|
| Party |
Candidate |
Votes |
% |
±% |
|
Liberal Democrat |
Gwynneth Royce |
635 |
|
|
|
Green |
Christopher Goodall |
449 |
|
|
|
Conservative |
Robert Porter |
358 |
|
|
|
Labour |
James Cloyne |
108 |
|
|
| Turnout |
1,559 |
38.7 |
|
St Mary's
|
| Party |
Candidate |
Votes |
% |
±% |
|
Green |
Sidney Phelps |
616 |
|
|
|
Labour |
Mohammed Abbasi |
496 |
|
|
|
Liberal Democrat |
Julia Goddard |
198 |
|
|
|
Conservative |
Margaret Young |
127 |
|
|
| Turnout |
1,447 |
33.4 |
|
Summertown
|
| Party |
Candidate |
Votes |
% |
±% |
|
Liberal Democrat |
Anthony Hollander |
938 |
|
|
|
Green |
Thomas Lines |
462 |
|
|
|
Conservative |
Raoul Cerratti |
457 |
|
|
|
Labour |
Oliver Kempton |
216 |
|
|
| Turnout |
2,082 |
44.6 |
|
Wolvercote