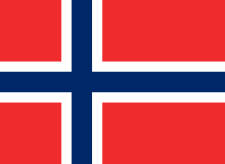
Norwegian parliamentary election, 1912
Norwegian parliamentary election, 1912
|
|
|
|
All 123 seats in the Norwegian Parliament
62 seats were needed for a majority |
| |
First party |
Second party |
Third party |
| |
 |
 |
 |
| Leader |
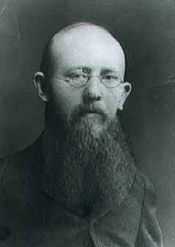
Gunnar Knudsen |
Christian Knudsen |
Jens Bratlie |
| Party |
Liberal |
Labour |
Conservative |
| Last election |
46 seats, 30.4% |
11 seats, 21.6% |
41 seats, 32.8% |
| Seats won |
70 |
23 |
20 |
| Seat change |
 24 24 |
12 |
 21 21 |
| Popular vote |
195,526 (V+Ad) |
128,455 |
162,074 (H+FV) |
| Percentage |
40.0% (V+Ad) |
26.3% |
33.2% (H+FV) |
|
| |
Fourth party |
Fifth party |
|
| |
|
 |
|
| Leader |
? |
Magnus Halvorsen |
|
| Party |
Labour Democrats |
Liberal Left |
|
| Last election |
2 seats, 3.7% |
23 seats with H |
|
| Seats won |
6 |
4 |
|
| Seat change |
4 |
19 |
|
| Popular vote |
Alliance with V |
Alliance with H |
|
| Percentage |
— |
— |
|
|
|
Parliamentary elections were held in Norway on 21 October 1912, with a second round held between 4 and 11 November.[1] The result was a victory for the alliance of the Liberal Party and the Labour Democrats, which won 76 of the 123 seats in the Storting.
Results
| Party |
Votes |
% |
Seats |
+/– |
|---|
| Liberal Party | 195,526 | 40.0 | 70 | +24 |
| Labour Democrats | 6 | +4 |
| Conservative Party | 162,074 | 33.2 | 20 | –21 |
| Liberal Left Party | 4 | –19 |
| Labour Party | 128,455 | 26.3 | 23 | +12 |
| Riksmål Party | 1,033 | 0.2 | 0 | New |
| Teetotaler Party | 884 | 0.2 | 0 | 0 |
| Independent Left Party | 528 | 0.1 | 0 | 0 |
| Church Party | 367 | 0.1 | 0 | 0 |
| Wild votes | 36 | 0.0 | – | – |
| Invalid/blank votes | 6,254 | – | – | – |
| Total | 495,157 | 100 | 123 | 0 |
| Registered voters/turnout | 809,582 | 65.9 | – | – |
| Source: Nohlen & Stöver |
References
- ↑ Nohlen, D & Stöver, P (2010) Elections in Europe: A data handbook, p1438 ISBN 978-3-8329-5609-7