Northern Tioga School District
| Northern Tioga School District | |
|---|---|
 | |
| Address | |
|
117 Coates Avenue Elkland, Pennsylvania, Tioga County, 16920-1305 United States | |
| Information | |
| Type | Public |
| Closed | Elkland High School 2011, Gertrude Case ES 1995, Millerton ES 1995, |
| School board | 9 members |
| Superintendent | Mrs. Diana Barnes, salary $120,000 in 2012, contract expires 06/30/2015[1] |
| Administrator |
Mrs Wanda Erb, Business Manager |
| Staff | 153 non teaching staff members |
| Faculty | 200 teachers (2010) |
| Grades | K-12 |
| Age | 5 years to 21 years for special education students |
| Pupils | 2,085 pupils 2012, 2,139 students 2010 |
| • Kindergarten | 150 (2012) |
| • Grade 1 | 164 |
| • Grade 2 | 149 |
| • Grade 3 | 154 |
| • Grade 4 | 164 |
| • Grade 5 | 165 |
| • Grade 6 | 165 |
| • Grade 7 | 160 |
| • Grade 8 | 157 |
| • Grade 9 | 142 |
| • Grade 10 | 164 |
| • Grade 11 | 174 |
| • Grade 12 | 177 |
| • Other | Enrollment declining to fewer than 2,110 pupils by 2019[2] |
| Budget |
$32.4 million (2013-14)[3] |
| Per pupil spending | $11,746 (2008) |
| Per pupil spending | $13,981.56 (2010) |
| Website | http://www.ntiogasd.org/ |
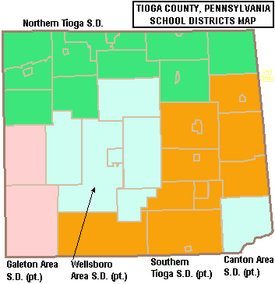
The Northern Tioga School District is a rural public school district in Tioga County, Pennsylvania. The District serves an extensive rural region, spanning 335 square miles (870 km2) in the county's northern sector. Northern Tioga School District is a third class school district having less than 30,000 residents and is one of the 500 public school districts of Pennsylvania. Municipalities served include: Tioga, Tioga Township, Jackson Township, Lawrenceville, Lawrence Township, Farmington Township, Elkland, Elkland Township, Osceola Township, Knoxville, Chatham Township, Deerfield Township, Brookfield, Westfield, and Clymer Township. According to 2000 federal census data, it served a resident population of 14,670. By 2010, the District's population declined to 14,523 people.[5]
According to District officials, in school year 2007-08, the Northern Tioga School District provided basic educational services to 2,352 pupils. The District employed: 217 teachers, 120 full-time and part-time support personnel, and 10 administrators. Northern Tioga School District received more than $17.5 million in state funding in school year 2007-08. By 2009-10, the District provided basic educational services to 2,184 pupils. It employed: 222 teachers, 128 full-time and part-time support personnel, and 10 administrators, during the 2009-10 school year. Northern Tioga School District received $17.6 million in state education funding for the 2009-10 school year.
Northern Tioga School District operates three elementary schools: Westfield Elementary School (K-6), Clark Wood Elementary School (K-6) and R.B. Walter Elementary School (K-6). The high schools consist of grades 7-12 with integrated middle schools. The secondary program is housed in two high schools: Cowanesque Valley Junior Senior High School and Williamson Senior High School. Elkland Area High School was closed in 2011 due to low enrollment. The District experienced a 17.89 percent decline in enrollment. The 2000-01 school year enrollment was 2,615 students to 2,136 pupils in 2010-11 a loss of 479 students.
Governance
Northern Tioga School District is governed by 9 individually elected board members (serve four-year terms), the Pennsylvania State Board of Education, the Pennsylvania Department of Education and the Pennsylvania General Assembly.[6] The district is divided into three regions. The board members are elected from these regions.
The federal government controls programs it funds like Title I funding for low-income children in the Elementary and Secondary Education Act and the No Child Left Behind Act, which mandates the district focus resources on student success in acquiring reading and math skills.
The Commonwealth Foundation for Public Policy Alternatives Sunshine Review gave the school board and district administration a "D-" for transparency based on a review of "What information can people find on their school district's website". It examined the school district's website for information regarding; taxes, the current budget, meetings, school board members names and terms, contracts, audits, public records information and more.[7]
Academic achievement
Northern Tioga School District was ranked 389th out of the 498 ranked Pennsylvania school districts in 2013, by the Pittsburgh Business Times. The ranking was based on student academic performance as demonstrated in the last 3 years of PSSA results in: reading, writing, math and science.[8] The PSSAs are given to all children in grades 3rd through 8th and the 11th grade in high school. Adapted examinations are given to children in the special education programs. Writing exams were given to children in 5th, 8th and 11th grades.
- 2012 - 393rd
- 2011 - 386th
- 2010 - 386th [9]
- 2009 - 398th
- 2008 - 383rd
- 2007 - 383rd out of 501 districts[10]
- Overachiever statewide ranking
In 2013, the Pittsburgh Business Times also reported an Overachievers Ranking for 498 Pennsylvania school districts. Northern Tioga School District ranked 159th.[11] The editor describes the ranking as: "a ranking answers the question - which school districts do better than expectations based upon economics? This rank takes the Honor Roll rank and adds the percentage of students in the district eligible for free and reduced-price lunch into the formula. A district finishing high on this rank is smashing expectations, and any district above the median point is exceeding expectations."[12]
- 2012 - 175th
- 2011 - 102nd
In 2009, Northern Tioga School District was in the bottom 33 percentile for student academic achievement among Pennsylvania's 500 public school districts.[13]
District AYP status history
In 2012, Northern Tioga School District declined to Warning AYP status, due to lagging student achievement and a low graduation rate.[14] In 2011, Northern Tioga School District achieved Adequate Yearly Progress (AYP). In 2011, 94 percent of the 500 Pennsylvania public school districts achieved the No Child Left Behind Act progress level of 72% of students reading on grade level and 67% of students demonstrating on grade level math. In 2011, 46.9 percent of Pennsylvania school districts achieved Adequate Yearly Progress (AYP) based on student performance. An additional 37.8 percent of school districts made AYP based on a calculated method called safe harbor, 8.2 percent on the growth model and 0.8 percent on a two-year average performance.[15] Northern tioga School District achieved AYP status each year from 2004 to 2010, while in 2003 the District was in Warning status due to lagging student achievement.[16]
Cowanesque Valley Junior Senior High School
Cowanesque Valley Junior Senior High School is located at 51 North Fork Road, Westfield. By 2013, enrollment was 412 pupils (7th-12th) with 45% qualifying for a free or reduced-price lunch. According to the National Center for Education Statistics, in 2010, the school reported an enrollment of 360 pupils in grades 7th through 12th, with 177 pupils eligible for a federal free or reduced-price lunch. The school is a federally designated Title I school in 2010. The school employed 31 teachers, yielding a student–teacher ratio of 11:1.[17] According to a report by the Pennsylvania Department of Education, 100% of its teachers were rated "Highly Qualified" under the federal No Child Left Behind Act.[18]
- Graduation rate
- 2013 School Performance Profile
Cowanesque Valley Junior Senior High School achieved 68.9 out of 100. Reflects on grade level reading, mathematics and science achievement. In reading/literature - 75% were on grade level. In Algebra 1, 68% showed on grade level skills. In Biology, 44% showed on grade level science understanding. In writing, 62% o fteh eighth graders demonstrated on grade level writing skills.[22] According to the Pennsylvania Department of Education, 2,181 public schools (less than 73 percent of Pennsylvania public schools), achieved an academic score of 70 or higher. Pennsylvania 11th grade students no longer take the PSSAs. Instead, they now take the Keystone Exams at the end of the associated course.
- AYP history
In 2012, Cowanesque Valley Junior Senior High School declined to School Improvement Level I AYP status due to low student achievement in both reading and math.[23] In 2011, Cowanesque Valley Junior Senior High School was in Warning AYP status due to low student academic achievement.[24] Under the federal No Child Left Behind Act, the school administration was required to notify parents of the school's poor achievement outcomes and to offer the parent the opportunity to transfer to a successful school within the District. Additionally, the school administration was required by the Pennsylvania Department of Education, to develop a School Improvement Plan to address the school's low student achievement. Under the Pennsylvania Accountability System, the school district was required to pay for additional tutoring for struggling students.[25]
- PSSA Results
- 11th Grade Reading
- 2012 - 53% on grade level, (19% below basic). State - 67% of 11th graders are on grade level.[26]
- 2011 - 52% (29% below basic). State - 69.1% [27]
- 2010 - 65%, State - 67% (55 pupils)[28]
- 2009 - 54%, State - 65% (57 pupils enrolled)[29]
- 2008 - 54%, State - 65% (62 enrolled)[30]
- 11th Grade Math:
- 2012 - 36% on grade level (33% below basic). In Pennsylvania, 59% of 11th graders are on grade level.[31]
- 2011 - 41% (38% below basic). State - 60.3% [32]
- 2010 - 61%, State - 59% [33]
- 2009 - 40%, State - 56% [34]
- 2008 - 51%, State - 55%
- 11th Grade Science
- 2012 - 29% on grade level (17% below basic). State - 42% of 11th graders were on grade level.[35]
- 2011 - 28% (20% below basic). State - 40% [36]
- 2010 - 41%, State - 39%
- 2009 - 33%, State - 40%
- 2008 - 30%, State - 39%
|
|
- 8th Grade Science
- 2012 - 64% on grade level (9% below basic). State - 59%
- 2011 - 63% (9% below basic). State – 58.3%
- 2010 - 52%, State - 57%
- 2009 - 60%, State - 55%
- 2008 - 45%, State - 52%
|
|
Science in Motion Cowanesque Valley Junior Senior High School did not take advantage of a state program called Science in Motion which brought college professors and sophisticated science equipment to the school to raise science awareness and to provide inquiry-based experiences for the students. The Science in Motion program was funded by a state appropriation and cost the school nothing to participate.[37] Cedar Crest College provided the science enrichment experiences to schools in the region.
SAT scores
In 2013, Cowanesque Valley Junior Senior School District students took the SAT exams. The District's Verbal Average Score was 459. The Math average score was 458. The Writing average score was 432. The College Board reported that statewide scores were: 494 in reading, 504 in math and 482 in writing. The nation-wide SAT results were the same as in 2012.[38]
In 2012, 28 Cowanesque Valley Junior Senior High School students took the SATs. The School's Verbal Average Score was 485. The Math average score was 478. The Writing average score was 443. The statewide Verbal SAT exams results were: Verbal 491, Math 501, Writing 480. In the USA, 1.65 million students took the exams achieving scores: Verbal 496, Math 514, Writing 488. According to the College Board the maximum score on each section was 800, and 360 students nationwide scored a perfect 2,400.
In 2011, 40 students at Cowanesque Valley Junior Senior High School took the SAT exams. The school's Verbal Average Score was 475. The Math average score was 464. The Writing average score was 449.[39] Pennsylvania ranked 40th among states with SAT scores: Verbal - 493, Math - 501, Writing - 479.[40] In the United States, 1.65 million students took the exam in 2011. They averaged 497 (out of 800) verbal, 514 math and 489 in writing.[41]
Williamson Senior High School
Williamson Senior High School is located at 33 Jct Cross Road, Tioga. It serves the eastern portion of the District. In 2013, enrollment was reported as 516 students, with 39% from low income homes.[42] According to the National Center for Education Statistics, in 2010, the school reported an enrollment of 424 pupils in grades 7th through 12th, with pupils eligible for a federal free or reduced-price lunch. The school employed 41 teachers, yielding a student–teacher ratio of 10:1.[43] According to a report by the Pennsylvania Department of Education, 100% of its teachers were rated "Highly Qualified" under No Child Left Behind.[44]
- 2013 School Performance Profile
Williamson Senior High School achieved 67.8 out of 100. Reflects on grade level reading, writing, mathematics and science achievement. In reading, 76% of the students were on grade level. In Mathematics, 76.7% of the students showed on grade level skills. In Science, just 52% of the students demonstrated on grade level understanding. In writing, 57% of the 8th grade students showed on grade level writing skills.[45]
- AYP history
In 2012, Williamson High School declined to Warning Adequate Yearly Progress (AYP) status, due to lagging student achievement. The school missed all the reading and mathematics metrics measured on the PSSAs.[46] In 2011, Williamson Senior High School achieved AYP status.[47]
- Graduation rate
- 2013 - 91.5%
- 2012 - 90%
- 2011 - 80%
- 2010 - 91%[48]
- 2009 - 82%
- PSSA Results
- 11th Grade Reading
- 2012 - 47% on grade level, (21% below basic). State - 67% of 11th graders are on grade level.[49]
- 2011 - 59% (26% below basic). State - 69.1%
- 2010 - 50%, State - 67% (71 pupils) [50]
- 2009 - 47%, State - 65% (83 pupils) [51]
- 2008 - 41%, State - 65% (87 pupils) [52]
- 11th Grade Math:
- 2012 - 38% (33% below basic). State - 59% [53]
- 2011 - 58% (14% below basic). State - 60.3% [54]
- 2010 - 47%, State - 59% [55]
- 2009 - 45%, State - 56%[56]
- 2008 - 49%, State - 55%
- 11th Grade Science
- 2012 - 30% (13% below basic). State - 42%
- 2011 - 41% (16% below basic). State - 40%
- 2010 - 26%, State - 39%
- 2009 - 38%, State - 40%
- 2008 - 25%, State - 39%[57]
|
|
- 8th Grade Science
- 2012 - 68% on grade level (12% below basic). State - 59% of 8th graders were on grade level.
- 2011 - 52% (18% below basic). State – 58.3%
- 2010 - 64%. State - 57%
- 2009 - 48%, State - 55%
- 2008 - 46%, State - 52%
|
|
SAT scores
In 2013, Williamson Senior High School students took the SAT exams. The School's Verbal Average Score was 466. The Math average score was 456. The Writing average score was 431. The College Board reported that statewide scores were: 494 in reading, 504 in math and 482 in writing. The nation-wide SAT results were the same as in 2012.[59]
In 2012, 48 Williamson Senior High School students took the SAT exams. The School's Verbal Average Score was 459. The Math average score was 462. The Writing average score was 433. The statewide Verbal SAT exams results were: Verbal 491, Math 501, Writing 480. In the USA, 1.65 million students took the exams achieving scores: Verbal 496, Math 514, Writing 488. According to the College Board the maximum score on each section was 800, and 360 students nationwide scored a perfect 2,400.
In 2011, 43 Williamson Senior High School students took the SAT exams. The school's Verbal Average Score was 418. The Math average score was 452. The Writing average score was 409.[60] Pennsylvania ranked 40th among states with SAT scores: Verbal - 493, Math - 501, Writing - 479.[61] In the United States, 1.65 million students took the exam in 2011. They averaged 497 (out of 800) verbal, 514 math and 489 in writing.[62]
Graduation requirements
The Northern Tioga School District School Board has determined that 26 credits are required for graduation, including English - 4 credits, Math - 3 credits, including Algebra and Geometry; Social Studies - 3 credits, including American Government, Science - 3 credits, including Science 9 & Biology; Physical Education - 2 credits, Health - 0.5 credit, Computer applications 1 credit, Fine or Practical Arts - 1 credit, Senior Project 1 credit that includes 40 hours community service and 7.5 credits of electives.[63] In August 2013, the School Board approved adding a personal finance course to the graduation requirements.[64]
By law, all Pennsylvania secondary school students must complete a project as a part of their eligibility to graduate from high school. The type of project, its rigor and its expectations are set by the individual school district.[65] Effective with the graduating class of 2017, the Pennsylvania State Board of Education eliminated the state mandate that students complete a culminating project in order to graduate.[66]
By Pennsylvania School Board regulations, beginning with the class of 2017, public school students must demonstrate successful completion of secondary level course work in Algebra I, Biology, and English Literature by passing the Keystone Exams.[67] The exam is given at the end of the course. Keystone Exams replace the PSSAs for 11th grade.[68]
Students have several opportunities to pass the exam. Those who do not pass after several attempts can perform a project in order to graduate.[69][70] For the class of 2019, a Composition exam will be added. For the class of 2020, passing a civics and government exam will be added to the graduation requirements.[71] In 2011, Pennsylvania high school students field tested the Algebra 1, Biology and English Lit exams. The statewide results were: Algebra 1 38% on grade level, Biology 35% on grade level and English Lit - 49% on grade level.[72] Individual student, school or district reports were not made public, although they were reported to district officials by the Pennsylvania Department of Education. Students identified as having special needs and qualifying for an Individual Educational Program (IEP) may graduate by meeting the requirements of their IEP.
Clark Wood Elementary School
Clark Wood Elementary School is located at 112 Ellison Road, Elkland. According to the National Center for Education Statistics, in 2010, the school reported an enrollment of 266 pupils in grades kindergarten through 6th, with 138 pupils receiving a federal free or reduced-price lunch due to family poverty. The school employed 31 teachers, yielding a student–teacher ratio of 8:1.[73] According to a report by the Pennsylvania Department of Education, 100% of its teachers were rated "Highly Qualified" under No Child Left Behind.[74] The school provides full day kindergarten to all its pupils.[75] The school also provides one preschool class.
- 2013 School Performance Profile
Clark Wood Elementary School achieved a score of 91 out of 100. The score reflects on grade level: reading, science, writing and mathematics achievement. In 2012-13, only 75% of the students were reading on grade level in grades 3rd through 5th. In 3rd grade, 92% of the pupils were reading on grade level. In math, 80.7% were on grade level (3rd-5th grades). In 4th grade science, 81% of the pupils demonstrated on grade level understanding. In writing only 79% of 5th grade pupils demonstrated on grade level skills.[76]
- AYP History
In 2010 through 2012, Clark Wood Elementary School achieved AYP status.[77]
In 2012, only 71% of the students were reading on grade level in grades 3rd through 6th. In math, 81% of the students in 3rd through 6th grades were on grade level and 43% scored advanced. In 4th grade science, 84% of the pupils were on grade level.[78][79]
3rd grade Reading:
- 2012 - 66% on grade level
- 2011 - 67% on grade level
Russell Walter Elementary School
Russell Walter Elementary School is located at 65 Jct Cross Road, Tioga. In 2013, the school reported 458 pupils, with 40% of pupils from a low income home. According to the National Center for Education Statistics, in 2010, the school reported an enrollment of 459 pupils in grades kindergarten through 6th, with 201 pupils receiving a federal free or reduced-price lunch due to family poverty. The school employed 36 teachers, yielding a student–teacher ratio of 12:1.[80] According to a report by the Pennsylvania Department of Education, 100% of its teachers were rated "Highly Qualified" under the federal No Child Left Behind Act.[81] The school provides full day kindergarten to all its pupils.[82] The school also provides one preschool class.
- 2013 School Performance Profile
Russell Walter Elementary School achieved a score of 86.8 out of 100. The score reflects on grade level: reading, science, writing and mathematics achievement. In 2012-13, only 70% of the students were reading on grade level in grades 3rd through 5th. In 3rd grade, 73% of the pupils were reading on grade level. In math, 77% were on grade level (3rd-5th grades). In 4th grade science, just 86% of the pupils demonstrated on grade level understanding. In writing only 67% of 5th grade pupils demonstrated on grade level writing skills.[83]
- AYP History
In 2012, Russell Walter Elementary School declined to Warning AYP status due to lagging student academic achievement especially in reading.[84] In 2011, Russell Walter Elementary School achieved AYP status.
In 2012, only 75% of the students were reading on grade level in grades 3rd through 6th. In math, 85% of the students in 3rd through 6th grades were on grade level and 45% scored advanced. In 4th grade science, 93% of the pupils were on grade level.[85][86]
- 3rd grade reading
- 2013 - 73.8% on grade level
- 2012 - 73% on grade level
- 2011 - 79% on grade level
Westfield Area Elementary School
Westfield Area Elementary School is located at 1355 Route 49, Westfield. According to the National Center for Education Statistics, in 2010, the school reported an enrollment of 368 pupils in grades kindergarten through 6th, with 207 pupils receiving a federal free or reduced-price lunch due to family poverty. The school employed 31 teachers, yielding a student–teacher ratio of 12:1.[87] According to a report by the Pennsylvania Department of Education, 100% of its teachers were rated "Highly Qualified" under the federal No Child Left Behind Act.[88] The school has provided full day kindergarten to all its pupils since 2008.[89] The school also provides one, taxpayer funded preschool class.
While proponents of full day kindergarten claim it will reduce special education numbers and it will raise primary student academic achievement especially in reading and math, those outcomes have not been realized in Northern Tioga School District. Reading achievement in particular has remained unimproved for the past 5 years.[90]
- 2013 School Performance Profile
Westfield Area Elementary School achieved a score of 76.7 out of 100. The score reflects on grade level: reading, science, writing and mathematics achievement. In 2012-13, only 65% of the students were reading on grade level in grades 3rd through 5th. In 3rd grade, 78% of the pupils were reading on grade level. In math, only 73% were on grade level (3rd-5th grades). In 4th grade science, just 79% of the pupils demonstrated on grade level understanding. In writing only 76% of 5th grade pupils demonstrated on grade level skills.[91]
- AYP history
In 2012, Westfield Area Elementary School declined to Warning AYP status due to low reading achievement. In 2011, Westfield Area Elementary School achieved AYP status.[92]
In 2012, only 67% of the school's students were reading on grade level in grades 3rd through 6th. In Mathematics, 81% of the students in 3rd through 6th grades were on grade level and 43% scored advanced. In 4th grade science, 86% of the pupils were on grade level.[93][94]
- 3rd grade reading
- 2013 - 78% on grade level
- 2012 - 74% on grade level
- 2011 - 75% on grade level
Special education
In December 2012, Northern Tioga School District administration reported that 321 pupils or 15.4% of the District's pupils received Special Education services with 51.7% of identified students having a specific learning disability.[95] In December 2011, Northern Tioga School District administration reported that 326 pupils or 15.6% of the district's pupils received Special Education services with 48% of identified students having a specific learning disability. In December 2010, the administration reported that 331 pupils or 15% of the District's pupils received Special Education services with 51% of identified students having a specific learning disability.[96] In 2008, the District reported that 15% of its pupils received a broad variety of services for all children with disabilities in accordance with state and federal laws, rules, and regulations.[97][98] By law, parents may make a written request for their child to be evaluated for special education or gifted education services. The District then has 60 days to evaluate the child. The IDEA 2004 requires each school entity to publish a notice to parents, in newspapers or other media, including the student handbook and website regarding the availability of screening and intervention services and how to access them.
In 2010, the state of Pennsylvania provided $1,026,815,000 for Special Education services. This funding is in addition to the state's basic education per pupil funding, as well as, all other state and federal funding.[99] The Special Education funding structure is through the federal Individuals with Disabilities Education Act (IDEA) funds and state appropriations. IDEA funds are appropriated to the state on an annual basis and distributed through intermediate units (IUs) to school districts, while state funds are distributed directly to the districts. Total funds that are received by school districts are calculated through a formula. The Pennsylvania Department of Education oversees four appropriations used to fund students with special needs: Special Education; Approved Private Schools; Pennsylvania Chartered Schools for the Deaf and Blind; and Early Intervention. The Pennsylvania Special Education funding system assumes that 16% of the district’s students receive special education services. It also assumes that each student’s needs accrue the same level of costs.[100] Over identification of students, in order to increase state funding, has been an issue in the Commonwealth. Some districts have more than 20% of its students receiving special education services while others have 10% supported through special education.[101] The state requires each public school district and charter school to have a three-year special education plan to meet the unique needs of its special education students.[102] In 2012, the Obama Administration's US Department of Education issued a directive that schools include students with disabilities in extracurricular activities, including sports.[103]
The Northern Tioga School District received a $1,554,153 supplement for special education services in 2010.[104] For the 2011-12, 2012–13, and 2013-14 school years, all Pennsylvania public school districts received the same level of funding for special education that they received in 2010-11. This level funding is provided regardless of changes in the number of pupils who need special education services and regardless of the level of services the respective students required.[105][106] Additionally, the state provides supplemental funding for extraordinarily impacted students. The District must apply for this added funding.
In 2006, Northern Tioga School District was identified by the Pennsylvania Department of Education for Least Restrictive Environment monitoring. The District received an alert letter from the PDE - Bureau of Special Education.[107] School districts were placed in one of three categories: Tier 1, Tier 2 or Tier 3. The District was placed in Tier 3 due to students spending more than 60% of the school day, outside of regular education. The monitoring is a product of the PDE addressing its voluntary settlement in Gaskin V. Pennsylvania which ordered that special education students spend most of their school day (80%) in regular education classrooms with supplementary aids and services to assist funded by the taxpayers.[108][109][110] In 2010, the district was assigned to the Tier 3 monitoring list, due to students spending less than 40% of their day in a regular education classroom. The district was subsequently cleared from monitoring.[111]
Gifted education
The Northern Tioga School District Administration reported that less than 10 of its students were identified as gifted in 2009. The highest percentage of gifted students reported among all 500 school districts and 100 public charter schools in Pennsylvania was North Allegheny School District with 15.5% of its students identified as gifted.[112] By law, the district must provide mentally gifted programs at all grade levels. The referral process for a gifted evaluation can be initiated by teachers or parents by contacting the student’s building principal and requesting an evaluation. All requests must be made in writing. To be eligible for mentally gifted programs in Pennsylvania, a student must have a cognitive ability of at least 130 as measured on a standardized ability test by a certified school psychologist. Other factors that indicate giftedness will also be considered for eligibility.[113][114]
Budget
Pennsylvania public school districts budget and expend funds according to procedures mandated by the General Assembly and the Pennsylvania Department of Education (PDE). An annual operating budget is prepared by school district administrative officials. A uniform form is furnished by the PDE and submitted to the board of school directors for approval prior to the beginning of each fiscal year on July 1.
Under Pennsylvania’s Taxpayer Relief Act, Act 1 of the Special Session of 2006, all school districts of the first class A, second class, third class and fourth class must adopt a preliminary budget proposal. The proposal must include estimated revenues and expenditures and the proposed tax rates. This proposed budget must be considered by the Board no later than 90 days prior to the date of the election immediately preceding the fiscal year. The preliminary budget proposal must also be printed and made available for public inspection at least 20 days prior to its adoption. The board of school directors may hold a public hearing on the budget, but are not required to do so. The board must give at least 10 days’ public notice of its intent to adopt the final budget according to Act 1 of 2006.[115]
In 2012, the average teacher salary in Northern Tioga School District was $51,109 a year, while the cost of the benefits teachers received was $17,517 per employee, for a total annual average teacher compensation of $68,626.91.[116]
In 2011, the average teacher salary in Northern Tioga School District was $52,214 a year, while the cost of the benefits teachers receive was $15,052 per employee, for a total annual average teacher compensation of $67,266.71.[117] According to a study conducted at the American Enterprise Institute, in 2011, public school teachers’ total compensation is roughly 50 percent higher than they would likely receive in the private sector. The study found that the most generous benefits that teachers receive are not accounted for in many studies of compensation, including: pension, retiree health benefits and job security.[118]
In 2009, Northern Tioga School District reported employing 230 teachers and administrators with a median salary of $51,482 and a top salary of 120,363.[119] The teacher’s work day is 7 hours 35 minutes, with 188 days in the contract year. Additionally, the teachers receive a defined benefit pension, health insurance (District pays full cost), dental insurance, professional development reimbursement ($350.00) per credit earned, 2 paid personal days, 10 paid sick days, and other benefits.[120]
In 2007 the Northern Tioga School District employed 201 teachers and the average teacher salary in the district was $45,043 for 180 days worked.[121] In 2009, the district employed over 200 teachers with a salary range of $40,000 to $114,000.[122] The faculty receives an extensive benefits package which includes: health insurance, life insurance, fees to professional organizations and a defined benefit pension.[123]
Per pupil spending Northern Tioga School Districtadministrative costs per pupil were $634.02 in 2008. The lowest administrative cost per pupil in Pennsylvania was $398 per pupil.[124]
Northern Tioga School District reported spending $11,746 per pupil in 2008 which ranked 302nd in the state.[125] In 2010, the District’s per pupil spending had increased to $13,981.56.[126] In 2011, Pennsylvania’s per pupil spending was $13,467, ranking 6th in the United States.[127] In 2007, the Pennsylvania per pupil total expenditures was reported as $12,759.[128]
The U.S. Census Bureau reported that Pennsylvania spent $8,191 per pupil in school year 2000-01.[129] In 2007, the Pennsylvania per pupil total expenditures was reported as $12,759.[130] Among the fifty states, Pennsylvania’s total per pupil revenue (including all sources) ranked 11th at $15,023 per student, in 2008-09.[131] Pennsylvania’s total revenue per pupil rose to $16,186 ranking 9th in the nation in 2011.[132]
On May 12, 2008, the Northern Tioga School District Board of Directors adopted the 2008 - 09 proposed final budget in the amount of $30,354,042 reflecting an increase of $270,736 over the current budget.[133]
Reserves In the 2009-10 budget proposal, Northern Tioga School District reported having $4,829,535 in unreserved funds.[134] In 2012, the reserves were reported to the state at $8,259,504. Pennsylvania public school district reserve funds are divided into two categories – designated and undesignated. The undesignated funds are not committed to any planned project. Designated funds and any other funds, such as capital reserves, are allocated to specific projects. School districts are required by state law to keep 5 percent of their annual spending in the undesignated reserve funds to preserve bond ratings. According to the Pennsylvania Department of Education, from 2003 to 2010, as a whole, Pennsylvania school districts amassed nearly $3 billion in reserved funds.[135] By 2013, reserves held by Pennsylvania public school districts, as a whole, had increased to over $3.8 billion.[136]
Audit The Pennsylvania Auditor General conducted a performance audit of the Northern Tioga School District in July 2009. Multiple findings were noted. The issues were reported to the school board and district administration.[137]
Tuition Students who live in the Northern Tioga School District's attendance area may choose to attend one of Pennsylvania's 157 public charter schools. A student living in a neighboring public school district or a foreign exchange student may seek admission to Northern Tioga School District. For these cases, the Pennsylvania Department of Education sets an annual tuition rate for each school district. It is the amount the public school district pays to a charter school for each resident student that attends the charter and it is the amount a nonresident student's parents must pay to attend the District's schools. The 2012 tuition rates are Elementary School - $8,463.08, High School - $9,853.49.[138]
The Northern Tioga School District is funded by a combination of: a local earned income tax 1.2%, a local property tax, a real estate transfer tax of 0.5 percent, coupled with substantial funding from the Commonwealth of Pennsylvania and the federal government.[139] Grants can provide an opportunity to supplement school funding without raising local taxes. Interest earnings on accounts also provide nontax income to the District. In the Commonwealth of Pennsylvania, pension income and Social Security income are exempted from state personal income tax and local earned income tax, regardless of the level of the individual’s personal wealth.[140] The average Pennsylvania public school teacher pension in 2011 exceeds $60,000 a year plus they receive federal Social Security benefits: both are free of Pennsylvania state income tax and local income tax which funds local public schools.[141]
State basic education funding
For the 2013-14 school year, the Northern Tioga School District received a 1.4% increase or $11,940,109 in Pennsylvania Basic Education Funding. This is $162,990 more than its 2012-13 state BEF to the District. Additionally, Northern Tioga School District received $199,575 in Accountability Block Grant funding to focus on academic achievement and level funding for special education services. Among the public school districts in Tioga County, Wellsboro Area School District received the highest percentage increase in BEF at 1.8%. The District has the option of applying for several other state and federal grants to increase revenues. The Commonwealth’s budget increased Basic Education Funding statewide by $123 million to over $5.5 billion. Most of Pennsylvania’s 500 public school districts received an increase of Basic Education Funding in a range of 0.9% to 4%. Eight public school districts received exceptionally high funding increases of 10% to 16%. The highest increase in state funding was awarded to Austin Area School District which received a 22.5% increase in Basic Education Funding.[142] The state funded the PSERS (Pennsylvania school employee pension fund) with $1,017,000,000 and Social Security payments for school employees of $495 million.[143]
For the 2012-13 school year, Northern Tioga School District received $11,976,694, an increase of $199,575.[144] The Governor's Executive Budget for 2012-2013 includes $9.34 billion for kindergarten through 12th grade public education, including $5.4 billion in basic education funding, which is an increase of $49 million over the 2011-12 budget. The state also provides $100 million for the Accountability Block grant. Northern Tioga School District received $199,575 in Accountability Block Grant funding to focus on academic achievement. The state will also provide $544.4 million for School Employees’ Social Security and $856 million for School Employees’ Retirement fund called PSERS.[145] This amount is a $21,823,000 increase (0.34%) over the 2011-2012 appropriations for Basic Education Funding, School Employees' Social Security, Pupil Transportation, Nonpublic and Charter School Pupil Transportation. Since taking office, Corbett’s first two budgets have restored more than $918 million in support of public schools, compensating for the $1 billion in federal stimulus dollars lost at the end of the 2010-11 school year.
For the 2011-12 school year, Northern Tioga School District received an $11,777,119 allocation, of state Basic Education Funding.[146][147] Additionally, Northern Tioga School District received $147,710 in Accountability Block Grant funding. The enacted Pennsylvania state Education budget included $5,354,629,000 for the 2011-2012 Basic Education Funding appropriation. This amount was a $233,290,000 increase (4.6%) over the enacted State appropriation for 2010-2011.[148] The highest increase in state basic education funding was awarded to Duquesne City School District, which got a 49% increase in state funding for 2011-12.[149] In 2010, the district reported that 882 students received free or reduced-price lunches, due to the family meeting the federal poverty level.[150]
In 2010-11, Northern Tioga School District received a 2.49% increase in state funding for a total of $12,699,883.[151] Southern Tioga School District highest funding increase given among Tioga County school districts at 3.23%. In Pennsylvania, the highest increase went to Kennett Consolidated School District of Chester County which received a 23.65% increase in basic education funding from the state. The state's hold harmless policy regarding state basic education funding continued where each district received at least the same amount as it received the prior school year, even where enrollment had significantly declined. The amount of increase each school district received was set by Governor Edward Rendell and then Secretary of Education Gerald Zahorchak, as a part of the state budget proposal given each February. This was the second year of Governor Rendell’s policy to fund some public school districts at a far greater rate than others.
In the 2009-2010 budget year, the Commonwealth of Pennsylvania provided a 5.21% increase in Basic Education Funding for a total of $12,390,820. According to the Pennsylvania Department of Education, 1,115 students received free or reduced-price lunches due to low family income in the 2007-2008 school year.[152] The district also received supplemental funding for: Title I (federal funding for low-income students), for district size, a poverty supplement from the Commonwealth and more. In Pennsylvania, the highest state funding increase was 22% to Muhlenberg School District.[153] According to the U.S. Census Bureau, Pennsylvania spent $7,824 Per Pupil in the year 2000. This amount increased up to $12,085 by the year 2008.[154][155]
In 2008-09, the state Basic Education funding to the Northern Tioga School District was $11,777,103.28.
Accountability Block Grants
Beginning in 2004-2005, the state launched the Accountability Block Grant school funding. This program has provided $1.5 billion to Pennsylvania’s school districts. The Accountability Block Grant program requires that its taxpayer dollars are focused on specific interventions that are most likely to increase student academic achievement. These interventions include: teacher training, all-day kindergarten, lower class size K-3rd grade, literacy and math coaching programs that provide teachers with individualized job-embedded professional development to improve their instruction, before or after school tutoring assistance to struggling students, For 2010-11 the district applied for and received $541,697 in addition to all other state and federal funding. The Northern Tioga School District used the funding to provide all-day kindergarten to 152 pupils.[156][157]
Classrooms for the Future grant
The Classroom for the Future state program provided districts with hundreds of thousands of extra state funding to buy laptop computers for each core curriculum high school class (English, Science, History, Math) and paid for teacher training to optimize the computers use. The program was funded from 2006-2009. Northern Tioga School District was denied funding in 2006-07. In 2007-08 the school received $266,753 and in 2008-09 it received $136,238 for a total of $402,991.[158]
Education Assistance grant
The state's Education Assistance Program funding provides for the continuing support of tutoring services and other programs to address the academic needs of eligible students. Funds are available to eligible school districts and full-time career and technology centers (CTC) in which one or more schools have failed to meet at least one academic performance target, as provided for in Section 1512-C of the Pennsylvania Public School Code. In 2010-11 the Northern Tioga School District received $54,916.[159]
PreK Counts grant
Northern Tioga School District receives state funding to provide preschool at the elementary schools. For the 2011 school year, Pre-K Counts was funded at the 2010 levels of $83.6 million statewide in Gov. Tom Corbett`s proposed budget,. The state also supplements the federal Head Start preschool program with an additional $37.6 million. Pre-K Counts funding was initiated during the Rendell administration. In 2007-08 the state funded Pre-K Counts at $75 million. Northern Tioga School District received funding in 2007-08.[160] In 2009-10, the District received $139,465 to provide preschool to 31 children.[161][162] Funding continued in 2011-12.
Other grants
The District did not participate in the State's Science Its Elementary grant program, the Keystones to Opportunity Literacy grant, or the 21st Century learning grants. Nor did the District seek funding through the DEP's Environmental Education grants program or the 2012 and 2013 Pennsylvania Hybrid Learning Grants.[163]
Federal Stimulus grant
Northern Tioga School District received $2,283,398 in ARRA - Federal Stimulus money to be used in specific programs like special education and meeting the academic needs of low-income students.[164] In 2008 the district reported that 1115 pupils received a free or reduced-price lunch due to low family income. Due to the temporary nature of the funding, schools were repeatedly advised to use the funds for one-time expenditures like acquiring equipment, making repairs to buildings, training teachers to provide more effective instruction or purchasing books and software.
Race to the Top Grant
Northern Tioga School District officials did not apply for the Race to the Top federal grant which would have brought the district hundreds of thousands to one million additional federal dollars for improving student academic achievement.[165] Participation required the administration, the school board and the local teachers' union to sign an agreement to prioritize improving student academic success. In Pennsylvania, 120 public school districts and 56 charter schools agreed to participate. Pennsylvania was not approved forf the grant. The failure of districts to agree to participate was cited as one reason that Pennsylvania was not approved.[166]
Common Cents state initiative
The school board elected to not participate in the Pennsylvania Department of Education Common Cents program. The program called for the state to audit the district, at no cost to local taxpayers, to identify ways the district could save tax dollars.[167] After the review of the information, the district was not required to implement the recommended cost savings changes.
Real estate taxes
In June 2013, the Northern Tioga School Board raised real estate taxes to 15.6405 mills.[168] A mill is $1 of tax for every $1,000 of a property's assessed value. Irregular property reassessments have become a serious issue in the commonwealth as it creates a significant disparity in taxation within a community and across a region.[169] Property taxes, in the Commonwealth of Pennsylvania, apply only to real estate - land and buildings. The property tax is not levied on cars, business inventory, or other personal property. Certain types of property are exempt from property taxes, including: places of worship, places of burial, private social clubs, charitable and educational institutions and government property. Additionally, service related, disabled US military veterans may seek an exemption from paying property taxes. Pennsylvania school district revenues are dominated by two main sources: 1) Property tax collections, which account for the vast majority (between 75-85%) of local revenues; and 2) Act 511 tax collections, which are around 15% of revenues for school districts.[170] During a presentation at a school financing conference, the District's business manager repeatedly expressed concern about the Board's resistance to raising local property taxes.[171]
|
According to a report prepared by the Pennsylvania Department of Education, the total real estate taxes collected by all school districts in Pennsylvania rose from $6,474,133,936 in 1999-00 to $10,438,463,356 in 2008-09.[177] The average yearly property tax paid by Tioga County residents amounts to about 3.44% of their yearly income. Tioga County is ranked 401st of the 3143 United States counties for property taxes as a percentage of median income.[178]
Act 1 Adjusted index
The Act 1 of 2006 Index regulates the rates at which each school district can raise property taxes in Pennsylvania. Districts are not allowed to raise taxes above that index unless they allow voters to vote by referendum, or they seek an exception from the state Department of Education. The base index for the 2011-2012 school year is 1.4 percent, but the Act 1 Index can be adjusted higher, depending on a number of factors, such as property values and the personal income of district residents. Act 1 included 10 exceptions, including: increasing pension costs, increases in special education costs, a catastrophe like a fire or flood, increase in health insurance costs for contracts in effect in 2006 or dwindling tax bases. The base index is the average of the percentage increase in the statewide average weekly wage, as determined by the PA Department of Labor and Industry, for the preceding calendar year and the percentage increase in the Employment Cost Index for Elementary and Secondary Schools, as determined by the Bureau of Labor Statistics in the U.S. Department of Labor, for the previous 12-month period ending June 30. For a school district with a market value/personal income aid ratio (MV/PI AR) greater than 0.4000, its index equals the base index multiplied by the sum of .75 and its MV/PI AR for the current year.[179]
The School District Adjusted Index for the Northern Tioga School District 2006-2007 through 2011-2012.[180]
|
For the 2013-14 budget year, Northern Tioga School Board did not apply for exceptions to exceed their Act 1 Index limit. For the school budget year 2013-14, 311 Pennsylvania public school districts adopted a resolution certifying that tax rates would not be increased above their index. Another 171 school districts adopted a preliminary budget leaving open the option of exceeded the Index limit. For the exception for pension costs, 89 school districts received approval to exceed the Index in full while others received a partial approval of their request. For special education costs, 75 districts received approval to exceed their tax limit. For the pension costs exception, 169 school districts received approval to exceed the Index. Eleven Pennsylvania public school districts received an approval for grandfathered construction debts.[185]
For the 2012-13 budget year, Northern Tioga School Board did not apply for exceptions to exceed the Act 1 Index. For 2012-2013, 274 school districts adopted a resolution certifying that tax rates would not be increased above their index; 223 school districts adopted a preliminary budget leaving open the option of exceeded the Index limit. For the exception for pension costs, 194 school districts received approval to exceed the Index. For special education costs, 129 districts received approval to exceed the tax limit. For the exception for pension costs, 194 school districts received approval to exceed the Index. For special education costs, 129 districts received approval to exceed the tax limit.[186]
For the 2011-12 school year, the Northern Tioga School Board applied for two exceptions to exceed the Act 1 Index: teacher pension costs and special education costs. Each year, the Northern Tioga School Board has the option of adopting either 1) a resolution in January certifying they will not increase taxes above their index or 2) a preliminary budget in February. A school district adopting the resolution may not apply for referendum exceptions or ask voters for a tax increase above the inflation index. A specific timeline for these decisions is published annually, by the Pennsylvania Department of Education.[187]
According to a state report, for the 2011-2012 school year budgets, 247 school districts adopted a resolution certifying that tax rates would not be increased above their index; 250 school districts adopted a preliminary budget. Of the 250 school districts that adopted a preliminary budget, 231 adopted real estate tax rates that exceeded their index. Tax rate increases in the other 19 school districts that adopted a preliminary budget did not exceed the school district’s index. Of the districts who sought exceptions: 221 used the pension costs exemption and 171 sought a Special Education costs exemption. Only 1 school district sought an exemption for Nonacademic School Construction Project, while 1 sought an exception for Electoral debt for school construction.[188]
In 2010, the Northern Tioga School Board applied for exceptions to exceed the Act 1 Index citing Maintenance of Selected Revenue Source and Pension Obligations.[189] In the Spring of 2010, 135 Pennsylvania school boards asked to exceed their adjusted index. Approval was granted to 133 of them and 128 sought an exception for pension costs increases.[190]
Property tax Relief
In 2010, the Homestead/Farmstead Property Tax Relief from gambling for the Northern Tioga School District was $133 per approved permanent primary residence. In the district, 3,559 property owners applied for the tax relief. In Pennsylvania, the highest property tax relief went to residents in Chester Upland School District in Delaware County which received $632 per approved homestead. The relief was subtracted from the total annual school property tax bill. Property owners apply for the relief through the county Treasurer's office. Farmers can qualify for a farmstead exemption on building used for agricultural purposes. The farm must be at least 10 contiguous acres and must be the primary residence of the owner. Farmers can qualify for both the homestead exemption and the farmstead exemption.[191] In 2009 the district's allocation was $142 per homestead.[192]
Property taxes in Pennsylvania are relatively high on a national scale. According to the Tax Foundation, Pennsylvania ranked 11th in the U.S. in 2008 in terms of property taxes paid as a percentage of home value (1.34%) and 12th in the country in terms of property taxes as a percentage of income (3.55%).[193]
Enrollment
Enrollment in Northern Tioga School District was projected by the Pennsylvania Department of Education to decline another 100 pupils to 2039 pupils by 2015.[194] Over the 2000-2010 decade and beyond, rural Pennsylvania school enrollment is projected to decrease by 8 percent. The most significant enrollment decline is projected to be in western Pennsylvania, where rural school districts may have a 16 percent decline.[195] As the enrollment declines, per pupil administrative costs of the schools will continue to rise.
Pennsylvania has one of the highest numbers of school districts in the nation. In Pennsylvania, 80% of the school districts serve student populations under 5,000, and 40% serve less than 2,000. Less than 95 of Pennsylvania's 501 school districts have enrollment below 1250 students, in 2007.[196] This results in excessive school administration bureaucracy and not enough course diversity.[197] In a survey of 88 superintendents of small districts, 42% of the 49 respondents stated that they thought consolidation would save money without closing any schools.[198]
Closed school
Elkland Area High School was closed for the 2012 school year due to sharply declining enrollment and budget crisis. Twenty one teacher position were cut saving $2.1 million in 2012. Students were split between the remaining schools. Closing permitted the district to provide students with more offerings in the remaining two high schools.[199]
In 2010, the school was in School Improvement I level due to dropout rate. In 2009, the school was in Warning - Did not make AYP status.
Graduation rate
2010 - 67%[200]
2009 - 69%
- PSSA Results
|
|
- 11th Grade Science:
- 2010 - 19% on grade level. State - 39% of 11th graders were on grade level.
- 2009 - 25%, State - 40%
- 2008 - 31%, State - 39%
|
|
- 8th Grade Science:
- 2010 - 72% on grade level. State - 57%
- 2009 - 51%, State - 55%
- 2008 - 43%, State - 52%
|
|
Extracurriculars
The Northern Tioga School District offers an extensive program of after school clubs, arts programs and a costly interscholastic athletics program. Eligibility to participate is set by school board policy and communicated via the Athlete's Code of Conduct. Academic Eligibility for athletic activities is based on the premise that academic performance is the keystone of the future and the standard against which participation is measured. Athletes will be passing in all subjects, (60%). Grades will be checked on a weekly basis.[204]
By Pennsylvania law, all K-12 students in the district, including those who attend a private nonpublic school, cyber charter school, charter school and those homeschooled, are eligible to participate in the extracurricular programs, including all athletics. They must meet the same eligibility rules as the students enrolled in the district's schools.[205]
- Williamson High School sports
The District funds:
|
|
- Junior High School Sports
|
|
According to PIAA directory July 2013 [206]
- Cowanesque Valley Junior Senior High School sports
|
|
- Junior High School Sports
|
|
References
- ↑ Northern Tioga School Board Secretary (June 28, 2012). "Special Board Meeting minutes" (PDF).
- ↑ Pennsylvania Department of Education, Northern Tioga School District Enrollment and Projections January 2009
- ↑ "Northern Tioga School District passes budget with 2.5 percent hike". Williamsport Sun-Gazette. June 29, 2013.
- ↑ Jay Himes, Executive Director PA Assoc. of School Business Officials and Wanda Erb, Business Manager Northern Tioga School District (November 16, 2012). "2012 EPLC Education Finance Symposium" (PDF).
- ↑ US Census Bureau, 2010 Census Poverty Data by Local Educational Agency, 2011
- ↑ Pennsylvania Public School Code Governance 2010
- ↑ The Commonwealth Foundation for Public Policy Alternatives. "The Pennsylvania Project". Retrieved May 20, 2010.
- ↑ "Statewide Honor Roll Rankings 2013". Pittsburgh Business Times. April 5, 2013.
- ↑ Pittsburgh Business Times (April 30, 2010). "Statewide Honor Roll Rankings".
- ↑ Pennsylvania Public School Rankings, Pittsburgh Business Times. May 23, 2008.
- ↑ Pittsburgh Business Times, Statewide Overachivers Ranking Information, April 3, 2013
- ↑ "Overachiever statewide ranking". Pittsburgh Business Times. May 6, 2010.
- ↑ The Morning Call (2009). "2009 PSSA RESULTS Northern Tioga School District".
- ↑ Pennsylvania Department of Education (October 2012). "Northern Tioga School District AYP Overview 2012".
- ↑ Pennsylvania Department of Education, Pennsylvania Public School District AYP History, 2011
- ↑ Pennsylvania Department of Education, Pennsylvania District AYP History 2003-2010, 2011
- ↑ National Center for Education Statistics, Common Care Data - Cowanesque Valley Junior Senior High School, 2010
- ↑ Pennsylvania Department of Education, Professional Qualifications of Teachers Cowanesque Valley Junior Senior High School, September 29, 2011
- ↑ Pennsylvania Department of Education (December 2, 2013). "Cowanesque Valley Junior Senior High School Fast Facts 2013".
- ↑ Pennsylvania Department of Education (September 21, 2012). "Cowanesque Valley Junior Senior High School Academic Achievement Report Card 2012 data table".
- ↑ Pennsylvania Department of Education, Cowanesque Valley Junior Senior High School Academic Achievement Report Card 2010 data table, October 20, 2010
- ↑ Pennsylvania Department of Education (October 4, 2013). "Cowanesque Valley Junior Senior High School Academic Performance Data 2013".
- ↑ Pennsylvania Department of Education (September 21, 2012). "Cowanesque Valley Junior Senior High School AYP data table 2012".
- ↑ Pennsylvania Department of Education, Cowanesque Valley Junior Senior High School Academic Report Card 2011, September 29, 2011
- ↑ Pennsylvania Department of Education (2012). "Pennsylvania Accountability System Frequently Asked Questions".
- ↑ Pennsylvania Department of Education (September 29, 2012). "2011-2012 PSSA and AYP Results".
- ↑ Pennsylvania Department of Education (September 29, 2011). "2010-2011 PSSA and AYP Results".
- ↑ Pennsylvania 2009 -2010 PSSA and AYP Results Reading, Math, Science, Writing
- ↑ Cowanesque Valley Junior Senior High School Report Card 2009
- ↑ Pennsylvania Department of Education (August 15, 2008). "Pennsylvania 2007-2008 PSSA and AYP Results Reading, Math, Science, Writing".
- ↑ Pittsburgh Post Gazette (October 15, 2012). "How is your school doing?".
- ↑ Pennsylvania Department of Education, Cowanesque Valley Junior Senior High School Academic Achievement Report Card 2011, September 29, 2011
- ↑ Pennsylvania Department of Education, Cowanesque Valley Junior Senior High School Academic Achievement Report Card 2010, October 20, 2010
- ↑ Pennsylvania Department of Education, Cowanesque Valley Junior Senior High School Academic Achievement Report Card 2009, September 14, 2009
- ↑ Pennsylvania Department of Education (September 21, 2012). "Cowanesque Valley Junior Senior High School Academic Achievement Report Card 2012" (PDF).
- ↑ Pennsylvania Department of Education (September 29, 2011). "2010-2011 PSSA results in Science".
- ↑ The Pennsylvania Basic Education/Higher Education Science and Technology Partnership, Science in Motion annual report, 2012
- ↑ College Board (2013). "The 2013 SAT Report on College & Career Readiness".
- ↑ Pennsylvania Department of Education (2011). "Public School SAT Scores 2011".
- ↑ College Board (September 2011). "SAT Scores State By State - Pennsylvania".
- ↑ "While U.S. SAT scores dip across the board, N.J. test-takers hold steady". September 2011.
- ↑ Pennsylvania Department of Education (October 4, 2013). "Williamson High School Fast Facts 2013".
- ↑ National Center for Education Statistics, Common Care Data - Williamson High School, 2010
- ↑ Pennsylvania Department of Education, Professional Qualifications of Teachers Williamson Senior High School, September 29, 2011
- ↑ Pennsylvania Department of Education (October 4, 2013). "Williamson Senior High School Academic Performance Data 2013,".
- ↑ Pennsylvania Department of Education (September 21, 2012). "Williamson Senior high School AYP Overview 2012".
- ↑ Pennsylvania Department of Education, Williamson High School Academic Report Card 2011, September 29, 2011
- ↑ Pennsylvania Department of Education, Williamson Senior High School Academic Achievement Report Card 2010 data table, October 20, 2010
- ↑ Pennsylvania Department of Education (September 21, 2012). "Williamson Senior High School Academic Report Card 2012" (PDF).
- ↑ Pennsylvania Department of Education (October 20, 2010). "Pennsylvania 2009 -2010 PSSA and AYP Results Reading, Math, Science, Writing".
- ↑ Pennsylvania Department of Education (September 14, 2009). "Williamson Senior High School Academic Achievement Report Card 2009".
- ↑ Pennsylvania Department of Education (August 14, 2008). "Pennsylvania 2007-2008 PSSA and AYP Results Reading, Math, Science, Writing".
- ↑ Pittsburgh Post Gazette (October 15, 2012). "How is your school doing?".
- ↑ Pennsylvania Department of Education, Williamson High School Academic Achievement Report Card 2011, September 29, 2011
- ↑ Pennsylvania Department of Education, Williamson High School Academic Achievement Report Card 2010, October 20, 2010
- ↑ Pennsylvania Department of Education, Williamson High School Academic Achievement Report Card 2009, September 14, 2009
- ↑ Pennsylvania Department of Education, Williamson High School Academic Achievement Report Card 2008, August 15, 2008
- ↑ Pittsburgh Post Gazette (October 15, 2012). "How is your school doing?".
- ↑ College Board (2013). "The 2013 SAT Report on College & Career Readiness".
- ↑ Pennsylvania Department of Education (2011). "Public School SAT Scores 2011".
- ↑ College Board (September 2011). "SAT Scores State By State - Pennsylvania".
- ↑ "While U.S. SAT scores dip across the board, N.J. test-takers hold steady". NJ.com. September 2011.
- ↑ Northern Tioga School District Curriculum Guide 2010
- ↑ Pennsylvania Department of Education, Graduation Requirements Policy, August 2013
- ↑ Pennsylvania General Assembly, Pennsylvania Code §4.24 (a) High school graduation requirements, 2010
- ↑ Pennsylvania State Board of Education, Proposed changes to Chapter 4, May 10, 2012
- ↑ Pennsylvania Department of Education (2010). "Keystone Exam Overview" (PDF).
- ↑ Megan Harris (September 12, 2013). "Pennsylvania changing high school graduation requirements". Tribune Live.
- ↑ Pennsylvania Department of Education (September 2011). "Pennsylvania Keystone Exams Overview".
- ↑ Pennsylvania State Board of Education (2010). "Rules and Regulation Title 22 PA School Code CH. 4".
- ↑ Pennsylvania Department of Education, State Board of Education Finalizes Adoption of Pennsylvania Common Core State Academic Standards and High School Graduation Requirements, March 14, 2013
- ↑ Pennsylvania Department of Education (2011). "Keystone Exams".
- ↑ National Center for Education Statistics, Common Care Data – Clark Wood Elementary School, 2010
- ↑ Pennsylvania Department of Education, Professional Qualifications of Teachers Clark Wood Elementary School, September 29, 2011
- ↑ Pennsylvania Partnership for Children, Full-Day Kindergarten Enrollment, 2010
- ↑ Pennsylvania Department of Education (October 4, 2013). "Clark Wood Elementary School Academic Performance Data 2013".
- ↑ Pennsylvania Department of Education, Clark Wood Elementary School AYP Overview, September 29, 2011
- ↑ Pennsylvania Department of Education (September 21, 2012). "Clark Wood Elementary School Report Card 2012" (PDF).
- ↑ Pennsylvania Department of Education (September 14, 2009). "Clark Wood Elementary School Academic Achievement Report Card 2009".
- ↑ National Center for Education Statistics, Common Care Data – Russell Walter Elementary School, 2010
- ↑ Pennsylvania Department of Education, Professional Qualifications of Teachers Russell Walter Elementary School, September 21, 2012
- ↑ Pennsylvania Partnership for Children, Full-Day Kindergarten Enrollment, 2010
- ↑ Pennsylvania Department of Education (October 4, 2013). "Russell Walter Elementary School Academic Performance Data 2013,".
- ↑ Pennsylvania Department of Education, (September 21, 2012). "Russell Walter Elementary School AYP Overview 2012 & 2011".
- ↑ Pennsylvania Department of Education (September 21, 2012). "Russell Walter Elementary School Report Card 2012" (PDF).
- ↑ Pennsylvania Department of Education (September 2012). "Russell Walter Elementary School Academic Achievement Report Card 2009".
- ↑ National Center for Education Statistics, Common Care Data – Westfield Area Elementary School, 2010
- ↑ Pennsylvania Department of Education, Professional Qualifications of Teachers Westfield Area Elementary School, September 29, 2011
- ↑ Pennsylvania Partnership for Children, Full-Day Kindergarten Enrollment 2008, 2010
- ↑ Pennsylvania Department of Education, Northern Tioga School District Academic Report Card 2012, 2012
- ↑ Pennsylvania Department of Education (October 4, 2013). "Westfield Area Elementary School Academic Performance Data 2013".
- ↑ Pennsylvania Department of Education, Westfield Area Elementary School AYP Overview 2012, September 21, 2012
- ↑ Pennsylvania Department of Education (September 21, 2012). "Westfield Area Elementary School Report Card 2012" (PDF).
- ↑ Pennsylvania Department of Education (September 14, 2009). "Westfield Area Elementary School Academic Achievement Report Card 2009".
- ↑ Pennsylvania BUreau of Special Education (2013). "Northern Tioga School District Special Education data report" (PDF).
- ↑ Pennsylvania Bureau of Special Education Services (2009–2010). "Northern Tioga School District Special Education Data Report LEA Performance on State Performance Plan (SPP) Targets".
- ↑ Northern Tioga School District Administration. "Northern Tioga School District Student Services Notice".
- ↑ Northern Tioga School District Special Education Data Report LEA Performance on State Performance Plan (SPP) Targets School Year 2008-2009
- ↑ Pennsylvania Department of Education. "Pennsylvania Special Education Funding".
- ↑ Browne, Patrick., Senate Education Committee Hearing on Special Education Funding & Accountability testimony, November 1, 2011
- ↑ Kintisch, Baruch., Public Hearing: Special Education Funding & Accountability Testimony, Education Law Center, November 11, 2011
- ↑ Amy Morton, Executive Deputy Secretary, Public Hearing: Special Education Funding & Accountability Testimony, Pennsylvania Department of Education, November 11, 2011
- ↑ US Department of Education, U.S. Department of Education Clarifies Schools' Obligation to Provide Equal Opportunity to Students with Disabilities to Participate in Extracurricular Athletics, January 25, 2013
- ↑ Pennsylvania Department of Education (July 2010). "Special Education Funding from Pennsylvania State_2010-2011".
- ↑ Pennsylvania Department of Education (2011). "Special Education Funding 2011-2012 Fiscal Year".
- ↑ Pennsylvania Department of Education (April 2012). "Investing in PA kids".
- ↑ Pennsylvania Department of Education (2006). "LRE Index Scores and Identification for Monitoring".
- ↑ Martin Elks, Ph.D. (June 3, 2010). "FINAL REPORT OF THE BUREAU DIRECTOR’S ADVISORY PANEL ON LEAST RESTRICTIVE ENVIRONMENT FOLLOWING GASKIN V. DEPARTMENT OF EDUCATION SEPTEMBER, 2005—JUNE, 2010" (PDF).
- ↑ Pennsylvania Department of Education (July 1, 2002). "Least Restrictive Environment (LRE) and Educational Placement for Students with Individualized Education Programs (IEPs)".
- ↑ Pennsylvania Department of Education (September 1, 1997). "Placement Options for Special Education".
- ↑ Pennsylvania Department of Education Bureau of Special Education (2010). "LRE Index Scores".
- ↑ Pennsylvania Department of Education (Revised December 1, 2009 Child Count (Collected July 2010)). "Gifted Students as Percentage of Total Enrollment by School District/Charter School" (PDF). Check date values in:
|date=(help) - ↑ Pennsylvania Department of Education and Pennsylvania School Board. "CHAPTER 16. Special Education For Gifted Students". Retrieved February 4, 2011.
- ↑ Pennsylvania Department of Education (March 26, 2010). "Special Education for Gifted Students Notice of Parental rights" (PDF).
- ↑ Pennsylvania General Assembly, Taxpayer Relief Act, Act 1 of the Special Session of 2006, June 27, 2006
- ↑ Pennsylvania Department of Education (2012). "Investing in Pennsylvania Students".
- ↑ Pennsylvania Department of Education (2012). "Investing in Pennsylvania Students".
- ↑ American Enterprise Institute, (2011). "Assessing the Compensation of Public School Teachers".
- ↑ Asbury Park Press (2009). "PA. Public School Salaries".
- ↑ Northern Tioga School Board (2006). "Northern Tioga School District Teacher Union Employment Contract 2010".
- ↑ Fenton, Jacob, Average classroom teacher salary in Tioga County, 2006-07. The Morning Call. Accessed March 2009.
- ↑ Asbury Park Press (2009). "PA Public School Salaries 2009,".
- ↑ Northern Tioga Education Association Contract 2009
- ↑ Fenton, Jacob. Pennsylvania School District Data: Will School Consolidation Save Money?, The Morning Call, Feb 2009.
- ↑ Per Pupil Spending in Pennsylvania Public Schools in 2008 Sort Spending
- ↑ Pennsylvania Department of Education (2010). "2009-10 Selected Data - 2009-10 Total Expenditures per ADM".
- ↑ US Census Bureau, States Ranked According to Per Pupil Public Elementary-Secondary School System Finance Amounts: Fiscal Year 2011, May 2013
- ↑ US Census Bureau (2009). "Total and current expenditures per pupil in fall enrollment in public elementary and secondary education, by function and state or jurisdiction: 2006-07".
- ↑ US Census Bureau (March 2003). "Public Education Finances 2000-01 Annual Survey of Local Government Finances" (PDF).
- ↑ US Census Bureau (2009). "Total and current expenditures per pupil in fall enrollment in public elementary and secondary education, by function and state or jurisdiction: 2006-07".
- ↑ United States Census Bureau (2009). "States Ranked According to Per Pupil Elementary-Secondary Public School System Finance Amounts: 2008-09" (PDF).
- ↑ US Census Bureau (May 2013). "States Ranked According to Per Pupil Public Elementary-Secondary School System Finance Amounts: Fiscal Year 2011" (PDF).
- ↑ NORTHERN TIOGA School District Budget 2008-09
- ↑ Northern Tioga School Board (June 2009). "Northern Tioga School District Budget 2009-10".
- ↑ Murphy, Jan., Pennsylvania's public schools boost reserves, CentreDaily Times, September 22, 2010
- ↑ Melissa Daniels (June 1, 2013). "PA school districts look to cash stash to balance budgets". PA Independent.
- ↑ PENNSYLVANIA PERFORMANCE AUDIT REPORT (July 2009). "NORTHERN TIOGA SCHOOL DISTRICT TIOGA COUNTY,".
- ↑ Pennsylvania Department of Education (May 2012). "Pennsylvania Public School District Tuition Rates".
- ↑ Penn State Cooperative Extension (2010). "What are the Local Taxes in Pennsylvania?, Local Tax Reform Education Project" (PDF).
- ↑ Pennsylvania Department of Revenue. "Personal Income Taxation Guidelines date=April 2010".
- ↑ John Finnerty (2013). "PA teachers pensions". CNHI Harrisburg Bureau.
- ↑ Democrat Appropriations Committee, Report on Education funding by LEA, July 2, 2013
- ↑ Pennsylvania Office of the Budget, 2013-14 State Budget Highlights, 2013
- ↑ Senator Jake Corman (June 28, 2012). "Pennsylvania Education funding by Local School District" (PDF).
- ↑ Pennsylvania General Assembly Sen Jake Corman (June 29, 2012). "SB1466 of 2012 General Fund Appropriation".
- ↑ PA Senate Appropriations Committee (June 28, 2011). "School District 2011-12 Funding Report".
- ↑ Pennsylvania Department of Education (July 2011). "Basic Education Funding".
- ↑ Pennsylvania Department of Education (June 30, 2011). "Basic Education Funding".
- ↑ Pennsylvania Department of Education (June 30, 2011). "Basic Education Funding 2011-2012 Fiscal Year".
- ↑ Pennsylvania Department of Education, District Allocations Report 2009, 2009-10
- ↑ PA Basic Education Funding-Printout2 2010-2011
- ↑ Pennsylvania Department of Education Funding Report by LEA October 2009.
- ↑ Pennsylvania Department of Education 2009-2010 Funding Report by LEA October 2009.
- ↑ U.S. Census Bureau., Annual Survey of Local Government Finances., 2000
- ↑ U.S. Census Bureau., 2008 Survey of Local Government Finances – School Systems, 2010
- ↑ Pennsylvania Department of Education - Accountability Block Grant report 2010, Grantee list 2010
- ↑ Accountability Block Grant Mid Year report
- ↑ Pennsylvania Auditor General CFF grants audit 12/22/08
- ↑ Pennsylvania Department of Education - Educational Assistance Program Funding 2010-2011 Fiscal Year
- ↑ Governor's Press Office (August 10, 2007). "Governor Rendell Announces Grants for 'Pre-K Counts' Early Childhood Initiative".
- ↑ Pennsylvania Department of Education (2010). "Pennsylvania PreK Counts End of Year Report 2009-10" (PDF).
- ↑ Office of Child Development and Early Learning (2009). "Early Childhood Programs - PreK Counts".
- ↑ Pennsylvania Department of Edcuation Press Office (October 17, 2013). "Acting Secretary of Education Says Hybrid Learning Benefits Students; Highlights Success of First-Year Pilot Program".
- ↑ Commonwealth of Pennsylvania (2009). "Tioga County ARRA FUNDING 2009-2010".
- ↑ Pennsylvania's 'Race to the Top' Fueled by Effective Reforms, Strong Local Support
- ↑ Race to the Top Fund, U.S. Department of Education, March 29, 2010.
- ↑ Common Cents program - Making Every Dollar Count
- ↑ Pennsylvania Department of Education (2013). "Finances_Real Estate Tax Rates 2013-14".
- ↑ Pennsylvania Department of Education (2012). "Real Estate Tax Rates by School District 2012-13 Real Estate Mills".
- ↑ Pennsylvania Department of Education (2004). "Act 511 Tax Report".
- ↑ Education Policy Leadership Conference, School Finance Symposium, November 2012
- ↑ Pennsylvania Department of Revenue (2009). "Real Estate Tax Millage by School District".
- ↑ Pennsylvania Department of Education (2008). "Pennsylvania School District Real Estate Tax Rates 2008-09".
- ↑ Pennsylvania Department of Education, Real Estate Tax Millage by School District, 2008
- ↑ Pennsylvania Department of Education, Real Estate Tax Millage by School District, 2006
- ↑ Pennsylvania Department of Education, Real Estate Tax Millage by School District, 2005
- ↑ Pennsylvania Department of Education (2009). "Pennsylvania School Finances - Summaries of Annual Financial Report Data 2008-09".
- ↑ Tioga County Property Taxes 2012, Tax-rates.org, 2012
- ↑ Pennsylvania Department of Education 2010-11 Act 1 of 2006 Referendum Exception Guidelines.
- ↑ Special Session Act 1 of 2006 School District Adjusted Index for 2006-2007 through 2010-2011, Report prepared by Pennsylvania Department of Education, May 2010.
- ↑ Pennsylvania Department of Education, 2011-2012 School District Adjusted Index, September 2010
- ↑ Pennsylvania Department of Education, 2012-2013 School District Adjusted Index, September 2011
- ↑ Pennsylvania Department of Education, 2013-2014 School District Adjusted Index, September 2012
- ↑ Pennsylvania Department of Education, 2014-2015 School District Adjusted Index, September 2013
- ↑ Pennsylvania Department of Education, Report on Referendum Exceptions For School Year 2013-2014, April 2013
- ↑ Pennsylvania Department of Education, Report on Referendum Exceptions For School Year 2012-2013, March 30, 2012
- ↑ Pennsylvania Department of Education (2011). "Special Session Act 1 of 2006 the Taxpayer Relief Act information".
- ↑ Pennsylvania Department of Education (April 2011). "Report on Exceptions".
- ↑ Pennsylvania Special Session Act1 property tax relief Report_2009-2010_May09
- ↑ Scarcella, Frank and Pursell, Tricia, Local school tax assessments exceed state averages. The Daily Item, May 25, 2010
- ↑ Property Tax Reduction Allocations 2010-2011 Fiscal Year
- ↑ Pennsylvania Property Tax Reduction Allocations
- ↑ New Census Data on Property Taxes on Homeowners, Tax Foundation, September 22, 2009.
- ↑ Pennsylvania Department of Education. "Enrollment Data and Statistics".
- ↑ "Research Analyzes Rural School District Enrollment and Building Capacity", The Center for Rural Pennsylvania. October 2009
- ↑ Pennsylvania Legislative Budget and Finance Committee, Study of the Cost Effectiveness of Consolidating Pennsylvania School Districts, 2007.
- ↑ Rendell, E. & Soderberg, M. (2009). Pennsylvania school district consolidation. 2009-10 Executive Budget Fast Facts. Pennsylvania Office of the Governor.
- ↑ Study of the cost-effectiveness of consolidating Pennsylvania districts. New York: Standard & Poor’s School Evaluation Services. 2007, p. 6.
- ↑ Mich, Bill (July 3, 2011). "District closes Elkland Area High School".
- ↑ Elkland Area High School Academic Achievement Report Card 2010 data table
- ↑ Pennsylvania 2009 -2010 PSSA and AYP Results Reading, Math, Science, Writing
- ↑ Elkland Area High School Academic Achievement Report Card 2009
- ↑ Pennsylvania 2007-2008 PSSA and AYP Results Reading, Math, Science, Writing
- ↑ Northern Tioga School District Athletes’ Code
- ↑ Home-Schooled, Charter School Children Can Participate in School District Extracurricular Activities, Pennsylvania Office of the Governor Press Release, November 10, 2005
- ↑ Pennsylvania Interscholastic Athletics Association (2013). "PIAA School Directory".
| ||||||||||||||||||||||||||||||||||||||||