Northern Ireland general election, 1965
Northern Ireland 1921–72
|
|---|
 |
This article is part of a series on the
politics and government of
Northern Ireland 1921–72 |
|
|
- 1921, 1925, 1929, 1933
- 1938, 1945, 1949, 1953
- 1958, 1962, 1965, 1969
- Senate
|
|
|
|
|
|
|
|
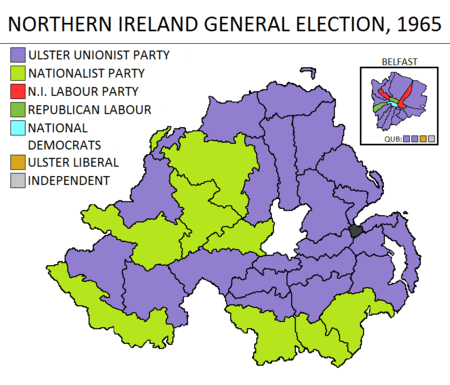
The Northern Ireland general election, 1965 was held on 25 November 1965. Like all previous elections to the Parliament of Northern Ireland, it produced a large majority for the Ulster Unionist Party. This was the last election in Northern Ireland in which one party won a majority of the vote. The Ulster Unionists increased their vote share largely due to a reduction in the number of uncontested seats, but also picked up two additional seats. Similarly, the Nationalist vote share decreased largely due to more of the seats in which they stood candidates being contested.
Results
| Northern Ireland General Election 1965 |
|
Candidates |
Votes |
| Party |
Standing |
Elected |
Gained |
Unseated |
Net |
% of total |
% |
No. |
Net % |
| |
UUP |
41 |
36 |
2 |
0 |
+ 2 |
69.2 |
59.1 |
191,896 |
+10.3 |
| |
NI Labour |
17 |
2 |
0 |
2 |
- 2 |
3.8 |
20.4 |
66,323 |
-12.3 |
| |
Nationalist |
9 |
9 |
0 |
0 |
0 |
17.3 |
8.2 |
26,748 |
-6.9 |
| |
National Democratic |
1 |
1 |
1 |
0 |
+ 1 |
1.9 |
4.7 |
15,206 |
N/A |
| |
Liberal |
4 |
1 |
0 |
0 |
0 |
1.9 |
3.9 |
12,618 |
+0.3 |
| |
Independent Labour |
1 |
0 |
0 |
0 |
0 |
0 |
1.4 |
4,371 |
-1.7 |
| |
Republican Labour |
2 |
2 |
1 |
0 |
+ 1 |
3.8 |
1.0 |
3,326 |
-1.5 |
| |
New Ireland Movement |
1 |
0 |
0 |
0 |
0 |
0 |
1.0 |
3,111 |
N/A |
| |
Independent Republican |
1 |
0 |
0 |
0 |
0 |
0 |
0.2 |
682 |
N/A |
| |
Communist (NI) |
1 |
0 |
0 |
0 |
0 |
0 |
0.1 |
308 |
N/A |
| |
Independent |
1 |
1 |
0 |
0 |
0 |
1.9 |
0.0 |
0 |
-0.4 |
All parties shown. The only independent candidate was elected unopposed.
Electorate: 907,667 (563,252 in contested seats); Turnout: 57.6% (324,589).
Votes summary
| Popular vote |
|---|
|
|
|
|
|
| Ulster Unionist |
|
59.12% |
| Labour |
|
20.43% |
| Nationalist |
|
8.24% |
| National Democratic |
|
4.68% |
| Ulster Liberal |
|
3.89% |
| Independent Labour |
|
1.35% |
| Republican Labour |
|
1.02% |
| New Ireland Movement |
|
0.96% |
| Independent Republican |
|
0.21% |
| Communist |
|
0.09% |
Seats summary
| Parliamentary seats |
|---|
|
|
|
|
|
| Ulster Unionist |
|
69.23% |
| Labour |
|
3.85% |
| Nationalist |
|
17.31% |
| National Democratic |
|
1.92% |
| Ulster Liberal |
|
3.89% |
| Republican Labour |
|
1.92% |
| Independent |
|
1.92% |
See also
- MPs elected in the Northern Ireland general election, 1965
References