Northern Ireland general election, 1962
Northern Ireland 1921–72
|
|---|
 |
This article is part of a series on the
politics and government of
Northern Ireland 1921–72 |
|
|
- 1921, 1925, 1929, 1933
- 1938, 1945, 1949, 1953
- 1958, 1962, 1965, 1969
- Senate
|
|
|
|
|
|
|
|
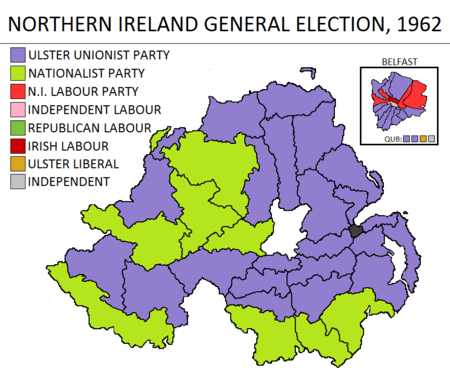
The Northern Ireland general election, 1962 was held on 31 May 1962. Like all previous elections to the Parliament of Northern Ireland, it produced a large majority for the Ulster Unionist Party.
Results
| Northern Ireland General Election 1962 |
|
Candidates |
Votes |
| Party |
Standing |
Elected |
Gained |
Unseated |
Net |
% of total |
% |
No. |
Net % |
| |
UUP |
45 |
34 |
0 |
2 |
- 2 |
65.3 |
48.8 |
147,629 |
+4.8 |
| |
NI Labour |
14 |
4 |
0 |
0 |
0 |
7.7 |
25.4 |
76,842 |
+9.6 |
| |
Nationalist |
9 |
9 |
2 |
0 |
+ 2 |
17.3 |
15.1 |
45,860 |
+0.2 |
| |
Liberal |
4 |
1 |
1 |
0 |
+ 1 |
1.9 |
3.6 |
11,005 |
+3.3 |
| |
Republican Labour |
1 |
1 |
0 |
0 |
0 |
1.9 |
2.5 |
7,662 |
-0.6 |
| |
Independent Labour |
2 |
0 |
0 |
0 |
0 |
0.0 |
2.3 |
6,946 |
+0.3 |
| |
Irish Labour |
1 |
1 |
1 |
0 |
+ 1 |
1.9 |
1.1 |
3,288 |
-1.9 |
| |
Ind. Labour Group |
2 |
1 |
0 |
0 |
0 |
1.9 |
0.8 |
2,343 |
-1.2 |
| |
Independent |
1 |
1 |
0 |
0 |
0 |
1.9 |
0.4 |
1,220 |
-1.4 |
| |
World Socialist |
1 |
0 |
0 |
0 |
0 |
|
0.0 |
66 |
N/A |
All parties shown.
Electorate: 903,596 (458,838 in contested seats); Turnout: 66.0% (302,681).
Votes summary
| Popular vote |
|---|
|
|
|
|
|
| Ulster Unionist |
|
48.77% |
| Labour |
|
25.39% |
| Nationalist Party |
|
15.15% |
| Independent Labour |
|
3.07% |
| Republican Labour |
|
2.53% |
| Irish Labour |
|
1.07% |
| World Socialist |
|
0.02% |
| Ulster Liberal |
|
3.64% |
| Independent |
|
0.4% |
Seats summary
| Parliamentary seats |
|---|
|
|
|
|
|
| Ulster Unionist |
|
65.38% |
| Labour |
|
7.69% |
| Nationalist Party |
|
17.31% |
| Independent Labour |
|
1.92% |
| Republican Labour |
|
1.92% |
| Irish Labour |
|
1.92% |
| Ulster Liberal |
|
1.92% |
| Independent |
|
1.92% |
See also
- MPs elected in the Northern Ireland general election, 1962
References