Northern Ireland general election, 1938
Northern Ireland general election, 1938

|
|
|
|
|
|
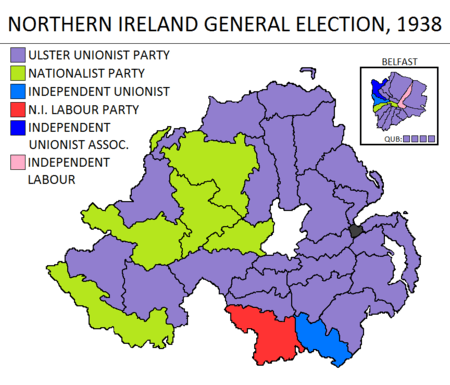
| Election results by constituency. |
|
Northern Ireland 1921–72
|
|---|
|
This article is part of a series on the
politics and government of
Northern Ireland 1921–72 |
|
|
- 1921, 1925, 1929, 1933
- 1938, 1945, 1949, 1953
- 1958, 1962, 1965, 1969
- Senate
|
|
|
|
|
|
|
|
The Northern Ireland general election, 1938 was held on 9 February 1938. Like all previous elections to the Parliament of Northern Ireland, it produced a large majority for the Ulster Unionist Party.
Results
| Northern Ireland General Election 1938 |
|
Candidates |
Votes |
| Party |
Standing |
Elected |
Gained |
Unseated |
Net |
% of total |
% |
No. |
Net % |
| |
UUP |
43 |
39 |
3 |
0 |
+ 3 |
75 |
56.8 |
187,684 |
+13.3 |
| |
Progressive Unionist |
10 |
0 |
0 |
0 |
0 |
|
12.4 |
41,028 |
N/A |
| |
Ind. Unionist Association |
6 |
1 |
1 |
0 |
+ 1 |
1.9 |
8.6 |
28,459 |
N/A |
| |
Independent Unionist |
5 |
2 |
1 |
2 |
- 1 |
3.8 |
6.8 |
22,354 |
-14.5 |
| |
NI Labour |
7 |
1 |
1 |
2 |
- 1 |
1.9 |
5.7 |
18,775 |
-2.8 |
| |
Nationalist |
9 |
8 |
0 |
1 |
- 1 |
15.4 |
4.9 |
16,167 |
-2.8 |
| |
Independent |
3 |
0 |
0 |
0 |
0 |
|
2.2 |
7,482 |
+2.0 |
| |
Independent Labour |
1 |
1 |
1 |
0 |
+ 1 |
1.9 |
1.7 |
5,480 |
N/A |
| |
Independent Progressive Unionist |
1 |
0 |
0 |
0 |
0 |
|
0.9 |
2,926 |
N/A |
Electorate: 825,101 (464,860 in contested seats); Turnout: 71.1% (330,355).
Votes summary
| Popular vote |
|---|
|
|
|
|
|
| Ulster Unionist |
|
56.81% |
| Progressive Unionist |
|
12.42% |
| Nationalist Party |
|
4.89% |
| Independent Unionist |
|
6.77% |
| Labour |
|
5.68% |
| Independent Unionist Association |
|
8.61% |
| Independent Labour |
|
1.66% |
| Independent Progressive Unionist |
|
0.89% |
| Independent |
|
2.26% |
Seats summary
| Parliamentary seats |
|---|
|
|
|
|
|
| Ulster Unionist |
|
75% |
| Nationalist Party |
|
15.38% |
| Independent Unionist |
|
3.85% |
| Labour |
|
1.92% |
| Independent Unionist Association |
|
1.92% |
| Independent Labour |
|
1.92% |
References