Northampton South (UK Parliament constituency)
| Northampton South | |
|---|---|
|
Borough constituency for the House of Commons | |
|
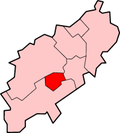
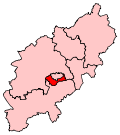
Boundary of Northampton South in Northamptonshire. | |
|
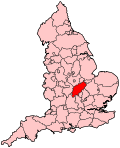
Location of Northamptonshire within England. | |
| County | Northamptonshire |
| Electorate | 63,748 (December 2010)[1] |
| Major settlements | Northampton (part) |
| Current constituency | |
| Created | 1974 |
| Member of parliament | Brian Binley (Conservative) |
| Number of members | One |
| Created from | Northampton |
| Overlaps | |
| European Parliament constituency | East Midlands |
Northampton South is a constituency[n 1] represented in the House of Commons of the UK Parliament since 2005 by Brian Binley, a Conservative.[n 2]
History
This constituency was created for the election of February 1974 when the old constituency of Northampton was split into Northampton South and Northampton North.
Since creation it is generally a marginal and in elections since 1979 but one, in 2005, has been a bellwether, electing an MP from the winning (or largest governing) party.
The one-time Deputy Speaker of the House, Michael Morris, a Conservative, held this seat from its creation in 1974 until 1997, when Tony Clarke defeated Morris in a surprise result (one of many in the Labour landslide of that year) to gain the seat for Labour with a majority of just 744. Clarke only just increased his majority in 2001, but Brian Binley defeated Clarke to regain the seat for the Conservatives in 2005 with a comfortable majority, and has held it since.
Boundaries
Parliament accepted the Boundary Commission's Fifth Periodic Review of Westminster constituencies which removed the southern part of this constituency into a new seat for the 2010 general election since which it has electoral wards:
- Billing, Castle, Delapre, Ecton Brook, New Duston, Old Duston, St Crispin, St James, Spencer and Weston[2]
South Northamptonshire is the 2010-created constituency in the county which absorbed part of the version (existing until that year) of this constituency.
Constituency profile
The constituency has income, social housing and unemployment statistics[3] close to the national average and a varied and dynamic service and engineering-centred economy typical of the East Midlands with significant foodstuffs, clothing and consumables manufacturing and processing operations.[4]
Members of Parliament
| Election | Member[5] | Party | |
|---|---|---|---|
| Feb 1974 | Michael Morris | Conservative | |
| 1997 | Tony Clarke | Labour | |
| 2005 | Brian Binley | Conservative | |
Elections
Elections in the 2010s
| General Election 2015: Northampton South [6] | |||||
|---|---|---|---|---|---|
| Party | Candidate | Votes | % | ±% | |
| Liberal Democrat | Sadik Chaudhury | ||||
| Green | Julie Hawkins | ||||
| Conservative | David Mackintosh[7] | ||||
| Labour | Kevin McKeever[7] | ||||
| UKIP | Rose Gibbins[7] | ||||
| General Election 2010: Northampton South[8][9] | |||||
|---|---|---|---|---|---|
| Party | Candidate | Votes | % | ±% | |
| Conservative | Brian Binley | 15,917 | 40.8 | -2.9 | |
| Labour | Clyde Loakes | 9,913 | 25.4 | -16.1 | |
| Liberal Democrat | Paul Varnsverry | 7,579 | 19.4 | +5.9 | |
| Independent | Tony Clarke | 2,242 | 5.8 | N/A | |
| UKIP | Derek Clark | 1,897 | 4.9 | +2.8 | |
| English Democrats | Kevin Sills | 618 | 1.6 | N/A | |
| Green | Julie Hawkins | 363 | 0.9 | N/A | |
| Northampton Save our Public Services | Dave Green | 325 | 0.8 | N/A | |
| Independent | Kevin Wilshire | 65 | 0.2 | N/A | |
| Scrap Members' Allowances | Liam Costello | 59 | 0.2 | N/A | |
| Majority | 6,004 | 15.4 | |||
| Turnout | 38,978 | 58.2 | -0.6 | ||
| Conservative hold | Swing | 9.6 | |||
Elections in the 2000s
| General Election 2005: Northampton South | |||||
|---|---|---|---|---|---|
| Party | Candidate | Votes | % | ±% | |
| Conservative | Brian Binley | 23,818 | 43.7 | +2.6 | |
| Labour | Tony Clarke | 19,399 | 35.6 | −7.3 | |
| Liberal Democrat | Kevin Barron | 8,327 | 15.3 | +2.8 | |
| UKIP | Derek Clark | 1,032 | 1.9 | −0.5 | |
| Veritas | Tony Green | 508 | 0.9 | N/A | |
| S O S! Voters Against Overdevelopment of Northampton | John Harrison | 437 | 0.8 | N/A | |
| Monster Raving Loony | John Percival | 354 | 0.6 | N/A | |
| Independent | Fitzy Fitzpatrick | 346 | 0.6 | N/A | |
| Christian Peoples | Tim Webb | 260 | 0.5 | N/A | |
| Majority | 4,419 | 8.1 | |||
| Turnout | 54,481 | 60.7 | +1.1 | ||
| Conservative gain from Labour | Swing | +5.0 | |||
| General Election 2001: Northampton South | |||||
|---|---|---|---|---|---|
| Party | Candidate | Votes | % | ±% | |
| Labour | Tony Clarke | 21,882 | 42.9 | +0.5 | |
| Conservative | Shailesh Vara | 20,997 | 41.1 | 0.0 | |
| Liberal Democrat | Andrew Simpson | 6,355 | 12.5 | +1.4 | |
| UKIP | Derek Clark | 1,237 | 2.4 | +0.4 | |
| Liberated Party | Tina Harvey | 362 | 0.7 | N/A | |
| ProLife Alliance | Clare Johnson | 196 | 0.4 | N/A | |
| Majority | 885 | 1.8 | |||
| Turnout | 51,029 | 59.6 | -12.1 | ||
| Labour hold | Swing | ||||
Elections in the 1990s
| General Election 1997: Northampton South | |||||
|---|---|---|---|---|---|
| Party | Candidate | Votes | % | ±% | |
| Labour | Tony Clarke | 24,214 | 42.4 | +14.1 | |
| Conservative | Michael Morris | 23,470 | 41.1 | -14.6 | |
| Liberal Democrat | A W Worgan | 6,316 | 11.1 | -3.1 | |
| Referendum Party | C C Petrie | 1,405 | 2.5 | ||
| UKIP | Derek Clark | 1,159 | 2.0 | ||
| Natural Law Party | G D Woollcombe | 541 | 0.9 | ||
| Majority | 744 | 1.3 | +12.2 | ||
| Turnout | 55,946 | 71.7 | -8.2 | ||
| Labour gain from Conservative | Swing | +14.1 | |||
| General Election 1992: Northampton South[10] | |||||
|---|---|---|---|---|---|
| Party | Candidate | Votes | % | ±% | |
| Conservative | Michael Morris | 36,882 | 55.3 | −0.4 | |
| Labour | J Dickie | 19,909 | 29.8 | +5.3 | |
| Liberal Democrat | Graham A G Mabbutt | 9,912 | 14.9 | −3.7 | |
| Majority | 16,973 | 25.4 | −5.7 | ||
| Turnout | 66,703 | 79.9 | +4.7 | ||
| Conservative hold | Swing | −2.8 | |||
Elections in the 1980s
| General Election 1987: Northampton South | |||||
|---|---|---|---|---|---|
| Party | Candidate | Votes | % | ±% | |
| Conservative | Michael Morris | 31,864 | 55.70 | ||
| Labour | J Dickie | 14,061 | 24.58 | ||
| Social Democratic | G Hopkins | 10,639 | 18.60 | ||
| Green | M Hamilton | 647 | 1.13 | ||
| Majority | 17,803 | 31.12 | |||
| Turnout | 75.21 | ||||
| Conservative hold | Swing | ||||
| General Election 1983: Northampton South | |||||
|---|---|---|---|---|---|
| Party | Candidate | Votes | % | ±% | |
| Conservative | Michael Morris | 26,824 | 53.59 | ||
| Social Democratic | Keith Kyle | 11,698 | 23.37 | ||
| Labour | M Coleman | 11,533 | 23.04 | ||
| Majority | 15,126 | 30.22 | |||
| Turnout | 72.64 | ||||
| Conservative hold | Swing | ||||
Elections in the 1970s
| General Election 1979: Northampton South | |||||
|---|---|---|---|---|---|
| Party | Candidate | Votes | % | ±% | |
| Conservative | Michael Morris | 19,125 | 49.67 | ||
| Labour | G Mason | 15,491 | 40.24 | ||
| Liberal | D Amey | 3,478 | 9.03 | ||
| National Front | M James | 407 | 1.06 | ||
| Majority | 3,634 | 9.44 | |||
| Turnout | 75.27 | ||||
| Conservative hold | Swing | ||||
| General Election October 1974: Northampton South | |||||
|---|---|---|---|---|---|
| Party | Candidate | Votes | % | ±% | |
| Conservative | Michael Morris | 14,393 | 42.98 | ||
| Labour | J Dilks | 14,252 | 42.56 | ||
| Liberal | RF Miller | 4,842 | 14.46 | ||
| Majority | 141 | 0.42 | |||
| Turnout | 75.52 | ||||
| Conservative hold | Swing | ||||
| General Election February 1974: Northampton South | |||||
|---|---|---|---|---|---|
| Party | Candidate | Votes | % | ±% | |
| Conservative | Michael Morris | 14,321 | 40.27 | ||
| Labour | J Dilks | 14,142 | 39.77 | ||
| Liberal | RF Miller | 7,099 | 19.96 | ||
| Majority | 179 | 0.50 | |||
| Turnout | 80.82 | ||||
| Conservative hold | Swing | ||||
See also
Notes and references
- Notes
- References
- ↑ "Electorate Figures - Boundary Commission for England". 2011 Electorate Figures. Boundary Commission for England. 4 March 2011. Retrieved 13 March 2011.
- ↑ 2010 post-revision map non-metropolitan areas and unitary authorities of England
- ↑ Unemployment claimants by constituency The Guardian
- ↑ 2011 census interactive maps
- ↑ Leigh Rayment's Historical List of MPs – Constituencies beginning with "N" (part 3)
- ↑ http://ukpollingreport.co.uk/2015guide/northamptonsouth/
- ↑ 7.0 7.1 7.2 http://electionresults.blogspot.co.uk/2013/05/northampton-south-2015.html
- ↑ Northampton South UK Polling prediction of next result based on previous area polling
- ↑ BBC Election Results for Northampton South
- ↑ "Politics Resources". Election 1992. Politics Resources. 9 April 1992. Retrieved 2010-12-06.
| |||||||||||||||||||||||||||||||||||||||||||||||||||||||||