North Somerset Council election, 2011
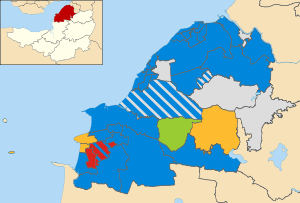
Map of the results of the 2011 North Somerset council election.
Conservatives in blue, independent in grey, Liberal Democrats in yellow,
Labour in red and
Green Party in green.
The 2011 North Somerset Council election took place on 5 May 2011 to elect members of North Somerset Unitary Council in Somerset, England. The whole council was up for election and the Conservative Party stayed in overall control of the council.[1]
Background
At the last election in 2007 the Conservatives gained control of the council with 46 seats.[2] This was compared to 6 independents, 5 Liberal Democrats, 3 Labour and 1 Green Party councillors.[2]
In February 2011 Liberal Democrat councillor for Nailsea East Andy Cole said he would be standing in the election as an independent.[3] Cole was one of a total of 182 candidates who stood in the election for the 61 seats on the council.[4] These were 58 Conservatives, 53 Labour, 42 Liberal Democrats, 20 independents, 5 Green Party, 3 United Kingdom Independence Party and 1 from the All The South Party.[4] The most candidates were in Weston-super-Mare West ward, where 12 people contested the seats.[4]
The Conservative administration of the previous 4 years was attacked over the cost moving the council offices to Castlewood in Clevedon and over the refurbishment of the town hall in Weston-super-Mare.[5] However the Conservatives said they had been able to make savings and therefore not had to make as big cuts as other councils.[6]
Election result
The results saw the Conservatives remain in control of the council after winning 42 of the 61 seats. Independents won 7 seats, the Liberal Democrats 6, Labour 5 and the Green Party 1 seat.[6]
The Liberal Democrats took 2 seats from the Conservatives in Weston-super-Mare Central[6] and 3 seats from them in Weston-super-Mare West,[7] but lost 3 seats back to the Conservatives in Weston-super-Mare South Worle.[6] Meanwhile Labour also gained 2 seats from the Conservatives in Weston-super-Mare East.[7] Long time councillor and independent Nan Kirsen lost her seat in Pill to another independent Don Davies, standing for the Sustainable Pill and District Party, by 17 votes, while Andy Cole won his seat in Nailsea East as an independent after leaving the Liberal Democrats.[6]
| North Somerset Local Election Result 2011[1][8][9] |
| Party |
Seats |
Gains |
Losses |
Net gain/loss |
Seats % |
Votes % |
Votes |
+/− |
| |
Conservative |
42 |
3 |
7 |
-4 |
68.9 |
44.4 |
58,442 |
-3.8% |
| |
Independent |
7 |
1 |
0 |
+1 |
11.5 |
13.7 |
18,017 |
+6.8% |
| |
Liberal Democrat |
6 |
5 |
4 |
+1 |
9.8 |
18.7 |
24,553 |
-10.5% |
| |
Labour |
5 |
2 |
0 |
+2 |
8.2 |
20.3 |
26,645 |
+6.8% |
| |
Green |
1 |
0 |
0 |
0 |
1.6 |
2.0 |
2,620 |
+0.4% |
| |
UKIP |
0 |
0 |
0 |
0 |
0 |
0.8 |
1,109 |
+0.1% |
| |
All The South Party |
0 |
0 |
0 |
0 |
0 |
0.1 |
137 |
+0.1% |
Ward results
| Backwell (2)[8] |
| Party |
Candidate |
Votes |
% |
±% |
|
Independent |
Karen Barclay |
1,603 |
|
|
|
Independent |
Thomas Collinson |
1,602 |
|
|
|
Conservative |
Peter Burden |
778 |
|
|
| Turnout |
3,983 |
51.5 |
+6.4 |
|
Independent hold |
Swing |
|
|
|
Independent hold |
Swing |
|
|
| Clevedon Central[8] |
| Party |
Candidate |
Votes |
% |
±% |
|
Conservative |
Nicholas Pennycott |
445 |
43.2 |
-1.9 |
|
Labour |
Stuart Hale |
403 |
39.2 |
+15.3 |
|
Liberal Democrat |
Bronno Vanderholt |
181 |
17.6 |
-13.4 |
| Majority |
42 |
4.1 |
-10.1 |
| Turnout |
1,029 |
41.8 |
+8.3 |
|
Conservative hold |
Swing |
|
|
| Clevedon East[8] |
| Party |
Candidate |
Votes |
% |
±% |
|
Independent |
David Shopland |
622 |
52.2 |
-8.2 |
|
Conservative |
Jon Middleton |
338 |
28.4 |
+3.3 |
|
Labour |
Nicholas Green |
232 |
19.5 |
+5.0 |
| Majority |
284 |
23.8 |
-11.6 |
| Turnout |
1,192 |
45.8 |
+10.7 |
|
Independent hold |
Swing |
|
|
| Clevedon Walton[8] |
| Party |
Candidate |
Votes |
% |
±% |
|
Conservative |
John Norton-Sealey |
917 |
65.7 |
+1.1 |
|
Liberal Democrat |
Jack Dagnall |
245 |
17.6 |
-17.8 |
|
Labour |
Martin Hime |
233 |
16.7 |
+16.7 |
| Majority |
672 |
48.2 |
+19.0 |
| Turnout |
1,395 |
60.8 |
+9.3 |
|
Conservative hold |
Swing |
|
|
| Clevedon West[8] |
| Party |
Candidate |
Votes |
% |
±% |
|
Conservative |
Christopher Blades |
558 |
46.3 |
-8.4 |
|
Independent |
Trevor Morgan |
342 |
28.4 |
+28.4 |
|
Labour |
Ivy Cameron |
304 |
25.2 |
-20.1 |
| Majority |
216 |
17.9 |
+8.6 |
| Turnout |
1,204 |
49.3 |
+5.7 |
|
Conservative hold |
Swing |
|
|
| Clevedon Yeo[8] |
| Party |
Candidate |
Votes |
% |
±% |
|
Conservative |
Colin Hall |
550 |
55.6 |
-2.5 |
|
Labour |
Alistair Lindsay |
290 |
29.3 |
-12.6 |
|
Liberal Democrat |
Robert Masding |
149 |
15.1 |
+15.1 |
| Majority |
260 |
26.3 |
+10.2 |
| Turnout |
989 |
40.2 |
+9.4 |
|
Conservative hold |
Swing |
|
|
| Congresbury[8] |
| Party |
Candidate |
Votes |
% |
±% |
|
Green |
Thomas Leimdorfer |
825 |
58.1 |
-7.2 |
|
Conservative |
Samantha Pepperall |
418 |
29.4 |
-2.5 |
|
Labour |
Anthony Wontner-Smith |
121 |
8.5 |
+8.5 |
|
Liberal Democrat |
June How |
56 |
3.9 |
+3.9 |
| Majority |
407 |
28.7 |
-4.7 |
| Turnout |
1,420 |
51.7 |
+5.0 |
|
Green hold |
Swing |
|
|
| Easton-in-Gordano[8] |
| Party |
Candidate |
Votes |
% |
±% |
|
Conservative |
Carl Francis-Pester |
729 |
61.4 |
-10.9 |
|
Independent |
Madeline Bickle |
459 |
38.6 |
+38.6 |
| Majority |
270 |
22.7 |
-22.0 |
| Turnout |
1,188 |
54.2 |
+9.4 |
|
Conservative hold |
Swing |
|
|
| Gordano[8] |
| Party |
Candidate |
Votes |
% |
±% |
|
Conservative |
Nigel Ashton |
1,093 |
67.8 |
-8.5 |
|
Labour |
Terry Lester |
276 |
17.1 |
+17.1 |
|
Liberal Democrat |
Daisy Bickley |
243 |
15.1 |
-8.6 |
| Majority |
817 |
50.7 |
-2.0 |
| Turnout |
1,612 |
50.0 |
+3.0 |
|
Conservative hold |
Swing |
|
|
| Kewstoke[8] |
| Party |
Candidate |
Votes |
% |
±% |
|
Conservative |
Ian Porter |
733 |
60.5 |
-2.7 |
|
Labour |
Susan Popperwell |
274 |
22.6 |
+13.7 |
|
Liberal Democrat |
Jeffrey Alen |
204 |
16.8 |
-11.1 |
| Majority |
459 |
37.9 |
+2.6 |
| Turnout |
1,211 |
45.9 |
+8.3 |
|
Conservative hold |
Swing |
|
|
| Pill[8] |
| Party |
Candidate |
Votes |
% |
±% |
|
Independent |
Donald Davies |
603 |
50.7 |
+50.7 |
|
Independent |
Nanette Kirsen |
586 |
49.3 |
-30.6 |
| Majority |
17 |
1.4 |
-58.5 |
| Turnout |
1,189 |
43.4 |
+5.4 |
|
Independent hold |
Swing |
|
|
| Portishead Central[8] |
| Party |
Candidate |
Votes |
% |
±% |
|
Conservative |
Reyna Knight |
675 |
56.6 |
+18.2 |
|
Liberal Democrat |
John Clark |
518 |
43.4 |
+13.6 |
| Majority |
157 |
13.2 |
+4.6 |
| Turnout |
1,193 |
54.7 |
+20.1 |
|
Conservative hold |
Swing |
|
|
| Portishead Coast[8] |
| Party |
Candidate |
Votes |
% |
±% |
|
Conservative |
David Pasley |
854 |
68.6 |
+3.6 |
|
Liberal Democrat |
Evelyn Elworthy |
391 |
31.4 |
+5.9 |
| Majority |
463 |
37.2 |
-2.4 |
| Turnout |
1,245 |
54.7 |
+5.3 |
|
Conservative hold |
Swing |
|
|
| Portishead East[8] |
| Party |
Candidate |
Votes |
% |
±% |
|
Conservative |
Arthur Terry |
904 |
50.4 |
-6.1 |
|
Liberal Democrat |
Jean Lord |
430 |
24.0 |
-5.4 |
|
Labour |
Abigail Fuller-Gardener |
321 |
17.9 |
+3.8 |
|
Independent |
Roger Whitfield |
139 |
7.7 |
+7.7 |
| Majority |
474 |
26.4 |
-0.7 |
| Turnout |
1,794 |
42.6 |
+5.0 |
|
Conservative hold |
Swing |
|
|
| Portishead Redcliffe Bay[8] |
| Party |
Candidate |
Votes |
% |
±% |
|
Conservative |
Felicity Baker |
799 |
60.8 |
+8.8 |
|
Liberal Democrat |
Colin Howells |
515 |
39.2 |
-4.1 |
| Majority |
284 |
21.6 |
+12.8 |
| Turnout |
1,314 |
51.0 |
+1.2 |
|
Conservative hold |
Swing |
|
|
| Portishead South & North Weston[8] |
| Party |
Candidate |
Votes |
% |
±% |
|
Conservative |
Alan McMurray |
604 |
55.4 |
-4.4 |
|
Liberal Democrat |
Nicholas Doddrell |
279 |
25.6 |
-14.6 |
|
Labour |
Paul Dunn |
208 |
19.1 |
+19.1 |
| Majority |
325 |
29.8 |
+10.1 |
| Turnout |
1,091 |
46.0 |
+7.5 |
|
Conservative hold |
Swing |
|
|
| Portishead West[8] |
| Party |
Candidate |
Votes |
% |
±% |
|
Conservative |
David Jolley |
728 |
58.1 |
-5.7 |
|
Liberal Democrat |
Susan Mason |
323 |
25.8 |
-3.5 |
|
Labour |
Kirsty Gardener |
201 |
16.1 |
+9.2 |
| Majority |
405 |
32.3 |
-2.3 |
| Turnout |
1,252 |
49.1 |
+4.0 |
|
Conservative hold |
Swing |
|
|
| Weston-super-Mare West (3)[8] |
| Party |
Candidate |
Votes |
% |
±% |
|
Liberal Democrat |
Mark Canniford |
1,335 |
|
|
|
Liberal Democrat |
John Crockford-Hawley |
1,234 |
|
|
|
Liberal Democrat |
Robert Payne |
1,014 |
|
|
|
Conservative |
Andrew Horler |
1,004 |
|
|
|
Conservative |
Dawn Parry |
912 |
|
|
|
Conservative |
Christopher Kimitri |
886 |
|
|
|
Labour |
Oliver Ballard |
361 |
|
|
|
Labour |
Dorothy Agassiz |
360 |
|
|
|
Labour |
Simon Harrison-Morse |
296 |
|
|
|
UKIP |
Harold James |
293 |
|
|
|
Green |
Brian Outten |
253 |
|
|
|
All The South Party |
Robert Craig |
137 |
|
|
| Turnout |
8,085 |
43.1 |
+0.8 |
|
Liberal Democrat gain from Conservative |
Swing |
|
|
|
Liberal Democrat gain from Conservative |
Swing |
|
|
|
Liberal Democrat gain from Conservative |
Swing |
|
|
| Winford[8] |
| Party |
Candidate |
Votes |
% |
±% |
|
Independent |
Hugh Gregor |
774 |
69.3 |
+15.2 |
|
Conservative |
Michael Dolley |
343 |
30.7 |
-15.2 |
| Majority |
431 |
38.6 |
+30.4 |
| Turnout |
1,117 |
45.3 |
+3.9 |
|
Independent hold |
Swing |
|
|
| Wrington[8] |
| Party |
Candidate |
Votes |
% |
±% |
|
Liberal Democrat |
Deborah Yamanaka |
673 |
52.3 |
+7.3 |
|
Conservative |
Peter Ellis |
613 |
47.7 |
+14.9 |
| Majority |
60 |
4.7 |
-7.5 |
| Turnout |
1,286 |
57.4 |
+3.1 |
|
Liberal Democrat hold |
Swing |
|
|
References
|
|---|
| | Metropolitan boroughs |
- Barnsley
- Birmingham
- Bolton
- Bradford
- Bury
- Calderdale
- Coventry
- Doncaster
- Dudley
- Gateshead
- Kirklees
- Knowsley
- Leeds
- Liverpool
- Manchester
- Newcastle upon Tyne
- North Tyneside
- Oldham
- Rochdale
- Rotherham
- Salford
- Sandwell
- Sefton
- Sheffield
- Solihull
- South Tyneside
- St Helens
- Stockport
- Sunderland
- Tameside
- Trafford
- Wakefield
- Walsall
- Wigan
- Wirral
- Wolverhampton
|
|---|
| | Unitary authorities | |
|---|
| | District councils (England) | |
|---|
| | District councils (Northern Ireland) |
- Antrim
- Ards
- Armagh
- Ballymena
- Ballymoney
- Banbridge
- Belfast
- Carrickfergus
- Castlereagh
- Coleraine
- Cookstown
- Craigavon
- Derry
- Down
- Dungannon and South Tyrone
- Fermanagh
- Larne
- Limavady
- Lisburn
- Magherafelt
- Moyle
- Newry and Mourne
- Newtownabbey
- North Down
- Omagh
- Strabane
|
|---|
| | Mayoral elections | |
|---|
| | National Assembly elections | |
|---|
| | Referendums | |
|---|
|