North Indian Ocean tropical cyclone
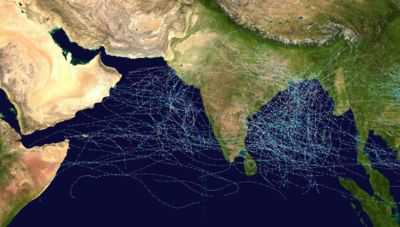
Cumulative track map of all North Indian ocean cyclones from 1970 to 2005
The following is a list of North Indian Ocean cyclone seasons.
Years
| Period | Seasons |
|---|---|
| 1900s | Pre-1980, 1970, 1980-1984, 1985-1988, 1989 |
| 1990s | 1990, 1991, 1992, 1993, 1994, 1995, 1996, 1997, 1998, 1999 |
| 2000s | 2000, 2001, 2002, 2003, 2004, 2005, 2006, 2007, 2008, 2009 |
| 2010s | 2010, 2011, 2012, 2013, 2014, 2015 |
Tropical Cyclone seasons
1890s
| Year | D | CS | SCS[A 1] | Notes | |||||
|---|---|---|---|---|---|---|---|---|---|
| 1890 | 10 | 4 | 1 | ||||||
| 1891 | 13 | 4 | 3 | Total includes 1 Land Severe Cyclonic Storm | |||||
| 1892 | 12 | 7 | 2 | ||||||
| 1893 | 12 | 10 | 4 | ||||||
| 1894 | 12 | 6 | 0 | ||||||
| 1895 | 11 | 5 | 4 | ||||||
| 1896 | 10 | 8 | 3 | ||||||
| 1897 | 12 | 6 | 8 | ||||||
| 1898 | 13 | 7 | 3 | ||||||
| 1899 | 7 | 3 | 0 | ||||||
| References[1] | |||||||||
1900s
| Year | D | CS | SCS[A 1] | Strongest storm | Deaths | Damages (USD) | Notes | ||
|---|---|---|---|---|---|---|---|---|---|
| 1900 | 10 | 3 | 1 | ||||||
| 1901 | 6 | 3 | 2 | ||||||
| 1902 | 13 | 7 | 5 | ||||||
| 1903 | 14 | 8 | 2 | ||||||
| 1904 | 9 | 4 | 0 | ||||||
| 1905 | 10 | 6 | 0 | ||||||
| 1906 | 11 | 7 | 1 | ||||||
| 1907 | 15 | 8 | 4 | ||||||
| 1908 | 9 | 6 | 1 | ||||||
| 1909 | 8 | 8 | 4 | ||||||
| References[1] | |||||||||
1910s
| Year | D | CS | SCS[A 1] | Strongest storm | Deaths | Damages (USD) | Notes | ||
|---|---|---|---|---|---|---|---|---|---|
| 1910 | 6 | 5 | 2 | ||||||
| 1911 | 7 | 5 | 4 | ||||||
| 1912 | 9 | 6 | 2 | ||||||
| 1913 | 10 | 6 | 2 | ||||||
| 1914 | 8 | 4 | 2 | ||||||
| 1915 | 9 | 6 | 0 | ||||||
| 1916 | 14 | 8 | 5 | ||||||
| 1917 | 10 | 3 | 1 | ||||||
| 1918 | 11 | 5 | 0 | ||||||
| 1919 | 11 | 6 | 3 | ||||||
| References[1] | |||||||||
1920s
| Year | D | CS | SCS[A 1] | Strongest storm | Deaths | Damages (USD) | Notes | ||
|---|---|---|---|---|---|---|---|---|---|
| 1920 | 9 | 5 | 0 | ||||||
| 1921 | 10 | 4 | 1 | ||||||
| 1922 | 13 | 6 | 6 | ||||||
| 1923 | 16 | 4 | 3 | ||||||
| 1924 | 13 | 6 | 0 | ||||||
| 1925 | 20 | 7 | 3 | ||||||
| 1926 | 13 | 10 | 3 | ||||||
| 1927 | 18 | 7 | 2 | ||||||
| 1928 | 13 | 7 | 0 | ||||||
| 1929 | 15 | 6 | 0 | ||||||
| References[1] | |||||||||
1930s
| Year | D | CS | SCS[A 1] | Strongest storm | Deaths | Damages (USD) | Notes | ||
|---|---|---|---|---|---|---|---|---|---|
| 1930 | 14 | 10 | 1 | ||||||
| 1931 | 11 | 5 | 1 | ||||||
| 1932 | 14 | 6 | 2 | ||||||
| 1933 | 16 | 8 | 3 | ||||||
| 1934 | 16 | 5 | 0 | ||||||
| 1935 | 15 | 6 | 2 | ||||||
| 1936 | 17 | 6 | 3 | ||||||
| 1937 | 19 | 6 | 2 | ||||||
| 1938 | 10 | 4 | 4 | ||||||
| 1939 | 19 | 7 | 3 | ||||||
| References[1] | |||||||||
1940s
| Year | D | CS | SCS[A 1] | Strongest storm | Deaths | Damages (USD) | Notes | ||
|---|---|---|---|---|---|---|---|---|---|
| 1940 | 16 | 8 | 5 | ||||||
| 1941 | 19 | 8 | 4 | ||||||
| 1942 | 14 | 5 | 2 | ||||||
| 1943 | 14 | 7 | 1 | ||||||
| 1944 | 19 | 8 | 2 | ||||||
| 1945 | 15 | 3 | 2 | ||||||
| 1946 | 17 | 5 | 1 | ||||||
| 1947 | 18 | 4 | 2 | ||||||
| 1948 | 18 | 6 | 3 | ||||||
| 1949 | 12 | 1 | 1 | ||||||
| References[1] | |||||||||
1950s
| Year | D | CS | SCS[A 1] | Strongest storm | Deaths | Damages (USD) | Notes | ||
|---|---|---|---|---|---|---|---|---|---|
| 1950 | 16 | 4 | 0 | ||||||
| 1951 | 15 | 4 | 2 | ||||||
| 1952 | 17 | 4 | 2 | ||||||
| 1953 | 10 | 1 | 1 | ||||||
| 1954 | 14 | 1 | 0 | ||||||
| 1955 | 13 | 6 | 2 | ||||||
| 1956 | 14 | 4 | 2 | ||||||
| 1957 | 7 | 4 | 2 | ||||||
| 1958 | 12 | 5 | 2 | ||||||
| 1959 | 16 | 6 | 3 | ||||||
| References[1] | |||||||||
1960s
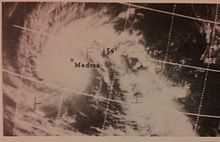
This ESSA 3 satellite image was taken on November 3, 1966 at 0819 UTC of a tropical cyclone striking Madras, India
| Year | D | CS | SCS[A 1] | Strongest storm | Deaths | Damages (USD) | Notes | ||
|---|---|---|---|---|---|---|---|---|---|
| 1960 | 15 | 5 | 3 | Ten | 20,299 | >$9.4 million | Vast majority of the fatalities resulted from two cyclones striking East Pakistan three weeks apart | ||
| 1961 | 18 | 5 | 4 | Three | 11,525 | Unknown | Three land depressions developed this season | ||
| 1962 | 13 | 5 | 3 | Twelve | 769 | $34.5 million | Deadliest storm, Harriet, crossed over from the Western Pacific | ||
| 1963 | 17 | 6 | 4 | Three | 11,735 | Unknown | Strongest storm was equivalent to a super cyclonic storm; had the lowest measured pressure in the basin at the time at 919.9 mbar (hPa; 27.17 inHg) | ||
| 1964 | 16 | 7 | 5 | Sixteen | >1,827 | >$150 million | Strongest storm was equivalent to a super cyclonic storm | ||
| 1965 | 14 | 6 | 4 | ||||||
| 1966 | 18 | 8 | 6 | ||||||
| 1967 | 15 | 6 | 4 | ||||||
| 1968 | 13 | 7 | 4 | ||||||
| 1969 | 14 | 6 | 1 | ||||||
| References[1] | |||||||||
1970s
| Year | D | CS | SCS[A 1] | Strongest storm | Deaths | Damages (USD) | Notes | ||
|---|---|---|---|---|---|---|---|---|---|
| 1970 | 15 | 7 | 3 | Bhola Cyclone | 300,000-500,000 | 86.4 million | The Bhola Cyclone is the deadliest tropical cyclone recorded worldwide | ||
| 1971 | 15 | 7 | 6 | ||||||
| 1972 | 18 | 7 | 6 | ||||||
| 1973 | 16 | 6 | 3 | ||||||
| 1974 | 12 | 7 | 3 | ||||||
| 1975 | 20 | 7 | 4 | ||||||
| 1976 | 14 | 10 | 7 | ||||||
| 1977 | 18 | 5 | 5 | ||||||
| 1978 | 14 | 5 | 3 | ||||||
| 1979 | 11 | 5 | 4 | ||||||
| References[1] | |||||||||
1980s
| Year | D | CS | SCS[A 1] | Strongest storm | Deaths | Damages (USD) | Notes | ||
|---|---|---|---|---|---|---|---|---|---|
| 1980 | 14 | 3 | 0 | ||||||
| 1981 | 12 | 6 | 3 | ||||||
| 1982 | 20 | 5 | 5 | ||||||
| 1983 | 8 | 3 | 2 | ||||||
| 1984 | 7 | 3 | 3 | ||||||
| 1985 | 15 | 7 | 2 | ||||||
| 1986 | 8 | 1 | 0 | ||||||
| 1987 | 9 | 5 | 3 | ||||||
| 1988 | 9 | 3 | 2 | ||||||
| 1989 | 10 | 3 | 5 | Gay | 1,785 | 25.27 Million | Gay crossed over from the West Pacific Basin | ||
| References[1] | |||||||||
1990s
| Year | D | DD | CS | SCS | VSCS | SuCS[A 1] | Strongest storm | Deaths | Damages (USD) | Notes and References |
|---|---|---|---|---|---|---|---|---|---|---|
| 1990 | 11 | 6 | 2 | 2 | 1 | 1 | BOB 01 | 967 | $900 million | [2][3] |
| 1991 | 8 | 4 | 3 | 1 | 1 | 1 | BOB 01 | >138 000 | 1.5 billion | [3] |
| 1992 | 12 | 11 | 7 | 2 | 1 | 0 | Forrest | 189 | 124.1 million | Forest crossed over from the West Pacific Basin |
| 1993 | 4 | 3 | 2 | 2 | 2 | 0 | ARB 01/02 | 600 | ||
| 1994 | 8 | 4 | 4 | 4 | 2 | 0 | ARB 01 | 285 | 125 million | |
| 1995 | 8 | 6 | 3 | 2 | 2 | 0 | 04B | 71 | ||
| 1996 | 9 | 7 | 5 | 4 | 2 | 0 | ARB 01 | 1243 | ||
| 1997 | 9 | 7 | 3 | 2 | 1 | 0 | BOB 01 | 117 | ||
| 1998 | 13 | 10 | 6 | 5 | 4 | 0 | ARB 02 | >10 212 | 3 billion | |
| 1999 | 9 | 6 | 4 | 3 | 3 | 1 | BOB 06 | 15 870 | 5 billion | The Orissa cyclone is the strongest cyclone recorded in the Northern Indian Ocean. |
| References[1] | ||||||||||
2000s
| Year | D | DD | CS | SCS | VSCS | SuCS[A 1] | Strongest storm | Deaths | Damages (USD) | Notes |
|---|---|---|---|---|---|---|---|---|---|---|
| 2000 | 7 | 6 | 5 | 2 | 2 | 0 | BOB 05 | 152 | Unknown | |
| 2001 | 6 | 5 | 5 | 1 | 1 | 0 | ARB 01 | 108 | Unknown | |
| 2002 | 6 | 6 | 4 | 1 | 0 | 0 | BOB 01 | Unknown | Unknown | |
| 2003 | 7 | 5 | 3 | 3 | 0 | 0 | 02A | Unknown | Unknown | |
| 2004 | 10 | 7 | 4 | 4 | 1 | 0 | BOB 01 | 234 | Unknown | |
| 2005 | 12 | 9 | 4 | 0 | 0 | 0 | Fanoos | 1227 | Unknown | |
| 2006 | 12 | 6 | 3 | 2 | 1 | 0 | Mala | 192 | Unknown | |
| 2007 | 12 | 8 | 4 | 2 | 2 | 1 | Gonu | 4545 | $6.4 billion | |
| 2008 | 10 | 7 | 4 | 1 | 1 | 0 | Nargis | >138 000 | $12 billion | |
| 2009 | 8 | 6 | 4 | 1 | 0 | 0 | Aila | 345 | $618 million | |
| References[1] | ||||||||||
2010s
| Year | D | DD | CS | SCS | VSCS | SuCS[A 1] | Strongest storm | Deaths | Damages (USD) | Notes |
|---|---|---|---|---|---|---|---|---|---|---|
| 2010 | 8 | 6 | 5 | 4 | 2 | 0 | Giri | 402 | $2.99 billion | 2010 was the most active season in the North Indian Ocean since 1998[4] with 8 depressions and 5 named storms forming in the region due to a moderate La Niña.[5] |
| 2011 | 10 | 6 | 2 | 1 | 1 | 0 | Thane | 360 | 277 million | 2011 was the least active season in the North Indian Ocean since 1993[4] due to an El Niño [6] |
| 2012 | 5 | 5 | 2 | 0 | 0 | 0 | Nilam | 128 | 56.7 million | First depression did not develop until October 10 |
| 2013 | 10 | 6 | 5 | 4 | 3 | 0 | Phailin | 320+ | 1.5 billion | |
| 2014 | 8 | 5 | 3 | 2 | 2 | 0 | Nilofar | 147 | 11 billion | |
| References[1] | ||||||||||
See also
- Tropical cyclone
- Atlantic hurricane season
- Pacific hurricane season
- Pacific typhoon season
- South-West Indian Ocean tropical cyclone season
- Australian region tropical cyclone season
- South Pacific tropical cyclone season
Notes
- ↑ 1.0 1.1 1.2 1.3 1.4 1.5 1.6 1.7 1.8 1.9 1.10 1.11 1.12 Each column refers to how many Storms developed during the season with D=Depressions, DD=Deep Depressions, CS=Cyclonic Storms, SCS=Severe Cyclonic Storm, VSCS=Very Severe Cyclonic Storm, SUCS=Super Cyclonic Storm. For further details please refer to Tropical cyclone scales
References
- ↑ 1.0 1.1 1.2 1.3 1.4 1.5 1.6 1.7 1.8 1.9 1.10 1.11 1.12 Unattributed (2010-08-31). "Annual frequency of cyclonic disturbances (Maximum sustained windspeeds of 17 knots or more), Cyclones (34 knots or more) and Severe Cyclones (48 knots or more) over the Bay of Bengal (BOB), Arabian Sea (AS) and land surface of India" (PDF). India Meteorological Department. Retrieved 2011-08-20.
- ↑ Regional Specialised Meteorological Centre (RSMC) - Tropical Cyclones, New Delhi (January 1992). Report on Cyclonic Disturbances (Depressions and Tropical Cyclones) over North Indian Ocean in 1990 (PDF) (Report). India Meteorological Department. Archived from the original on January 15, 2015. Retrieved February 22, 2015.
- ↑ 3.0 3.1 Unattributed (2008-06-26). "Historical records of Severe Cyclones which formed in the Bay of Bengal and made landfall at the eastern coast of India during the period from 1970-1999". India Meteorological Department. Retrieved 2011-08-20.
- ↑ 4.0 4.1 "Yearly and Seasonal Frequency of Cyclones and Depressions". India Meteorological Department. Retrieved 5 September 2012.(Note: Creation of an account in the website is required in order to access data.)
- ↑ "IMD Cyclone Warning Services: Tropical Cyclones". Retrieved 7 October 2010.
- ↑ Colin Packham. "Australia says signs El Nino weather pattern forming". Reuters. Retrieved 8 September 2012.