Newcastle upon Tyne North (UK Parliament constituency)
| Newcastle upon Tyne North | |
|---|---|
|
Borough constituency for the House of Commons | |
|
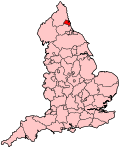
Boundary of Newcastle upon Tyne North in Tyne and Wear. | |
|
Location of Tyne and Wear within England. | |
| County | Tyne and Wear |
| Electorate | 67,401 (December 2010)[1] |
| Current constituency | |
| Created | 1918 |
| Member of parliament | Catherine McKinnell (Labour) |
| Number of members | One |
| Overlaps | |
| European Parliament constituency | North East England |

Newcastle upon Tyne North is a constituency[n 1] represented in the House of Commons of the UK Parliament since 2010 by Catherine McKinnell of the Labour Party.[n 2]
Boundaries
Following the review by the Boundary Commission for England, taking effect at the 2010 general election, the Newcastle upon Tyne North constituency is formed from the electoral wards of:
- Castle, Denton, East Gosforth, Fawdon, Lemington, Newburn, Parklands, Westerhope and Woolsington in the City of Newcastle.[2]
The Boundary Commission had originally proposed that the West Gosforth ward should be included so that all of Gosforth should be in the same constituency,[3] but an overturning took place post-consultation[4] (contained in the revised propoals) duly accepted by Parliament.
History
From its creation in 1918, the seat was safely Conservative — including six years of complex representation in terms of the modern parties by Gwilym Lloyd George, who was Home Secretary for almost three years until 1957 in a Conservative government. This continued until the 1983 general election, when boundary changes resulted in the Newcastle North of 1983 being composed entirely of wards that did not form part of the pre-1983 Newcastle North (the majority of the old Newcastle North moving to Newcastle Central, which the Conservatives won in 1983). Under these new boundaries the seat was notionally a safe Labour seat. Despite Labour's heavy landslide defeat in 1983, Labour held the new Newcastle North and have done ever since, with the Liberal Democrats since 2005 the greatest challengers.
Members of Parliament
| Election | Member[5] | Party | |
|---|---|---|---|
| 1918 | Nicholas Grattan-Doyle | Conservative | |
| 1940 by-election | Sir Cuthbert Headlam | Independent Conservative | |
| 1940 | Conservative | ||
| 1951 | Gwilym Lloyd George | National Liberal | |
| 1957 by-election | Sir William Elliott | Conservative | |
| 1983 | Robert Brown | Labour | |
| 1987 | Doug Henderson | Labour | |
| 2010 | Catherine McKinnell | Labour | |
Elections
Elections in the 2010s
| General Election 2015: Newcastle upon Tyne North | |||||
|---|---|---|---|---|---|
| Party | Candidate | Votes | % | ±% | |
| Conservative | Stephen Bates[6] | ||||
| Liberal Democrat | Anita Lower[7] | ||||
| UKIP | Tim Marron[8] | ||||
| Labour | Catherine McKinnell[9] | ||||
| North East Party | Violet Rook[10] | ||||
| Green | Alison Whalley[11] | ||||
| General Election 2010: Newcastle upon Tyne North[12][13] | |||||
|---|---|---|---|---|---|
| Party | Candidate | Votes | % | ±% | |
| Labour | Catherine McKinnell | 17,950 | 40.8 | −9.0 | |
| Liberal Democrat | Ronald W.A.L. Beadle | 14,536 | 33.1 | +0.1 | |
| Conservative | Stephen Parkinson | 7,966 | 18.1 | +3.4 | |
| BNP | Terry Gibson | 1,890 | 4.3 | +4.3 | |
| UKIP | Ian Proud | 1,285 | 2.9 | +2.9 | |
| Green | Anna Heyman | 319 | 0.7 | +0.7 | |
| Majority | 3,414 | 7.8 | |||
| Turnout | 43,946 | 65.5 | +3.8 | ||
| Labour hold | Swing | −4.5 | |||
Elections in the 2000s
| General Election 2005: Newcastle upon Tyne North | |||||
|---|---|---|---|---|---|
| Party | Candidate | Votes | % | ±% | |
| Labour | Doug Henderson | 19,224 | 50.0 | −10.1 | |
| Liberal Democrat | Ronald W.A.L. Beadle | 12,201 | 31.7 | +12.3 | |
| Conservative | Neil Hudson | 6,022 | 15.7 | −4.7 | |
| National Front | Roland Wood | 997 | 2.6 | +2.6 | |
| Majority | 7,023 | 18.3 | |||
| Turnout | 38,444 | 67.6 | +10.1 | ||
| Labour hold | Swing | −11.2 | |||
| General Election 2001: Newcastle upon Tyne North | |||||
|---|---|---|---|---|---|
| Party | Candidate | Votes | % | ±% | |
| Labour | Doug Henderson | 21,874 | 60.1 | −2.0 | |
| Conservative | Philip R. Smith | 7,424 | 20.4 | +1.0 | |
| Liberal Democrat | Graham A. Soult | 7,070 | 19.4 | +4.9 | |
| Majority | 14,450 | 39.7 | |||
| Turnout | 36,368 | 57.5 | −11.6 | ||
| Labour hold | Swing | ||||
Elections in the 1990s
| General Election 1997: Newcastle upon Tyne North | |||||
|---|---|---|---|---|---|
| Party | Candidate | Votes | % | ±% | |
| Labour | Doug Henderson | 28,125 | 62.2 | +12.8 | |
| Conservative | Gregory B. White | 8,793 | 19.4 | −12.4 | |
| Liberal Democrat | Peter J. Allen | 6,578 | 14.5 | −4.2 | |
| Referendum Party | Mrs. Doreen Chipchase | 1,733 | 3.8 | ||
| Majority | 19,332 | 42.7 | |||
| Turnout | 45,229 | 69.2 | |||
| Labour hold | Swing | ||||
| General Election 1992: Newcastle upon Tyne North[14] | |||||
|---|---|---|---|---|---|
| Party | Candidate | Votes | % | ±% | |
| Labour | Doug Henderson | 25,121 | 49.4 | +6.7 | |
| Conservative | Ian Gordon | 16,175 | 31.8 | -0.9 | |
| Liberal Democrat | Peter J. Maughan | 9,542 | 18.8 | −13.9 | |
| Majority | 8,946 | 17.6 | +7.6 | ||
| Turnout | 50,838 | 76.8 | +0.5 | ||
| Labour hold | Swing | −0.3 | |||
Elections in the 1980s
| General Election 1987: Newcastle upon Tyne North | |||||
|---|---|---|---|---|---|
| Party | Candidate | Votes | % | ±% | |
| Labour | Doug Henderson | 22,424 | 42.7 | +5.1 | |
| Liberal | John Shipley | 17,181 | 32.7 | +2.8 | |
| Conservative | John Tweddle | 12,915 | 24.6 | −7.9 | |
| Majority | 5,243 | 10.0 | |||
| Turnout | 52,520 | 75.9 | |||
| Labour hold | Swing | ||||
| General Election 1983: Newcastle upon Tyne North | |||||
|---|---|---|---|---|---|
| Party | Candidate | Votes | % | ±% | |
| Labour | Robert Brown | 18,985 | 37.6 | −10.8 | |
| Conservative | Philip Straw | 16,429 | 32.5 | −5.1 | |
| Liberal | John Shipley | 15,136 | 29.9 | +16.2 | |
| Majority | 2,556 | 5.1 | |||
| Turnout | 50,550 | 72.8 | |||
| Labour hold | Swing | ||||
Elections in the 1970s
| General Election 1979: Newcastle upon Tyne North | |||||
|---|---|---|---|---|---|
| Party | Candidate | Votes | % | ±% | |
| Conservative | Sir William Elliott | 12,721 | 47.6 | ||
| Labour | S. Ward | 11,010 | 41.2 | ||
| Liberal | C. Marlowe | 2,983 | 11.2 | ||
| Majority | 1,711 | 6.4 | |||
| Turnout | 26,714 | 68.0 | |||
| Conservative hold | Swing | ||||
| General Election October 1974: Newcastle upon Tyne North | |||||
|---|---|---|---|---|---|
| Party | Candidate | Votes | % | ±% | |
| Conservative | Sir William Elliott | 11,217 | 42.9 | ||
| Labour | Tony Banks | 10,748 | 41.1 | ||
| Liberal | David Herd | 4,189 | 16.0 | ||
| Majority | 469 | 1.8 | |||
| Turnout | 26,154 | 65.0 | |||
| Conservative hold | Swing | ||||
| General Election February 1974: Newcastle upon Tyne North | |||||
|---|---|---|---|---|---|
| Party | Candidate | Votes | % | ±% | |
| Conservative | Sir William Elliott | 12,793 | 43.6 | ||
| Labour | R.G. Eccles | 9,813 | 33.4 | ||
| Liberal | Chris Foote Wood | 6,772 | 23.1 | ||
| Majority | 2,980 | 10.1 | |||
| Turnout | 29,378 | 73.4 | |||
| Conservative hold | Swing | ||||
| General Election 1970: Newcastle upon Tyne North | |||||
|---|---|---|---|---|---|
| Party | Candidate | Votes | % | ±% | |
| Conservative | Sir William Elliott | 15,978 | 56.1 | ||
| Labour | R.G. Eccles | 12,518 | 43.9 | ||
| Majority | 3,460 | 12.1 | |||
| Turnout | 28,496 | 67.7 | |||
| Conservative hold | Swing | ||||
Elections in the 1960s
| General Election 1966: Newcastle upon Tyne North | |||||
|---|---|---|---|---|---|
| Party | Candidate | Votes | % | ±% | |
| Conservative | Sir William Elliott | 15,243 | 49.7 | ||
| Labour | F.R. Griffin | 12,550 | 40.9 | ||
| Liberal | A. Share | 2,902 | 9.5 | ||
| Majority | 2,693 | 8.8 | |||
| Turnout | 30,695 | 75.1 | |||
| Conservative hold | Swing | ||||
| General Election 1964: Newcastle upon Tyne North | |||||
|---|---|---|---|---|---|
| Party | Candidate | Votes | % | ±% | |
| Conservative | Sir William Elliott | 19,502 | 60.9 | ||
| Labour | S. Lee | 12,515 | 39.1 | ||
| Majority | 6,987 | 21.8 | |||
| Turnout | 32,017 | 75.6 | |||
| Conservative hold | Swing | ||||
Elections in the 1950s
| General Election 1959: Newcastle upon Tyne North | |||||
|---|---|---|---|---|---|
| Party | Candidate | Votes | % | ±% | |
| Conservative | Sir William Elliott | 24,588 | 64.9 | ||
| Labour | M.F.L. Pritchard | 13,316 | 35.1 | ||
| Majority | 11,272 | 29.7 | |||
| Turnout | 37,904 | 79.1 | |||
| Conservative hold | Swing | ||||
| By-election 1957: Newcastle-upon-Tyne North | |||||
|---|---|---|---|---|---|
| Party | Candidate | Votes | % | ±% | |
| Conservative | Sir William Elliott | 19,107 | 60.35 | +3.5 | |
| Labour | T. McDonald | 12,555 | 39.65 | +3.5 | |
| Majority | 6,462 | ||||
| Turnout | |||||
| Conservative gain from National Liberal | Swing | ||||
| General Election 1955: Newcastle-upon-Tyne North | |||||
|---|---|---|---|---|---|
| Party | Candidate | Votes | % | ±% | |
| National Liberal | Gwilym Lloyd George | 25,236 | 63.8 | ||
| Labour | B Chisholm | 14,303 | 36.2 | ||
| Majority | 10,933 | 27.7 | - | ||
| Turnout | 39,539 | ||||
| National Liberal hold | Swing | ||||
| General Election 1951: Newcastle-upon-Tyne North | |||||
|---|---|---|---|---|---|
| Party | Candidate | Votes | % | ±% | |
| National Liberal | Gwilym Lloyd George | 23,930 | 51.1 | ||
| Labour | I.E. Geffen | 17,005 | 36.3 | ||
| Independent Conservative | C. Gray | 5,904 | 12.1 | ||
| Majority | 6,925 | 14.8 | |||
| Turnout | 46,839 | ||||
| National Liberal gain from Conservative | Swing | ||||
| General Election 1950: Newcastle-upon-Tyne North | |||||
|---|---|---|---|---|---|
| Party | Candidate | Votes | % | ±% | |
| Conservative | Sir Cuthbert Headlam, Bt | 25,325 | 53.9 | ||
| Labour | W.H. Shackleton | 16,860 | 35.9 | ||
| Liberal | Aubrey Herbert | 4,839 | 10.3 | ||
| Majority | 8,465 | 18.0 | |||
| Turnout | 47,024 | 83.7 | |||
| Conservative hold | Swing | ||||
Elections in the 1940s
| General Election 1945: Newcastle-upon-Tyne North | |||||
|---|---|---|---|---|---|
| Party | Candidate | Votes | % | ±% | |
| Conservative | Sir Cuthbert Headlam | 17,381 | 50.6 | ||
| Labour | W Henry Shackleton | 10,228 | 29.8 | ||
| Liberal | William McKeag | 5,812 | 16.9 | ||
| Common Wealth | Henry Arthur Charles Ridsdale | 904 | 2.6 | ||
| Majority | 7,153 | 20.8 | |||
| Turnout | 34,325 | 73.2 | |||
| Conservative hold | Swing | ||||
| Newcastle upon Tyne North by-election, 7th June 1940 | |||||
|---|---|---|---|---|---|
| Party | Candidate | Votes | % | ±% | |
| Independent Conservative | Sir Cuthbert Headlam, Bt | 7,380 | 71.2 | N/A | |
| Conservative | Howard Grattan-Doyle | 2,982 | 28.8 | −48.2 | |
| Majority | 4,398 | 42.4 | |||
| Turnout | 10,362 | 22.0 | −48.3 | ||
| Independent Conservative gain from Conservative | Swing | ||||
Elections in the 1930s
| General Election 1935: Newcastle-upon-Tyne North | |||||
|---|---|---|---|---|---|
| Party | Candidate | Votes | % | ±% | |
| Conservative | Nicholas Grattan-Doyle | 25,683 | 77.0 | ||
| Labour | E. Gilbert | 7,693 | 23.1 | ||
| Majority | 17,990 | 53.9 | |||
| Turnout | 33,376 | 70.3 | |||
| Conservative hold | Swing | ||||
| General Election 1931: Newcastle-upon-Tyne North | |||||
|---|---|---|---|---|---|
| Party | Candidate | Votes | % | ±% | |
| Conservative | Nicholas Grattan-Doyle | 30,245 | 83.93 | ||
| Labour | R.J. Thomson | 5,791 | 16.07 | ||
| Majority | 24,454 | 67.86 | |||
| Turnout | 76.83 | ||||
| Conservative hold | Swing | ||||
See also
- Newcastle upon Tyne North by-election, 1940
- Newcastle upon Tyne North by-election, 1957
- List of Parliamentary constituencies in Tyne and Wear
Notes and references
- Notes
- References
- ↑ "Electorate Figures - Boundary Commission for England". 2011 Electorate Figures. Boundary Commission for England. 4 March 2011. Retrieved 13 March 2011.
- ↑ The Parliamentary Constituencies (England) Order 2007
- ↑ Boundary Commission Proposal
- ↑ 2010 post-revision map Greater London and metropolitan areas of England
- ↑ Leigh Rayment's Historical List of MPs – Constituencies beginning with "N" (part 1)
- ↑ "Stephen Bates PPC page". Conservative Party (UK). Retrieved 31 January 2015.
- ↑ "Anita Lower PPC page". Liberal Democrats. Retrieved 23 February 2015.
- ↑ http://ukpollingreport.co.uk/2015guide/newcastleupontynenorth/
- ↑ http://electionresults.blogspot.co.uk/2013/05/newcastle-upon-tyne-north-2015.html
- ↑ "Violet Rook PPC page" (PDF). The North East Party. Retrieved 13 February 2015.
- ↑ "green-party-mps-for-newcastle". Retrieved 13 February 2015.
- ↑ http://www.newcastle.gov.uk/wwwfileroot/cxo/electoral/SPNNorth2010.pdf
- ↑ "BBC NEWS – Election 2010 – Newcastle Upon Tyne East". BBC News.
- ↑ "Politics Resources". Election 1992. Politics Resources. 9 April 1992. Retrieved 2010-12-06.
Sources
- Craig, F. W. S. (1983) [1969]. British parliamentary election results 1918-1949 (3rd edition ed.). Chichester: Parliamentary Research Services. ISBN 0-900178-06-X.
| ||||||||||||||||||