Newcastle upon Tyne East (UK Parliament constituency)
| Newcastle upon Tyne East | |
|---|---|
|
Borough constituency for the House of Commons | |
|
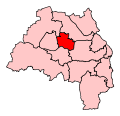
Boundary of Newcastle upon Tyne East in Tyne and Wear for the 2010 general election. | |
|
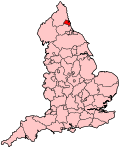
Location of Tyne and Wear within England. | |
| County | Tyne and Wear |
| Electorate | 65,203 (December 2010)[1] |
| Current constituency | |
| Created | 2010 |
| Member of parliament | Nick Brown (Labour) |
| Number of members | One |
| Created from | Newcastle upon Tyne East and Wallsend; Tyne Bridge |
| 1918–1997 | |
| Replaced by | Newcastle upon Tyne East and Wallsend |
| Created from | Newcastle-upon-Tyne |
| Overlaps | |
| European Parliament constituency | North East England |
Newcastle upon Tyne East is a constituency[n 1] represented in the House of Commons of the UK Parliament since its 2010 recreation by Nick Brown of the Labour Party.[n 2]
History
Parliament created this constituency in the Representation of the People Act 1918 however its first creation was eventually absorbed in 1997 by the new Newcastle upon Tyne East and Wallsend seat. Parliament accepted the Boundary Commission's Fifth Periodic Review of Westminster constituencies which recommended the recreation of the seat for the 2010 general election. Parliament accepted the Boundary Commission's Fifth Periodic Review of Westminster constituencies which slightly altered this constituency for the 2010 general election since which it has electoral wards:
Apart from a quite widespread party defection in 1981 to the SDP, successive members of the Labour Party have represented this constituency in Westminster since 1964 (including its interim successors). Since 1970, the double-digit majorities won suggest in all three previous forms of the constituency and today's constituency have been safe seats.
- Latest political results in the local context
For the Labour Party was likely to be more marginal since 2006 when a Liberal Democrat local popularity strengthened, winning council seats across the constituency with large majorities. This indicated a possibility of Labour losing the seat to the Liberal Democrats at the 2010 general election. In the event, Labour's Nick Brown held the seat with the smallest majority in 44 years, and in the simultaneous local elections Labour benefitted from the associated increased turnout to take the Walkergate Council Ward from the Liberal Democrats.
Boundaries
Following their review of parliamentary representation in Tyne and Wear in 2005, the Boundary Commission for England re-created the constituency of Newcastle upon Tyne East, which took effect at the 2010 general election. The new seat largely replaced the former Newcastle upon Tyne East and Wallsend seat, with the Wallsend element being transferred to the adjacent North Tyneside constituency.
The electoral wards used in the new constituency are all within the boundaries of the city of Newcastle:
- Byker (The Byker Wall Estate, St. Peter's and part of Walker)
- Dene (Part of Gosforth, Benton and Cochrane Park)
- North Heaton (High Heaton around Coast Road)
- North Jesmond
- Ouseburn (All of Shieldfield, Ouseburn, part of Quayside and part of Byker)
- South Heaton (most of Heaton around Chillingham Road)
- South Jesmond (Jesmond, Jesmond Vale and part of the City Centre)
- Walker (Walker Riverside and St. Anthony's Estate)
- Walkergate (Walkergate, Walkerville and part of Walker)
Members of Parliament
MPs 1918–1997
| Election | Member[2] | Party | Notes | |
|---|---|---|---|---|
| 1918 | Harry Barnes | Coalition Liberal | ||
| 1922 | Joseph Nicholas Bell | Labour | ||
| 1923 by-election | Arthur Henderson | Labour | ||
| 1923 | Sir Robert Aske | Liberal | ||
| 1924 | Martin Henry Connolly | Labour | ||
| 1929 | Sir Robert Aske | Liberal | ||
| 1931 | National Liberal | |||
| 1945 | Arthur Blenkinsop | Labour | ||
| 1959 | Fergus Montgomery | Conservative | ||
| 1964 | Geoffrey Rhodes | Labour Co-operative | ||
| Oct 1974 | Mike Thomas | Labour | ||
| 1981 | SDP | |||
| 1983 | Nick Brown | Labour | Former Councillor for the Walker Ward until his election in 1983 | |
| 1997 | None | None | Constituency abolished: see Newcastle upon Tyne East & Wallsend | |
MPs since 2010
| Election | Member[2] | Party | Notes | |
|---|---|---|---|---|
| 2010 | Nick Brown | Labour | Former Councillor for the Walker Ward until his election in 1983. | |
Elections
Elections in the 2010s
| General Election 2015: Newcastle upon Tyne East | |||||
|---|---|---|---|---|---|
| Party | Candidate | Votes | % | ±% | |
| Labour | Nick Brown | ||||
| Conservative | Duncan Crute[3] | ||||
| Green | Andrew Gray[4] | ||||
| TUSC | Paul Phillips [5] | ||||
| Communist | Mollie Stevenson[6] | ||||
| Liberal Democrat | Wendy Taylor | ||||
| UKIP | David Robinson-Young[7] | ||||
| General Election 2010: Newcastle upon Tyne East[8][9] | |||||
|---|---|---|---|---|---|
| Party | Candidate | Votes | % | ±% | |
| Labour | Nick Brown* | 17,043 | 45.0 | -7.7 | |
| Liberal Democrat | Wendy Taylor | 12,590 | 33.3 | +1.5 | |
| Conservative | Dominic Robin Crofts Llewellyn | 6,068 | 16.0 | +3.0 | |
| BNP | Alan Spence | 1,342 | 3.5 | +3.5 | |
| Green | Andrew Gray | 620 | 1.6 | +1.6 | |
| Communist | Martin Levy | 177 | 0.5 | -0.1 | |
| Majority | 4,453 | 11.8 | |||
| Turnout | 37,840 | 58.7 | +3.4 | ||
| Labour hold | Swing | -4.6 | |||
- * Served as MP for Newcastle upon Tyne East and Wallsend, 1997–2010
Elections in the 1990s
| General Election 1992: Newcastle upon Tyne East[10] | |||||
|---|---|---|---|---|---|
| Party | Candidate | Votes | % | ±% | |
| Labour | Nick Brown | 24,342 | 60.2 | +3.8 | |
| Conservative | Jeremy R. Lucas | 10,465 | 25.9 | −0.8 | |
| Liberal Democrat | Alan Thompson | 4,883 | 12.1 | −4.0 | |
| Green | Gareth L.N. Edwards | 744 | 1.8 | +1.8 | |
| Majority | 13,877 | 34.3 | +4.5 | ||
| Turnout | 40,434 | 70.7 | +1.6 | ||
| Labour hold | Swing | +2.3 | |||
Elections in the 1980s
| General Election 1987: Newcastle upon Tyne East | |||||
|---|---|---|---|---|---|
| Party | Candidate | Votes | % | ±% | |
| Labour | Nick Brown | 23,677 | 56.5 | +11.0 | |
| Conservative | Miss J.G.A. Riley | 11,177 | 26.6 | −1.2 | |
| Liberal | Peter J. Arnold | 6,728 | 16.0 | −10.7 | |
| Communist | Joseph Keith | 362 | 0.9 | N/A | |
| Majority | 12,500 | 29.8 | |||
| Turnout | 41,944 | 70.6 | |||
| Labour hold | Swing | +6.1 | |||
| General Election 1983: Newcastle upon Tyne East | |||||
|---|---|---|---|---|---|
| Party | Candidate | Votes | % | ±% | |
| Labour | Nick Brown | 19,247 | 45.5 | ||
| Conservative | Arthur T. Barnes | 11,755 | 27.8 | ||
| Social Democratic | Mike Thomas | 11,293 | 26.7 | ||
| Majority | 7,492 | 17.7 | |||
| Turnout | 42,295 | 71.0 | |||
| Labour hold | Swing | ||||
Elections in the 1970s
| General Election 1979: Newcastle upon Tyne East | |||||
|---|---|---|---|---|---|
| Party | Candidate | Votes | % | ±% | |
| Labour | Mike Thomas | 18,257 | 55.05 | ||
| Conservative | Derek Conway | 12,087 | 36.45 | ||
| Liberal | J. Nelson | 2,818 | 8.50 | ||
| Majority | 6,170 | 18.61 | |||
| Turnout | 67.96 | ||||
| Labour hold | Swing | ||||
| General Election October 1974: Newcastle upon Tyne East | |||||
|---|---|---|---|---|---|
| Party | Candidate | Votes | % | ±% | |
| Labour | Mike Thomas | 17,312 | 52.84 | ||
| Conservative | M. Hill | 11,063 | 33.76 | ||
| Liberal | T. Symonds | 4,391 | 13.40 | ||
| Majority | 6,249 | 19.07 | |||
| Turnout | 71.77 | ||||
| Labour hold | Swing | ||||
| General Election February 1974: Newcastle upon Tyne East | |||||
|---|---|---|---|---|---|
| Party | Candidate | Votes | % | ±% | |
| Labour Co-op | Geoffrey Rhodes | 20,439 | 58.76 | ||
| Conservative | M. Hill | 14,347 | 41.24 | ||
| Majority | 6,092 | 17.51 | |||
| Turnout | 76.87 | ||||
| Labour Co-op hold | Swing | ||||
| General Election 1970: Newcastle upon Tyne East | |||||
|---|---|---|---|---|---|
| Party | Candidate | Votes | % | ±% | |
| Labour Co-op | Geoffrey Rhodes | 20,780 | 58.35 | ||
| Conservative | Philip E. Heseltine | 14,832 | 41.65 | ||
| Majority | 5,948 | 16.70 | |||
| Turnout | 75.59 | ||||
| Labour Co-op hold | Swing | ||||
Elections in the 1960s
| General Election 1966: Newcastle upon Tyne East | |||||
|---|---|---|---|---|---|
| Party | Candidate | Votes | % | ±% | |
| Labour Co-op | Geoffrey Rhodes | 22,408 | 59.77 | ||
| Conservative | Thomas T. Hubble | 15,082 | 40.23 | ||
| Majority | 7,326 | 19.54 | |||
| Turnout | 80.51 | ||||
| Labour Co-op hold | Swing | ||||
| General Election 1964: Newcastle upon Tyne East | |||||
|---|---|---|---|---|---|
| Party | Candidate | Votes | % | ±% | |
| Labour Co-op | Geoffrey Rhodes | 21,200 | 52.02 | ||
| Conservative | Fergus Montgomery | 19,556 | 47.98 | ||
| Majority | 1,644 | 4.03 | |||
| Turnout | 83.37 | ||||
| Labour Co-op gain from Conservative | Swing | ||||
Elections in the 1950s
| General Election 1959: Newcastle upon Tyne East | |||||
|---|---|---|---|---|---|
| Party | Candidate | Votes | % | ±% | |
| Conservative | Fergus Montgomery | 21,457 | 50.11 | ||
| Labour | Arthur Blenkinsop | 21,359 | 49.89 | ||
| Majority | 98 | 0.22 | |||
| Turnout | 84.59 | ||||
| Conservative gain from Labour | Swing | ||||
| General Election 1955: Newcastle upon Tyne East | |||||
|---|---|---|---|---|---|
| Party | Candidate | Votes | % | ±% | |
| Labour | Arthur Blenkinsop | 22,816 | 52.08 | ||
| Conservative | George F.H. Walker | 20,994 | 47.92 | ||
| Majority | 1,822 | 4.16 | |||
| Turnout | 77.60 | ||||
| Labour hold | Swing | ||||
| General Election 1951: Newcastle upon Tyne East | |||||
|---|---|---|---|---|---|
| Party | Candidate | Votes | % | ±% | |
| Labour | Arthur Blenkinsop | 25,621 | 52.86 | ||
| Conservative | Alfred Edwards | 22,850 | 47.14 | ||
| Majority | 2,771 | 5.72 | |||
| Turnout | 84.59 | ||||
| Labour hold | Swing | ||||
| General Election 1950: Newcastle upon Tyne East | |||||
|---|---|---|---|---|---|
| Party | Candidate | Votes | % | ±% | |
| Labour | Arthur Blenkinsop | 24,694 | 51.45 | ||
| Conservative | P.G. Williams | 18,866 | 39.30 | ||
| Liberal | William McKeag | 4,440 | 9.25 | ||
| Majority | 5,828 | 5.72 | |||
| Turnout | 83.67 | ||||
| Labour hold | Swing | ||||
Elections in the 1940s
| General Election 1945: Newcastle upon Tyne East | |||||
|---|---|---|---|---|---|
| Party | Candidate | Votes | % | ±% | |
| Labour | Arthur Blenkinsop | 26,116 | 68.93 | ||
| Liberal National | R. O'Sullivan | 11,774 | 31.07 | ||
| Majority | 14,342 | 37.85 | |||
| Turnout | 73.13 | ||||
| Labour gain from Liberal National | Swing | ||||
Elections in the 1930s
| General Election 1935: Newcastle upon Tyne East | |||||
|---|---|---|---|---|---|
| Party | Candidate | Votes | % | ±% | |
| Liberal National | Sir Robert Aske | 23,146 | 58.60 | ||
| Labour | Bernard Benjamin Gillis | 16,322 | 41.4 | ||
| Majority | 6,824 | 17.2 | |||
| Turnout | 81.3 | ||||
| Liberal National hold | Swing | ||||
| General Election 1931: Newcastle upon Tyne East | |||||
|---|---|---|---|---|---|
| Party | Candidate | Votes | % | ±% | |
| Liberal National | Sir Robert Aske | 24,552 | 63.4 | ||
| Labour | Maurice Alexander | 14,176 | 36.6 | ||
| Majority | 10,346 | 26.8 | |||
| Turnout | 86.5 | ||||
| Liberal National gain from Liberal | Swing | ||||
Elections in the 1920s
| General Election 1929: Newcastle upon Tyne East | |||||
|---|---|---|---|---|---|
| Party | Candidate | Votes | % | ±% | |
| Liberal | Sir Robert Aske | 17,856 | 51.3 | ||
| Labour | Martin Henry Connolly | 16,921 | 48.7 | ||
| Majority | 935 | 2.6 | |||
| Turnout | 79.4 | ||||
| Liberal gain from Labour | Swing | ||||
| General Election 1924: Newcastle upon Tyne East | |||||
|---|---|---|---|---|---|
| Party | Candidate | Votes | % | ±% | |
| Labour | Martin Henry Connolly | 13,120 | 46.4 | ||
| Liberal | Sir Robert Aske | 12,776 | 45.1 | ||
| Conservative | William Temple | 2,420 | 8.5 | ||
| Majority | 344 | 1.3 | |||
| Turnout | 83.9 | ||||
| Labour gain from Liberal | Swing | ||||
| General Election 1923: Newcastle upon Tyne East | |||||
|---|---|---|---|---|---|
| Party | Candidate | Votes | % | ±% | |
| Liberal | Sir Robert Aske | 12,656 | 52.3 | ||
| Labour | Arthur Henderson | 11,532 | 47.7 | ||
| Majority | 1,124 | ||||
| Turnout | 73.2 | ||||
| Liberal gain from Labour | Swing | ||||
| Newcastle-upon-Tyne East by-election, 1923 | |||||
|---|---|---|---|---|---|
| Party | Candidate | Votes | % | ±% | |
| Labour | Arthur Henderson | 11,066 | 45.7 | ||
| Liberal | Harry Barnes | 6,682 | 27.6 | ||
| Conservative | Robert Gee | 6,480 | 26.7 | ||
| Majority | 4,384 | 18.1 | |||
| Turnout | 76.4 | ||||
| Labour hold | Swing | ||||
- Death of Joseph Nicholas Bell

| General Election 1922: Newcastle upon Tyne East | |||||
|---|---|---|---|---|---|
| Party | Candidate | Votes | % | ±% | |
| Labour | Joseph Nicholas Bell | 10,084 | 43.1 | ||
| Liberal | Harry Barnes | 6,999 | 30.0 | ||
| National Liberal | Gilbert Stone | 6,273 | 26.9 | ||
| Majority | 3,085 | 13.1 | |||
| Turnout | 73.7 | ||||
| Labour gain from Liberal | Swing | ||||
Elections in the 1910s
| General Election 1918: Newcastle upon Tyne East | |||||
|---|---|---|---|---|---|
| Party | Candidate | Votes | % | ±% | |
| Liberal | Harry Barnes | 8,682 | 58.1 | ||
| Labour | Walter Hudson | 5,195 | 34.7 | ||
| Independent | John Thompson | 1,079 | 7.2 | ||
| Majority | 3,487 | 23.4 | |||
| Turnout | 48.7 | ||||
See also
Notes and references
- Notes
- References
- ↑ "Electorate Figures - Boundary Commission for England". 2011 Electorate Figures. Boundary Commission for England. 4 March 2011. Retrieved 13 March 2011.
- ↑ 2.0 2.1 Leigh Rayment's Historical List of MPs – Constituencies beginning with "N" (part 1)
- ↑ "Duncan Crute PPC page". Conservative Party (UK). Retrieved 31 January 2015.
- ↑ http://www.thenorthernecho.co.uk/news/11728362.Greens_name_election_candidates/
- ↑ http://www.tusc.org.uk/txt/320.pdf
- ↑ "Member of Parliament for Newcastle upon Tyne East". YourNextMP. Retrieved 31 January 2015.
- ↑ http://ukpollingreport.co.uk/2015guide/newcastleupontyneeast/
- ↑ http://www.newcastle.gov.uk/wwwfileroot/cxo/electoral/SPNEast2010.pdf
- ↑ "BBC NEWS – Election 2010 – Newcastle Upon Tyne East". BBC News.
- ↑ "Politics Resources". Election 1992. Politics Resources. 9 April 1992. Retrieved 6 Dec 2010.
Sources
- Craig, F. W. S. (1983) [1969]. British parliamentary election results 1918-1949 (3rd edition ed.). Chichester: Parliamentary Research Services. ISBN 0-900178-06-X.
| ||||||||||||||||||