Newcastle upon Tyne Central (UK Parliament constituency)
Coordinates: 55°00′11″N 1°36′36″W / 55.003°N 1.610°W
| Newcastle upon Tyne Central | |
|---|---|
|
Borough constituency for the House of Commons | |
|
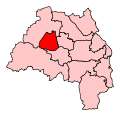
Boundary of Newcastle upon Tyne Central in Tyne and Wear. | |
|
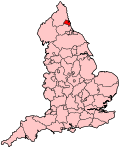
Location of Tyne and Wear within England. | |
| County | Tyne and Wear |
| Electorate | 60,795 (December 2010)[1] |
| Current constituency | |
| Created | 1918 |
| Member of parliament | Chinyelu Onwurah (Labour) |
| Number of members | One |
| Created from | Newcastle-upon-Tyne |
| Overlaps | |
| European Parliament constituency | North East England |
Newcastle upon Tyne Central is a constituency[n 1] represented in the House of Commons of the UK Parliament since 2012 by Chi Onwurah from Labour, a former head of OFCOM.[n 2]
History
Parliament created this seat under the Representation of the People Act 1918 for the general election later that year. From its creation the constituency has been represented by members of the Labour and Conservative parties only. Since the 1987 general election, the seat has been served by an MP in the Labour Party and since 2001 the largest-polling opposition candidate in the three elections has been a Liberal Democrat.
Boundaries
The constituency covers the central part of Newcastle upon Tyne, being one of three constituencies in the city. Between 1983 and 2010, the seat did not actually contain the city's commercial centre. Parliament accepted the Boundary Commission's Fifth Periodic Review of Westminster constituencies, thus altered this constituency for General Election 2010 since which it has electoral wards:
The constituency is formed from eight electoral wards:
- Benwell and Scotswood, Blakelaw, Elswick, Fenham, Kenton, Westgate, West Gosforth and Wingrove.[2]
This intentionally improved the naming of this constituency which had previously been west of the centre as it received the city centre from the abolished Tyne Bridge which also covered parts of Gateshead and divided it between this Central seat and Newcastle upon Tyne East.
Constituency profile
The constituency is mostly the urban city itself, which has seen end its once export-leading shipbuilding industry, its adult population has mostly a middle or low income, however with modern advanced engineering, learning, design, graphics, production company headquarters and tourism the city forms is a bellwether for the North East region's economy firmly in the British forefront of a determined return to increasing national output.[3] In November 2012 total unemployment (based on the more up-to-date claimant statistics) placed the City of Newcastle in joint 17th place of 29 constituencies in the region, above, for example the City of Durham at the bottom of the list, with just 3.4% claimants whereas Newcastle had 6.0% claimants, identical to Sunderland.[4]
Members of Parliament
| Election | Member[5] | Party | |
|---|---|---|---|
| 1918 | George Renwick | Conservative | |
| 1922 | Charles Trevelyan | Labour | |
| 1931 | Arthur Denville | Conservative | |
| 1945 | Lyall Wilkes | Labour | |
| 1951 | Ted Short | Labour | |
| 1976 by-election | Harry Cowans | Labour | |
| 1983 | Piers Merchant | Conservative | |
| 1987 | Jim Cousins | Labour | |
| 2010 | Chi Onwurah | Labour | |
Elections
Elections in the 2010s
| General Election 2015: Newcastle upon Tyne Central | |||||
|---|---|---|---|---|---|
| Party | Candidate | Votes | % | ±% | |
| Liberal Democrat | Nicholas Cott | ||||
| Green | Alex Johnson[6] | ||||
| Conservative | Simon Kitchen[7] | ||||
| Labour | Chi Onwurah[8] | ||||
| UKIP | Daniel Thompson[9] | ||||
David Robinson-Young was previously standing for UKIP in Newcastle Central,[10] but has now moved to Newcastle East.
| General Election 2010: Newcastle upon Tyne Central[11][12] | |||||
|---|---|---|---|---|---|
| Party | Candidate | Votes | % | ±% | |
| Labour | Chi Onwurah | 15,692 | 45.9 | -4.6 | |
| Liberal Democrat | Gareth Kane | 8,228 | 24.1 | -3.4 | |
| Conservative | Nick Holder | 6,611 | 19.4 | +2.8 | |
| BNP | Ken Booth | 2,302 | 6.7 | +6.7 | |
| UKIP | Martin Davies | 754 | 2.2 | +2.2 | |
| Green | John Pearson | 568 | 1.7 | -2.2 | |
| Majority | 7,464 | 21.9 | |||
| Turnout | 34,155 | 56.4 | -0.1 | ||
| Labour hold | Swing | -0.6 | |||
- * Gareth Kane, Lib Dem candidate, was Councillor for Ouseburn Ward at the time of the General Election 2010
Elections in the 2000s
| General Election 2005: Newcastle upon Tyne Central | |||||
|---|---|---|---|---|---|
| Party | Candidate | Votes | % | ±% | |
| Labour | Jim Cousins | 16,211 | 45.1 | -9.9 | |
| Liberal Democrat | Greg Stone | 12,229 | 34.0 | +12.3 | |
| Conservative | Wendy Morton | 5,749 | 16.0 | -5.3 | |
| Green | Joe Hulm | 1,254 | 3.5 | +3.5 | |
| Newcastle Academy with Christian Values Party | Clive Harding | 477 | 1.3 | +1.3 | |
| Majority | 3,982 | 11.1 | |||
| Turnout | 35,920 | 52.5 | +1.2 | ||
| Labour hold | Swing | -11.1 | |||
- * Greg Stone, Lib Dem candidate, was Councillor for North Heaton Ward at the time of the General Election 2005
| General Election 2001: Newcastle upon Tyne Central | |||||
|---|---|---|---|---|---|
| Party | Candidate | Votes | % | ±% | |
| Labour | Jim Cousins | 19,169 | 55.0 | -4.2 | |
| Liberal Democrat | Stephen Psallidas | 7,564 | 21.7 | +6.7 | |
| Conservative | Aidan Ruff | 7,414 | 21.3 | -2.2 | |
| Socialist Labour | Gordon Potts | 723 | 2.1 | N/A | |
| Majority | 11,605 | 33.3 | |||
| Turnout | 34,870 | 51.3 | -14.6 | ||
| Labour hold | Swing | ||||
Elections in the 1990s
| General Election 1997: Newcastle upon Tyne Central | |||||
|---|---|---|---|---|---|
| Party | Candidate | Votes | % | ±% | |
| Labour | Jim Cousins | 27,272 | 59.2 | +7.5 | |
| Conservative | Brooks Newmark | 10,792 | 23.4 | -12.2 | |
| Liberal Democrat | Ruth Berry | 6,911 | 15.0 | +2.3 | |
| Referendum Party | Charles A. Coxon | 1,113 | 2.4 | N/A | |
| Majority | 16,480 | 35.8 | |||
| Turnout | 46,088 | 65.9 | |||
| Labour hold | Swing | ||||
| General Election 1992: Newcastle upon Tyne Central[13] | |||||
|---|---|---|---|---|---|
| Party | Candidate | Votes | % | ±% | |
| Labour | Jim Cousins | 21,123 | 49.4 | +5.2 | |
| Conservative | Mike Summersby | 15,835 | 37.0 | -1.8 | |
| Liberal Democrat | Lembit Opik | 5,816 | 13.6 | -2.2 | |
| Majority | 5,288 | 12.4 | +7.0 | ||
| Turnout | 42,774 | 71.3 | −4.2 | ||
| Labour hold | Swing | +3.5 | |||
Elections in the 1980s
| General Election 1987: Newcastle upon Tyne Central | |||||
|---|---|---|---|---|---|
| Party | Candidate | Votes | % | ±% | |
| Labour | Jim Cousins | 20,416 | 44.2 | ||
| Conservative | Piers Merchant | 17,933 | 38.8 | ||
| Social Democratic | Nigel Martin | 7,304 | 15.8 | ||
| Green | Richard John Bird | 418 | 0.91 | ||
| Red Front | Kirk Williams | 111 | 0.24 | ||
| Majority | 2,483 | 5.38 | |||
| Turnout | 75.52 | ||||
| Labour gain from Conservative | Swing | ||||
| General Election 1983: Newcastle upon Tyne Central | |||||
|---|---|---|---|---|---|
| Party | Candidate | Votes | % | ±% | |
| Conservative | Piers Merchant | 18,161 | 40.82 | ||
| Labour | Nigel Todd | 15,933 | 35.81 | ||
| Social Democratic | John Horam | 9,923 | 22.30 | ||
| Ecology | Douglas Neil Jacques | 478 | 1.07 | ||
| Majority | 2,228 | 5.01 | |||
| Turnout | 70.98 | ||||
| Conservative gain from Labour | Swing | ||||
Elections in the 1970s
| General Election 1979: Newcastle upon Tyne Central | |||||
|---|---|---|---|---|---|
| Party | Candidate | Votes | % | ±% | |
| Labour | Harry Cowans | 10,395 | 67.28 | ||
| Conservative | D Conway | 2,982 | 19.30 | ||
| Liberal | J Nelson | 2,073 | 13.42 | ||
| Majority | 7,413 | 47.98 | |||
| Turnout | 65.25 | ||||
| Labour hold | Swing | ||||
| Newcastle-upon-Tyne Central by-election, 1976 | |||||
|---|---|---|---|---|---|
| Party | Candidate | Votes | % | ±% | |
| Labour | Harry Cowans | 4,692 | 47.61 | -24.16 | |
| Liberal | Andrew Stephen Ellis | 2,854 | 28.96 | +17.28 | |
| Conservative | Richard Sowler | 1,945 | 19.73 | +3.18 | |
| Socialist Workers | David Hayes | 184 | 1.87 | N/A | |
| National Front | Bruce Anderson-Lynes | 181 | 1.84 | N/A | |
| Majority | 1,838 | ||||
| Turnout | 9,856 | ||||
| Labour hold | Swing | ||||
| General Election October 1974: Newcastle upon Tyne Central | |||||
|---|---|---|---|---|---|
| Party | Candidate | Votes | % | ±% | |
| Labour | Rt Hon. Edward Watson Short | 10,546 | 71.8 | ||
| Conservative | Irene Sheila Faith | 2,432 | 16.6 | ||
| Liberal | Andrew Stephen Ellis | 1,716 | 11.7 | ||
| Majority | 8,108 | 55.2 | |||
| Turnout | 14,694 | 58.4 | |||
| Labour hold | Swing | ||||
| General Election February 1974: Newcastle upon Tyne Central | |||||
|---|---|---|---|---|---|
| Party | Candidate | Votes | % | ±% | |
| Labour | Rt Hon. Edward Watson Short | 12,182 | 74.45 | ||
| Conservative | Michael Jack | 4,180 | 25.55 | ||
| Majority | 8,002 | 48.91 | |||
| Turnout | 65.43 | ||||
| Labour hold | Swing | 0.1% | |||
| General Election 1970: Newcastle upon Tyne Central | |||||
|---|---|---|---|---|---|
| Party | Candidate | Votes | % | ±% | |
| Labour | Rt Hon. Edward Watson Short | 13,671 | 70.61 | ||
| Conservative | Michael St John Way | 4,256 | 21.98 | ||
| Liberal | David Lesser | 1,433 | 7.40 | ||
| Majority | 9,415 | 48.63 | |||
| Turnout | 61.64 | ||||
| Labour hold | Swing | ||||
Elections in the 1960s
| General Election 1966: Newcastle upon Tyne Central | |||||
|---|---|---|---|---|---|
| Party | Candidate | Votes | % | ±% | |
| Labour | Edward Watson Short | 19,291 | 76.65 | ||
| Conservative | J. J. Walker-Smith | 5,474 | 21.75 | ||
| Communist | T. G. Welch | 404 | 1.61 | ||
| Majority | 13,817 | 54.90 | |||
| Turnout | 65.87 | ||||
| Labour hold | Swing | ||||
| General Election 1964: Newcastle upon Tyne Central | |||||
|---|---|---|---|---|---|
| Party | Candidate | Votes | % | ±% | |
| Labour | Edward Watson Short | 20,547 | 70.91 | ||
| Conservative | W. D. Rutter | 7,896 | 27.25 | ||
| Communist | T. G. Welch | 532 | 1.84 | ||
| Majority | 12,651 | 43.66 | |||
| Turnout | 69.13 | ||||
| Labour hold | Swing | ||||
Elections in the 1950s
| General Election 1959: Newcastle upon Tyne Central | |||||
|---|---|---|---|---|---|
| Party | Candidate | Votes | % | ±% | |
| Labour | Edward Watson Short | 24,051 | 65.83 | ||
| Conservative | W. D. Rutter | 12,485 | 34.17 | ||
| Majority | 11,566 | 31.66 | |||
| Turnout | 73.18 | ||||
| Labour hold | Swing | ||||
| General Election 1955: Newcastle upon Tyne Central | |||||
|---|---|---|---|---|---|
| Party | Candidate | Votes | % | ±% | |
| Labour | Edward Watson Short | 26,102 | 66.59 | ||
| Conservative | G. Peters | 13,099 | 33,41 | ||
| Majority | 13,003 | 33.17 | |||
| Turnout | 70.88 | ||||
| Labour hold | Swing | ||||
| General Election 1951: Newcastle upon Tyne Central | |||||
|---|---|---|---|---|---|
| Party | Candidate | Votes | % | ±% | |
| Labour | Edward Watson Short | 25,637 | 64.14 | ||
| Conservative | F. T. Webster | 13,325 | 33.34 | ||
| Ind. Labour Party | Fred Barton | 1,006 | 2.52 | ||
| Majority | 12,312 | 30.80 | |||
| Turnout | 80.74 | ||||
| Labour hold | Swing | ||||
| General Election 1950: Newcastle upon Tyne Central | |||||
|---|---|---|---|---|---|
| Party | Candidate | Votes | % | ±% | |
| Labour | Lyall Wilkes | 25,190 | 63.66 | ||
| Conservative | G. C. White | 13,567 | 34.29 | ||
| Ind. Labour Party | Fred Barton | 812 | 2.05 | ||
| Majority | 11,623 | 29.37 | |||
| Turnout | 79.80 | ||||
| Labour hold | Swing | ||||
Elections in the 1940s
| General Election 1945: Newcastle upon Tyne Central | |||||
|---|---|---|---|---|---|
| Party | Candidate | Votes | % | ±% | |
| Labour | Lyall Wilkes | 10,627 | 61.92 | ||
| Conservative | Arthur Denville | 6,536 | 38.08 | ||
| Majority | 4,091 | 23.84 | |||
| Turnout | 71.75 | ||||
| Labour gain from Conservative | Swing | ||||
Elections in the 1930s
| General Election 1935: Newcastle upon Tyne Central | |||||
|---|---|---|---|---|---|
| Party | Candidate | Votes | % | ±% | |
| Conservative | Arthur Denville | 15,826 | 59.28 | ||
| Labour | W. Monslow | 10,871 | 40.72 | ||
| Majority | 4,955 | 18.56 | |||
| Turnout | 75.47 | ||||
| Conservative hold | Swing | ||||
| General Election 1931: Newcastle upon Tyne Central | |||||
|---|---|---|---|---|---|
| Party | Candidate | Votes | % | ±% | |
| Conservative | Arthur Denville | 20,309 | 62.41 | ||
| Labour | Charles Trevelyan | 12,136 | 37.30 | ||
| National Labour | W.H.D. Caple | 94 | 0.29 | ||
| Majority | 8,173 | 25.12 | |||
| Turnout | 32,539 | 80.47 | |||
| Conservative gain from Labour | Swing | ||||
See also
Notes and references
- Notes
- References
- ↑ "Electorate Figures - Boundary Commission for England". 2011 Electorate Figures. Boundary Commission for England. 4 March 2011. Retrieved 13 March 2011.
- ↑ 2010 post-revision map Greater London and metropolitan areas of England
- ↑ Constituency Profile The Guardian
- ↑ Unemployment statistics The Guardian
- ↑ Leigh Rayment's Historical List of MPs – Constituencies beginning with "N" (part 1)
- ↑ Tallentire, Mark (15 January 2015). "Greens name election candidates". The Northern Echo. Retrieved 31 January 2015.
- ↑ Wearmouth, Rachel (17 January 2015). "Young Geordie Tory from Heaton to battle Labour for Newcastle Central seat". Chronicle Live. Retrieved 31 January 2015.
- ↑ http://electionresults.blogspot.co.uk/2013/05/newcastle-upon-tyne-central-2015.html
- ↑ http://ukip-gatesheadnewcastle.org.uk/candidates.htm
- ↑ http://web.archive.org/web/20150213030710/http://ukip-gatesheadnewcastle.org.uk/candidates.htm
- ↑ http://www.newcastle.gov.uk/wwwfileroot/cxo/electoral/SPNCentral2010.pdf
- ↑ "BBC NEWS – Election 2010 – Washington & Sunderland West". BBC News.
- ↑ "Politics Resources". Election 1992. Politics Resources. 9 April 1992. Retrieved 2010-12-06.
| ||||||||||||||||||