New South Wales state election, 2019
New South Wales state election, 2019
|
|
|
|
|
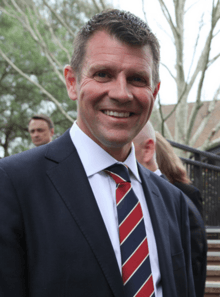
Incumbent Premier
Mike Baird
Liberal/National coalition |
|
|
The next New South Wales state election is scheduled to be held in 2019 to elect the 58th Parliament of New South Wales. The incumbent centre-right Liberal/National Coalition, currently led by Premier Mike Baird, will attempt to win a third term and will be challenged by the centre-left Australian Labor Party opposition, currently led by Luke Foley.
New South Wales has compulsory voting, with an optional preferential ballot in single-member seats for the lower house and single transferable vote with optional preferential above-the-line voting in the proportionally represented upper house. The election will conducted by the New South Wales Electoral Commission (NSWEC).
Date
The parliament has constitutionally fixed four year terms.
Previous election
Lower house
At the 2015 election, the Liberal/National coalition retained government with a reduced majority of 54 seats from 69 seats in the 2011 election. However, during that time the Coalition were reduced to a further 61 seats due to ICAC proceedings that expelled 8 MPs from the Liberal Party. The Labor party gained 11 seats with a total of 34 seats. The Greens gained a record three seats. Independents Greg Piper and Alex Greenwich both respectively retained their seats.
Polling
|
Legislative Assembly polling
| Date |
Firm |
Primary vote |
TPP vote |
| LIB |
NAT |
ALP |
GRN |
OTH |
L/NP |
ALP |
| 15 April 2015 |
Roy Morgan[1] |
47.5%* |
31.0% |
12.5% |
9.0% |
54.5% |
45.5% |
| 28 March 2015 election |
35.1% |
10.5% |
34.1% |
10.3% |
9.9% |
54.3% |
45.7% |
| 23–26 March 2015 |
Newspoll[2] |
35% |
9% |
34% |
11% |
11% |
55% |
45%[3] |
| * Indicates a combined Liberal/National primary vote. |
| Newspoll polling is published in The Australian and sourced from here |
Better Premier and satisfaction polling*
| Date |
Firm |
Better Premier |
|
Baird |
Foley |
| Baird |
Foley |
|
Satisfied |
Dissatisfied |
Satisfied |
Dissatisfied |
| 15 Apr 2015 |
Roy Morgan |
68% |
32% |
|
not asked |
|
| 28 March 2015 election |
– |
– |
– |
– |
– |
– |
– |
| 23–26 Mar 2015 |
Newspoll |
54% |
27% |
|
57% |
29% |
38% |
37% |
| * Remainder were "uncommitted" or "other/neither". |
| Newspoll polling is published in The Australian and sourced from here |
See also
References
.jpg)