Multidimensional Poverty Index
The Multidimensional Poverty Index (MPI) was developed in 2010 by Oxford Poverty & Human Development Initiative and the United Nations Development Programme[1] and uses different factors to determine poverty beyond income-based lists. It replaced the previous Human Poverty Index. The global MPI is released annually by OPHI and the results published on its website.
The global Multidimensional Poverty Index (MPI) is an international measure of acute poverty covering over 100 developing countries. It complements traditional income-based poverty measures by capturing the severe deprivations that each person faces at the same time with respect to education, health and living standards. The MPI assesses poverty at the individual level. If someone is deprived in a third or more of ten (weighted) indicators, the global index identifies them as ‘MPI poor’, and the extent – or intensity – of their poverty is measured by the number of deprivations they are experiencing. The MPI can be used to create a comprehensive picture of people living in poverty, and permits comparisons both across countries, regions and the world and within countries by ethnic group, urban/rural location, as well as other key household and community characteristics.
This makes it invaluable as an analytical tool to identify the most vulnerable people - the poorest among the poor, revealing poverty patterns within countries and over time, enabling policy makers to target resources and design policies more effectively.
Indicators
The index uses the same three dimensions as the Human Development Index: health, education, and standard of living. These are measured using ten indicators.
| Dimension | Indicators |
|---|---|
| Health |
|
| Education |
|
| Living Standards |
|
Each dimension and each indicator within a dimension is equally weighted.
Calculation of the index
Formula
The MPI is calculated as follows:[2]
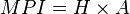
H: Percentage of people who are MPI poor (incidence of poverty)
A: Average intensity of MPI poverty across the poor (%)
Indicators used
The following ten indicators are used to calculate the MPI:[3]
- Education (each indicator is weighted equally at 1/6)
- Years of schooling: deprived if no household member has completed five years of schooling
- Child school attendance: deprived if any school-aged child is not attending school up to class 8
- Health (each indicator is weighted equally at 1/6)
- Child mortality: deprived if any child has died in the family
- Nutrition: deprived if any adult or child for whom there is nutritional information is malnourished
- Standard of Living (each indicator is weighted equally at 1/18)
- Electricity: deprived if the household has no electricity
- Sanitation: deprived if the household’s sanitation facility is not improved (according to MDG guidelines), or it is improved but shared with other households
- Drinking water: deprived if the household does not have access to safe drinking water (according to MDG guidelines) or safe drinking water is more than a 30-minute walk from home roundtrip
- Floor: deprived if the household has a dirt, sand or dung floor
- Cooking fuel: deprived if the household cooks with dung, wood or charcoal
- Assets ownership: deprived if the household does not own more than one radio, TV, telephone, bike, motorbike or refrigerator and does not own a car or truck
A person is considered poor if they are deprived in at least a third of the weighted indicators. The intensity of poverty denotes the proportion of indicators in which they are deprived.
Real example
Niger:[4]
- MPI = 0.642
- H = 0.927
- A = 0.693
In Niger, 92.7% of the country's population is MPI poor (they are deprived in at least 33.33% of the weighted indicators, by definition). Those who are MPI poor suffer from deprivation in 69.3% of indicators, on average.
Fictional example
Country X consists of persons A, B and C. The following table shows the deprivation on each of the 10 indicators for persons A, B and C.
"0%" indicates no deprivation in that indicator, while "100%" indicates deprivation in that indicator.
| Indicator | Weight | Person A | Person B | Person C |
|---|---|---|---|---|
| 1 | 1/6 | 0% | 0% | 0% |
| 2 | 1/6 | 0% | 0% | 0% |
| 3 | 1/6 | 100% | 100% | 0% |
| 4 | 1/6 | 0% | 100% | 0% |
| 5 | 1/18 | 0% | 100% | 100% |
| 6 | 1/18 | 0% | 100% | 100% |
| 7 | 1/18 | 0% | 0% | 100% |
| 8 | 1/18 | 100% | 100% | 100% |
| 9 | 1/18 | 100% | 0% | 100% |
| 10 | 1/18 | 100% | 0% | 0% |
| Weighted score | 33.33% | 50.00% | 27.78% | |
| Status | MPI poor (≥ 33%) | MPI poor (≥ 33%) | Not MPI poor (< 33%) | |
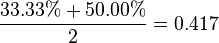
Factor H for country X is:
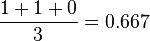
Factor A for country X is:
Thus, the MPI for country X is:

Evaluation of MPI as a poverty Indicator
The MPI constitutes a sincere effort towards expansion as well as simplification of poverty estimation.
Comparison with HDI
HDI, the Human Development Index, was developed by Mahbub ul Haq and Amartya Sen, in 1990, and was also developed by the UNDP. It is calculated as the geometric mean of the normalized indices of the three dimensions of human development it takes into account: health, education and standard of living. The UNDP is trying to improve on the HDI formula by introducing the IHDI (Inequality affected HDI).
While both HDI and MPI use the 3 broad dimensions health, education and standard of living, HDI uses only single indicators for each dimension of poverty while MPI uses more than one indicator for each one. This, amongst other reasons, has led to the MPI only being calculated for 104 countries, where data is available for all these diverse indicators, while HDI is calculated for almost all countries.
However, though HDI is thus more universally applicable, its relative sparsity of indicators also makes it more susceptible to bias. Indeed some studies have found it to be somewhat biased towards GDP per capita, as demonstrated by a high correlation between HDI and the log of GDPpc. Hence, HDI has been criticized for ignoring other development parameters.
Comparison with other indicators
Both HDI and MPI have been criticized by economists such as Ratan Lal Basu for not taking "moral/emotional/spiritual dimensions" of poverty into consideration. It has been attempted to capture these additional factors by the "Global Happiness Index" in which a country like Bhutan (which has dismal performance on other indicators) has been ranked no. 1.
MPI in some developing countries
| Country | MPI | % of People who are MPI Poor | Average Intensity of MPI Poverty | Number of MPI Poor People (thousands) | Year | % of People who are Income Poor ($1.25/day) | % of People who are Income Poor ($2.00/day) | Year |
|---|---|---|---|---|---|---|---|---|
| | 0.005 | 1.4 | 37.7 | 45 | 2009 | 0.6 | 4.3 | 2008 |
| | 0.452 | 77.4 | 58.4 | 11,136 | 2001 | 54.3 | 70.2 | 2000 |
| | 0.011 | 3.0 | 37.7 | 1,160 | 2005 | 0.9 | 2.4 | 2009 |
| | 0.004 | 1.1 | 36.2 | 34 | 2005 | 1.3 | 12.4 | 2008 |
| | 0.021 | 5.3 | 39.4 | 461 | 2006 | 1.0 | 7.8 | 2008 |
| | 0.292 | 57.8 | 50.4 | 83,207 | 2007 | 49.6 | 81.3 | 2005 |
| | 0.000 | 0.0 | 35.1 | 0 | 2005 | 0.1 | 0.2 | 2008 |
| | 0.024 | 5.6 | 42.6 | 16 | 2006 | 12.4 | 24.5 | 1999 |
| | 0.412 | 71.8 | 57.4 | 5,652 | 2006 | 47.3 | 75.3 | 2003 |
| | 0.119 | 27.2 | 43.9 | 197 | 2010 | 26.2 | 49.5 | 2003 |
| | 0.089 | 20.5 | 43.7 | 1,972 | 2008 | 13.6 | 25.1 | 2007 |
| | 0.003 | 0.8 | 37.2 | 30 | 2006 | 0.0 | 0.2 | 2007 |
| | 0.011 | 2.7 | 39.3 | 5,075 | 2006 | 3.8 | 9.9 | 2009 |
| | 0.536 | 82.6 | 64.9 | 12,078 | 2006 | 56.5 | 81.2 | 2003 |
| | 0.530 | 84.5 | 62.7 | 6,127 | 2005 | 81.3 | 93.5 | 2006 |
| | 0.251 | 52.0 | 48.4 | 6,946 | 2005 | 28.3 | 56.5 | 2007 |
| | 0.287 | 53.3 | 53.9 | 9,149 | 2004 | 9.6 | 30.4 | 2007 |
| | 0.512 | 86.4 | 59.3 | 3,199 | 2000 | 62.8 | 80.1 | 2008 |
| | 0.344 | 62.9 | 54.7 | 5,758 | 2003 | 61.9 | 83.3 | 2003 |
| | 0.056 | 12.5 | 44.9 | 161,675 | 2003 | 15.9 | 36.3 | 2005 |
| | 0.022 | 5.4 | 40.9 | 2,500 | 2010 | 16.0 | 27.9 | 2006 |
| | 0.408 | 73.9 | 55.2 | 415 | 2000 | 46.1 | 65.0 | 2004 |
| | 0.353 | 61.5 | 57.4 | 11,083 | 2005 | 23.8 | 46.3 | 2008 |
| | 0.016 | 4.4 | 36.3 | 196 | 2003 | 0.1 | 0.1 | 2008 |
| | 0.010 | 3.1 | 33.4 | 316 | 2003 | 0.1 | 0.2 | 1996 |
| | 0.139 | 29.3 | 47.3 | 241 | 2006 | 18.8 | 41.2 | 2002 |
| | 0.018 | 4.6 | 39.4 | 438 | 2007 | 4.3 | 13.6 | 2007 |
| | 0.393 | 73.2 | 53.7 | 44,485 | 2007 | 59.2 | 79.6 | 2006 |
| | 0.009 | 2.2 | 41.6 | 286 | 2003 | 4.4 | 13.6 | 2009 |
| | 0.024 | 6.0 | 40.7 | 4,699 | 2008 | 2.0 | 18.5 | 2005 |
| | 0.026 | 7.2 | 36.5 | 97 | 2003 | 0.5 | 1.5 | 2004 |
| | 0.562 | 88.6 | 63.5 | 65,798 | 2005 | 39.0 | 77.6 | 2005 |
| | 0.161 | 35.4 | 45.5 | 437 | 2000 | 4.8 | 19.6 | 2005 |
| | 0.324 | 60.4 | 53.6 | 934 | 2006 | 34.3 | 56.7 | 2003 |
| | 0.003 | 0.8 | 35.2 | 36 | 2005 | 15.3 | 32.2 | 2008 |
| | 0.144 | 31.2 | 46.2 | 7,258 | 2008 | 30.0 | 53.6 | 2006 |
| | 0.127 | 25.9 | 49.1 | 3,134 | 2003 | 11.7 | 24.3 | 2006 |
| | 0.506 | 82.5 | 61.3 | 7,459 | 2005 | 43.3 | 69.6 | 2007 |
| | 0.053 | 13.4 | 39.5 | 100 | 2005 | 8.7 | 18.0 | 1998 |
| | 0.299 | 56.4 | 53.0 | 5,346 | 2006 | 54.9 | 72.2 | 2001 |
| | 0.159 | 32.5 | 48.9 | 2,281 | 2006 | 23.3 | 35.4 | 2007 |
| | 0.016 | 4.6 | 34.3 | 466 | 2003 | 0.2 | 0.4 | 2007 |
| | 0.283 | 53.7 | 52.7 | 612,203 | 2005 | 41.6 | 75.6 | 2005 |
| | 0.095 | 20.8 | 45.9 | 48,352 | 2007 | 18.7 | 50.6 | 2009 |
| | 0.059 | 14.2 | 41.3 | 3,996 | 2006 | 4.0 | 25.3 | 2007 |
| | 0.008 | 2.4 | 34.4 | 145 | 2009 | 0.4 | 3.5 | 2006 |
| | 0.002 | 0.6 | 36.9 | 92 | 2006 | 0.2 | 1.5 | 2007 |
| | 0.229 | 47.8 | 48.0 | 18,863 | 2009 | 19.7 | 39.9 | 2005 |
| | 0.019 | 4.9 | 38.8 | 249 | 2006 | 1.9 | 29.4 | 2007 |
| | 0.267 | 47.2 | 56.5 | 2,757 | 2006 | 33.9 | 66.0 | 2008 |
| | 0.006 | 1.6 | 37.9 | 37 | 2003 | 0.3 | 1.0 | 2004 |
| | 0.156 | 35.3 | 44.1 | 759 | 2009 | 43.4 | 62.3 | 2003 |
| | 0.485 | 83.9 | 57.7 | 2,917 | 2007 | 83.7 | 94.8 | 2007 |
| | 0.008 | 1.9 | 40.9 | 39 | 2005 | 0.3 | 4.3 | 2008 |
| | 0.357 | 66.9 | 53.3 | 13,463 | 2009 | 67.8 | 89.6 | 2005 |
| | 0.381 | 72.1 | 52.8 | 8,993 | 2004 | 73.9 | 90.5 | 2004 |
| | 0.018 | 5.2 | 35.6 | 16 | 2009 | 1.5 | 12.2 | 2004 |
| | 0.558 | 86.6 | 64.4 | 11,772 | 2006 | 51.4 | 77.1 | 2006 |
| | 0.352 | 61.7 | 57.1 | 1,982 | 2007 | 21.2 | 44.1 | 2000 |
| | 0.015 | 4.0 | 38.9 | 4,313 | 2006 | 1.8 | 8.6 | 2008 |
| | 0.007 | 1.9 | 36.7 | 72 | 2005 | 1.9 | 12.5 | 2008 |
| | 0.065 | 15.8 | 41.0 | 402 | 2005 | 22.4 | 49.1 | 2005 |
| | 0.006 | 1.5 | 41.6 | 9 | 2005 | 0.1 | 0.2 | 2008 |
| | 0.048 | 10.6 | 45.3 | 3,287 | 2007 | 2.5 | 14.0 | 2007 |
| | 0.512 | 79.3 | 64.6 | 18,127 | 2009 | 59.6 | 81.8 | 2008 |
| | 0.154 | 31.8 | 48.3 | 14,297 | 2000 | |||
| | 0.187 | 39.6 | 47.2 | 855 | 2007 | 49.1 | 62.2 | 1993 |
| | 0.350 | 64.7 | 54.0 | 18,009 | 2006 | 24.82 | 57.25 | 2010 |
| | 0.128 | 28.0 | 45.7 | 1,538 | 2006 | 15.8 | 31.9 | 2005 |
| | 0.642 | 92.4 | 69.4 | 12,437 | 2006 | 43.1 | 75.9 | 2007 |
| | 0.310 | 54.1 | 57.3 | 81,510 | 2008 | 64.4 | 83.9 | 2004 |
| | 0.005 | 1.4 | 37.3 | 52 | 2007 | |||
| | 0.264 | 49.4 | 53.4 | 81,236 | 2007 | 22.6 | 61.0 | 2006 |
| | 0.064 | 13.3 | 48.5 | 755 | 2003 | 5.1 | 13.2 | 2008 |
| | 0.086 | 19.9 | 43.2 | 5,421 | 2004 | 5.9 | 14.7 | 2009 |
| | 0.064 | 13.4 | 47.4 | 12,083 | 2008 | 22.6 | 45.0 | 2006 |
| | 0.208 | 40.6 | 51.2 | 1,600 | 2009 | 54.1 | 74.4 | 2005 |
| | 0.005 | 1.3 | 38.9 | 1,883 | 2003 | 0.0 | 0.1 | 2008 |
| | 0.426 | 80.2 | 53.2 | 7,380 | 2005 | 76.8 | 89.6 | 2005 |
| | 0.154 | 34.5 | 44.7 | 56 | 2009 | 29.7 | 55.9 | 2001 |
| | 0.384 | 66.9 | 57.4 | 7,273 | 2005 | 33.5 | 60.4 | 2005 |
| | 0.003 | 0.8 | 40.0 | 79 | 2005 | 0.1 | 0.7 | 2008 |
| | 0.439 | 77.0 | 57.0 | 4,321 | 2008 | 53.4 | 76.1 | 2003 |
| | 0.000 | 0.0 | 0.0 | 0 | 2003 | 0.3 | 1.4 | 1996 |
| | 0.514 | 81.2 | 63.3 | 6,940 | 2006 | |||
| | 0.057 | 13.4 | 42.3 | 6,609 | 2008 | 17.4 | 35.7 | 2006 |
| | 0.021 | 5.3 | 38.7 | 1,027 | 2003 | 7.0 | 29.1 | 2007 |
| | 0.039 | 8.2 | 47.2 | 41 | 2006 | 15.5 | 27.2 | 1999 |
| | 0.184 | 41.4 | 44.5 | 469 | 2007 | 62.9 | 81.0 | 2001 |
| | 0.021 | 5.5 | 37.5 | 1,041 | 2006 | 1.7 | 16.9 | 2004 |
| | 0.068 | 17.1 | 40.0 | 1,103 | 2005 | 21.5 | 50.9 | 2004 |
| | 0.367 | 65.2 | 56.3 | 27,559 | 2008 | 67.9 | 87.9 | 2007 |
| | 0.006 | 1.6 | 38.5 | 1,067 | 2005 | 0.4 | 11.5 | 2004 |
| | 0.360 | 68.1 | 52.9 | 749 | 2009 | 37.4 | 72.8 | 2007 |
| | 0.284 | 54.3 | 52.4 | 3,003 | 2006 | 38.7 | 69.3 | 2006 |
| | 0.020 | 5.6 | 35.1 | 74 | 2006 | 4.2 | 13.5 | 1992 |
| | 0.010 | 2.8 | 37.1 | 272 | 2003 | 2.6 | 12.8 | 2000 |
| | 0.028 | 6.6 | 42.0 | 4,378 | 2003 | 2.7 | 9.1 | 2005 |
| | 0.367 | 72.3 | 50.7 | 21,235 | 2006 | 37.7 | 64.5 | 2009 |
| | 0.008 | 2.2 | 35.5 | 1,018 | 2007 | 0.0 | 0.1 | 2008 |
| | 0.002 | 0.6 | 35.3 | 20 | 2003 | |||
| | 0.006 | 1.7 | 34.7 | 56 | 2003 | 0.0 | 0.2 | 2009 |
| | 0.008 | 2.3 | 36.2 | 603 | 2006 | 46.3 | 76.7 | 2003 |
| | 0.129 | 30.1 | 42.7 | 67 | 2007 | |||
| | 0.084 | 17.7 | 47.2 | 14,249 | 2002 | 13.1 | 38.5 | 2008 |
| | 0.283 | 52.5 | 53.9 | 11,176 | 2006 | 17.5 | 46.6 | 2005 |
| | 0.328 | 64.2 | 51.2 | 7,739 | 2007 | 64.3 | 81.5 | 2004 |
| | 0.180 | 39.7 | 45.3 | 4,974 | 2006 |
Source: Alkire, S. Roche, JM. Santos, ME. and Seth, S (November 2011) http://ophi.qeh.ox.ac.uk . Multidimensional Poverty Index: 2011 Data. Oxford Poverty and Human Development Initiative. Available at: www.ophi.org.uk/policy/multidimensional-poverty-index/.
See also
References
- ↑ "A wealth of data. A useful new way to capture the many aspects of poverty". The Economist. July 29, 2010. Retrieved 2010-08-04.
Aided by the improved availability of survey data about living conditions for households in over 100 developing countries, the researchers have come up with a new index, called the Multidimensional Poverty Index (MPI), which the United Nations Development Programme (UNDP) will use in its next “Human Development Report” in October.
- ↑ http://www.ophi.org.uk/wp-content/uploads/Argentina.pdf
- ↑ Alkire Roche Santos Seth. "Multidimensional Poverty Index 2011: Brief Methodological Note" (PDF). Oxford Poverty & Human Development Initiative (OPHI).
- ↑ http://www.ophi.org.uk/wp-content/uploads/Niger.pdf