Morning star (candlestick pattern)
The Morning Star is a pattern seen in a candlestick chart, a type of chart used by stock analysts to describe and predict price movements of a security, derivative, or currency over time.
Description
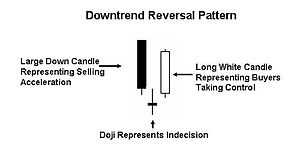
The pattern is made up of three candles: normally a long bearish candle, followed by a short bullish or bearish doji, which is then followed by a long bullish candle. In order to have a valid Morning Star formation, most traders will look for the top of the third candle to be at least halfway up the body of the first candle in the pattern. Black candles indicate falling prices, and white candles indicate rising prices.
Interpretation
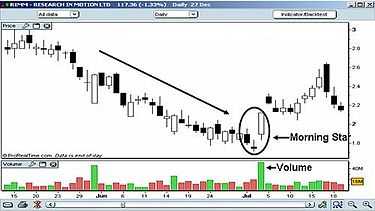
When found in a downtrend, this pattern can be an indication that a reversal in the price trend is going to take place. What the pattern represents from a supply and demand point of view is a lot of selling in the period which forms the first black candle; then, a period of lower trading but with a reduced range, which indicates indecision in the market; this forms the second candle. This is followed by a large white candle, representing buyers taking control of the market. As the Morning Star is a three-candle pattern, traders often will not wait for confirmation from a fourth candle before buying the stock. High volumes on the third trading day confirm the pattern. Traders will look at the size of the candles for an indication of the size of the potential reversal. The larger the white and black candle, and the higher the white candle moves in relation to the black candle, the larger the potential reversal.
The chart below illustrates.
The opposite occurring at the top of an uptrend is called an evening star.
See also
- Technical analysis
- Chart pattern
- Spinning top (chart pattern)
External links
- Morning Star at chartscorner.com
| ||||||||||||||||||||||||||||||||||||||||||||||||||||