Minorities of Romania
| Part of a series on the |
| Culture of Romania |
|---|
 |
| History |
|
People |
|
Mythology and folklore
|
|
Festivals |
|
|
Music and performing arts |
| Sport |
|
Organisations |
|
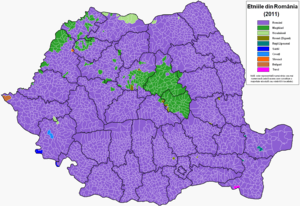


Officially, 10.5% of Romania's population is represented by minorities (the rest of 89.5% being Romanians). The principal minorities in Romania are Hungarians (Szeklers and Magyars; see Hungarians in Romania) (especially in Harghita, Covasna and Mureş counties) and Romani people, with a declining German population (in Timiş, Sibiu, Braşov) and smaller numbers of Poles in Bucovina (Austria-Hungary attracted Polish miners, who settled there from the Kraków region in Poland in the 19th century), Serbs, Croats, Slovaks and Banat Bulgarians (in Banat), Ukrainians (in Maramureş and Bukovina), Greeks (Brăila, Constanţa), Jews (Bukovina, Bucharest), Turks and Tatars (in Constanţa), Armenians, Russians (Lippovans, in Tulcea) and others. Minority populations are greatest in Transylvania and the Banat, areas in the north and west, which were possessions of Hungary (since 1867 the as part of Austria-Hungary) until World War I.
Before World War II, minorities represented more than 28% of the total population. During the war that percentage was halved, largely by the loss of the border areas of Bessarabia and northern Bukovina (to the former Soviet Union — now Moldova and Ukraine), Black Sea islands (to the former Soviet Union — now Ukraine) and southern Dobrudja (to Bulgaria), as well as by the postwar flight or deportation of ethnic Germans.
In the Romanian voting law, all government-recognized ethnic minorities in Romania had been granted each a seat in the Chamber of Deputies since the fall of the Nicolae Ceauşescu regime. This is a list with all ethnic groups from Romania with more than 1,000 persons:

| Minority | Population (2002) | Percent of the total population (2002) | Population (2011) | Percent of the total population (2011) | Area |
|---|---|---|---|---|---|
| Hungarians (incl. Szeklers) | 1,431,807 | 6.60% | 1,227,623 | 6.50% | Transylvania |
| Roma | 535,140 | 2.46% | 621,573 | 3.29% | Mures County, Călăraşi County |
| Ukrainians | 61,091 | 0.28% | 50,920 | 0.27% | Maramureş, Timiş County, Bukovina |
| Transylvanian Saxons, Swabians | 59,764 | 0.28% | 36,042 | 0.19% | Sibiu, Braşov, Bistriţa, Timiş, Caraş Severin |
| Russians/Lipovans | 35,791 | 0.17% | 23,487 | 0.12% | Tulcea County |
| Turks | 32,098 | 0.15% | 27,698 | 0.15% | Dobrogea |
| Crimean Tatars | 23,935 | 0.11% | 20,282 | 0.11% | Dobrogea |
| Serbs | 22,518 | 0.10% | 18,076 | 0.10% | Timiş, Arad, Caraş-Severin, Mehedinţi |
| Slovaks | 17,199 | 0.08% | 13,654 | 0.07% | Arad, Bihor |
| Bulgarians | 8,025 | 0.04% | 7,336 | 0.04% | Banat |
| Croats/Krašovani | 6,786 | 0.03% | 5,408 | 0.03% | Caraş-Severin |
| Greeks | 6,472 | 0.03% | 3,668 | 0.02% | Dobrogea |
| Jews | 5,785 | 0.03% | 3,271 | 0.02% | Bukovina, Bucharest |
| Czechs | 3,938 | 0.02% | 2,477 | 0.01% | Caraş-Severin County |
| Poles | 3,559 | 0.02% | 2,543 | 0.01% | Suceava County |
| Italians | 3,288 | 0.02% | 3,203 | 0.02% | Bucharest, Timiş County |
| Chinese | 2,243 | 0.01% | 2,017 | 0.01% | Bucharest |
| Armenians | 1,780 | 0.01% | 1,361 | >0.01% | Gherla |
| Csángó | 1,266 | 0.01% | 1,536 | >0.01% | Western Moldavia |
| Other: | 13,653 | 0.06% | 18,524 | 0.10% | |
| Total: | 2.276.138 | 10.49% | 2,091,963 | 11.08% | Romania |
Hungarian minority in Romania

The Hungarian-speaking minority of Romania makes up 6.6 percent of the total population of Romania (1,431,807 citizens at the 2002 census), and is the largest minority in Romania,[1] and one of the largest minorities in Europe.
Most ethnic Hungarians live in what is today known as Transylvania (where they make up about 20% of the population), an area that includes the historic regions of Banat, Crişana and Maramureş. They form a large majority of the population in the Harghita and Covasna counties and a large percentage in the Mureş county.
See also
- Albanians of Romania
- Armenians in Romania
- Aromanians
- Balkan Egyptians
- Banat Bulgarians
- Bulgarians in Romania
- Chinese in Romania
- Crimean Tatars in Romania
- Croats of Romania
- Danube Swabians
- Germans of Romania
- Greeks in Romania
- Islam in Romania
- Italians of Romania
- Jews in Romania
- Krashovani (Croats)
- Lipovans
- Macedonians in Romania
- Polish minority in Romania
- Roma minority in Romania
- Romanian ethnic minorities parties
- Serbs of Romania
- Tatars in Romania
- Turks in Romania
- Ukrainians of Romania
- Walsers - Banat French
- Jassic people a.k.a. Yassics
References
- ↑ "The Euromosaic study Hungarian in Romania - General information". European Commission. Retrieved 12-07-2012. Check date values in:
|accessdate=(help)
External links
- Romanian Government – Department for Interethnic Relations
- Ministry of Education - Department for Education in the Languages of Ethnic Minorities – site in Romanian language
- Ethnocultural Diversity Resource Center
- Roma Women Association Romania
- The Jews of Romania
- Yiddish Theater. Bibliography and Discography
- Diversity, another way of speaking about ethnic minorities
- The Rastko Project –The Internet Library of the Serbs from Romania – in Romanian language
| ||||||||||||||||||||||||||||||||||||||||||
| |||||||||||||||||||||