Milestones of the S&P 500 Index
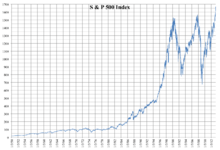
This article is a summary of the milestones of the S&P 500 Index, a United States stock market index. Since opening at 16.16, the S&P 500 has increased despite several periods of decline.[1]

History
Standard & Poor's, initially known as the Standard Statistics Company, created its first stock market index in 1923. It consisted of 233 different stocks and was computed on a weekly basis. Three years later, it developed a 90 component composite price index that was computed on a daily basis; that was expanded over the years. On March 4, 1957, the Standard & Poor's 500 (.INX) (.SPX) was introduced.[2]
Milestone highs and lows
- June 4, 1968: S&P 500 closes above 100 for the first time.
- October 19, 1987: S&P 500 registers its largest daily percentage loss, falling 20.47 percent. The one-day crash, known as "Black Monday," was blamed on program trading and those using a hedging strategy known as portfolio insurance. Despite the losses, the S&P 500 still ended up that year.
- March 24, 1995: The S&P 500 index closes above 500 for the first time. In exactly five years time, the S&P 500 tripled its value, and reached its peak prior to the dot-com bubble.
- February 2, 1998: S&P 500 closes above 1,000 for the first time.
- March 15, 1999: The S&P 500 closed above 1,300 for the first time. On the next day, the more commonly followed Dow Jones Industrial Average traded above 10,000 points for the first time. From here, milestones are provided in 10-point increments for comparison with the 100-point milestones reached by the Dow.
- March 24, 2000: The S&P 500 index reaches an all-time intraday high of 1,552.87 during the dot-com bubble.
- October 9, 2007: Index closes at a record high of 1,565.15, the highest close prior to the 2008 financial crisis.
- October 11, 2007: S&P 500 hits an intraday record high of 1,576.09.
- October 13, 2008: S&P 500 marks its best daily percentage gain, rising 11.58 percent. It also registers its largest single-day point increase of 104.13 points.
- December 31, 2008: For the year, S&P 500 falls 38.49 percent, its worst yearly percentage loss. In September 2008, Lehman Brothers collapsed as the financial crisis spread.
- March 9, 2009: S&P 500 closes at 676.53, its closing low after the onset of the 2008 financial crisis and the bankruptcy of Lehman Brothers.
- March 28, 2013: S&P 500 ends at 1,569.19, surpassing its previous record closing high set in 2007.
- April 10, 2013: S&P 500 hits new all-time intraday record high at 1,589.07, surpassing the previous record of 1,576.09 set during trading on October 11, 2007.
- May 3, 2013: S&P 500 closes above 1,600 for the first time, finishing at 1,614.42 after a much better-than-expected April U.S. non-farm payrolls report. The index also hit an all-time intraday high of 1,618.46.
- August 1, 2013: S&P 500 closes above 1,700 for the first time, finishing at 1,706.87, as well as reaching an all-time intraday high of 1,707.85.
- November 22, 2013: S&P 500 closes above 1,800 for the first time, finishing at 1,804.76 points.
- May 23, 2014: S&P 500 closes above 1,900 for the first time, finishing at 1,900.53 points.
- August 26, 2014: S&P 500 closes above 2,000 for the first time, finishing at 2,000.02 points.
- February 17, 2015: S&P 500 closes above 2,100 for the first time, finishing at 2,100.34 points.
Closing milestones
The following is a list of the milestone closing levels of the S&P 500. 5-point increments are used up to the 100-point level 10 to 200; 20 to 500; 50 to 1,000; 100 to 2,000; and 200-point increments thereafter.
| Milestone | Closing Level[4] | Date First Achieved[5] |
|---|---|---|
| The post-World War II boom (1950–1966) | ||
| 50 | 50.06 | September 30, 1958 |
| 55 | 55.21 | December 31, 1958 |
| 60 | 60.01 | July 7, 1959 |
| 65 | 65.06 | March 30, 1961 |
| 70 | 70.01 | November 6, 1961 |
| 75 | 75.02 | December 31, 1963 |
| 80 | 80.02 | April 6, 1964 |
| 85 | 85.04 | October 8, 1964 |
| 90 | 90.27 | May 13, 1965 |
| The 1970s bear market (1966–1979) | ||
| 94.061 | 94.32 | May 4, 1967 |
| 95 | 95.37 | August 1, 1967 |
| 100 | 100.38 | June 4, 1968 |
| 110 | 110.18 | April 12, 1972 |
| 120 | 120.24 | January 11, 1973 |
| The early 1980s bull depression (1980–1982) | ||
| 120.242 | 121.44 | July 17, 1980 |
| 130 | 130.40 | September 22, 1980 |
| 140 | 140.40 | November 20, 1980 |
| The mid-1980s bull market (1982–1987) | ||
| 140.523 | 142.87 | November 3, 1982 |
| 150 | 150.88 | March 1, 1983 |
| 160 | 160.71 | April 20, 1983 |
| 170 | 170.53 | June 21, 1983 |
| 180 | 180.35 | February 4, 1985 |
| 190 | 190.04 | June 4, 1985 |
| 200 | 201.41 | November 21, 1985 |
| 220 | 222.45 | February 18, 1986 |
| 240 | 242.22 | April 16, 1986 |
| 260 | 260.30 | January 12, 1987 |
| 280 | 281.16 | February 5, 1987 |
| 300 | 301.16 | March 23, 1987 |
| 320 | 322.09 | August 6, 1987 |
| The 1990s Technology Bubble (1989–2000) | ||
| 336.774 | 338.05 | July 26, 1989 |
| 340 | 341.99 | July 27, 1989 |
| 360 | 360.65 | May 29, 1990 |
| 380 | 380.40 | April 12, 1991 |
| 400 | 404.84 | December 26, 1991 |
| 420 | 420.44 | January 14, 1992 |
| 440 | 441.28 | December 18, 1992 |
| 460 | 460.13 | August 25, 1993 |
| 480 | 481.61 | January 31, 1994 |
| 500 | 500.97 | March 24, 1995 |
| 550 | 551.07 | June 22, 1995 |
| 600 | 600.07 | November 17, 1995 |
| 650 | 656.07 | February 8, 1996 |
| 700 | 701.46 | October 4, 1996 |
| 750 | 757.03 | November 25, 1996 |
| 800 | 802.77 | February 12, 1997 |
| 850 | 858.01 | June 6, 1997 |
| 900 | 904.03 | July 2, 1997 |
| 950 | 952.29 | July 30, 1997 |
| 1,000 | 1,001.27 | February 2, 1998 |
| 1,100 | 1,105.65 | March 24, 1998 |
| 1,200 | 1,202.84 | December 21, 1998 |
| 1,300 | 1,307.26 | March 15, 1999 |
| 1,400 | 1,403.28 | July 9, 1999 |
| 1,500 | 1,500.64 | March 22, 2000 |
| 2007 peak | ||
| 1,527.465 | 1,530.23 | May 30, 2007 |
| The early 2010s bull market (2009–Present) | ||
| 1,565.156 | 1,569.19 | March 28, 2013 |
| 1,600 | 1,614.42 | May 3, 2013 |
| 1,700 | 1,706.87 | August 1, 2013 |
| 1,800 | 1,804.76 | November 22, 2013 |
| 1,900 | 1,900.53 | May 23, 2014 |
| 2,000 | 2,000.02 | August 26, 2014 |
| 2,100 | 2,100.34 | February 17, 2015 |
1This was the S&P 500's close at the peak on February 9, 1966.
2This was the S&P 500's close at the peak on January 11, 1973.
3This was the S&P 500's close at the peak on November 28, 1980.
4This was the S&P 500's close at the peak on August 25, 1987.
5This was the S&P 500's close at the peak on March 24, 2000.[6]
6This was the S&P 500's close at the peak on October 9, 2007 before the 2008 financial crisis.
All-Time High Records
| Closing: | 2,117.69 | Friday, April 24, 2015 |
| Intra-day Actual: | 2,124.93 | Monday, April 27, 2015 |
See Also
- Closing milestones of the Dow Jones Industrial Average
- Closing milestones of the Nasdaq Composite
- List of largest daily changes in the S&P 500
References
- ↑ "Key dates and milestones in the S&P 500's history". Yahoo Finance. Retrieved 14 May 2013.
- ↑ "S&P 500". Wikipedia. Retrieved 15 May 2013.
- ↑ "Key dates and milestones in the S&P 500's history". Yahoo Finance. Retrieved 14 May 2013.
- ↑ Yahoo Inc. "^GSPC Historical Prices | S&P 500 Stock - Yahoo! Finance". Retrieved 5/3/2013. Check date values in:
|accessdate=(help) - ↑ Yahoo Inc. "^GSPC Historical Prices | S&P 500 Stock - Yahoo! Finance". Retrieved 5/3/2013. Check date values in:
|accessdate=(help) - ↑ Paradis, Tim (May 3, 2007). "Stocks Rise; S&P 500 Passes 1,500". The Washington Post. Associated Press. Retrieved July 5, 2014.