Merthyr Tydfil and Rhymney (UK Parliament constituency)
Coordinates: 51°45′07″N 3°18′29″W / 51.752°N 3.308°W
| Merthyr Tydfil and Rhymney | |
|---|---|
|
County constituency for the House of Commons | |
|
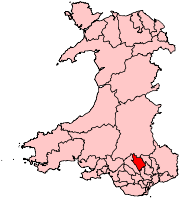
Boundary of Merthyr Tydfil and Rhymney in Wales. | |
| Electorate | 55,409 (December 2010)[1] |
| Major settlements | Merthyr Tydfil, Rhymney |
| Current constituency | |
| Created | 1983 |
| Member of parliament | Dai Havard (Labour) |
| Number of members | One |
| Created from | Merthyr Tydfil |
| Overlaps | |
| Welsh Assembly | South Wales East |
| European Parliament constituency | Wales |
Merthyr Tydfil and Rhymney (Welsh: Merthyr Tudful a Rhymni) is a county constituency represented in the House of Commons of the Parliament of the United Kingdom.
Boundaries
1983-1997: The Borough of Merthyr Tydfil; and the District of Rhymney Valley wards Nos. 5 and 14 to 20.
1997-2010: The County Borough of Merthyr Tydfil; and the Caerphilly County Borough wards of Abertysswg, Darren Valley, Moriah, New Tredegar, Pontlottyn, Tir-Phil, and Twyn Carno.
2010-present: The Merthyr Tydfil County Borough electoral divisions of Bedlinog, Cyfarthfa, Dowlais, Gurnos, Merthyr Vale, Park, Penydarren, Plymouth, Town, Treharris, and Vaynor; and the Caerphilly County Borough electoral divisions of Darran Valley, Moriah, New Tredegar, Pontlottyn, and Twyn Carno.
As its name suggests, the main towns are Merthyr Tydfil and Rhymney. The seat is bordered by the constituencies of Blaenau Gwent, Brecon and Radnorshire, Caerphilly, Cynon Valley, and Islwyn.
History
The constituency was created for the 1983 general election, prior to this Merthyr Tydfil had been in its own eponymous constituency and Rhymney was in the seat of Ebbw Vale (at the time Michael Foot's constituency) which was abolished at that election.
Members of Parliament
| Election | Member[2] | Party | |
|---|---|---|---|
| 1983 | Ted Rowlands | Labour | |
| 2001 | Dai Havard | Labour | |
| 2015 | |||
Elections
Elections in the 2010s
| General Election 2015: Merthyr Tydfil and Rhymney[3][4][5][6] | |||||
|---|---|---|---|---|---|
| Party | Candidate | Votes | % | ±% | |
| Independent | Eddy Blanche | ||||
| Liberal Democrat | Bob Griffin[7] | ||||
| Communist | Robert David Griffiths | ||||
| Labour | Gerald Jones | ||||
| Green | Elspeth Parris | ||||
| Plaid Cymru | Rhayna Pritchard | ||||
| Conservative | Bill Rees | ||||
| UKIP | Dave Rowlands | ||||
| General Election 2010: Merthyr Tydfil and Rhymney[8][9] | |||||
|---|---|---|---|---|---|
| Party | Candidate | Votes | % | ±% | |
| Labour | Dai Havard | 14,007 | 43.7 | −16.8 | |
| Liberal Democrat | Amy Kitcher | 9,951 | 31.0 | +17.0 | |
| Conservative | Maria Hill | 2,412 | 7.5 | −1.4 | |
| Independent | Clive Tovey | 1,845 | 5.8 | N/A | |
| Plaid Cymru | Glyndwr Jones | 1,621 | 5.1 | −4.9 | |
| BNP | Richard Barnes | 1,173 | 3.7 | N/A | |
| UKIP | Adam Brown | 872 | 2.7 | +0.4 | |
| Socialist Labour | Alan Cowdell | 195 | 0.6 | −0.3 | |
| Majority | 4,056 | 12.6 | |||
| Turnout | 32,076 | 58.6 | +3.2 | ||
| Labour hold | Swing | −16.9 | |||
Elections in the 2000s
| General Election 2005: Merthyr Tydfil and Rhymney | |||||
|---|---|---|---|---|---|
| Party | Candidate | Votes | % | ±% | |
| Labour | Dai Havard | 18,129 | 60.5 | −1.3 | |
| Liberal Democrat | Ceirion Rees | 4,195 | 14.0 | +6.5 | |
| Plaid Cymru | Noel Turner | 2,972 | 9.9 | −4.8 | |
| Conservative | Roger Berry | 2,680 | 8.9 | +1.7 | |
| Forward Wales | Neil Greer | 1,030 | 3.4 | +3.4 | |
| UKIP | Gwyn Parry | 699 | 2.3 | +2.3 | |
| Socialist Labour | Ina Marsden | 271 | 0.9 | −1.3 | |
| Majority | 13,934 | 46.5 | |||
| Turnout | 29,976 | 54.9 | −2.8 | ||
| Labour hold | Swing | −3.9 | |||
| General Election 2001: Merthyr Tydfil and Rhymney | |||||
|---|---|---|---|---|---|
| Party | Candidate | Votes | % | ±% | |
| Labour | Dai Havard | 19,574 | 61.8 | −14.9 | |
| Plaid Cymru | Robert Hughes | 4,651 | 14.7 | +8.7 | |
| Liberal Democrat | Keith Rogers | 2,385 | 7.5 | +0.1 | |
| Conservative | Richard Cuming | 2,272 | 7.2 | +0.8 | |
| Independent | Jeffrey Edwards | 1,936 | 6.1 | N/A | |
| Socialist Labour | Ken Evans | 692 | 2.2 | N/A | |
| ProLife Alliance | Anthony Lewis | 174 | 0.5 | N/A | |
| Majority | 14,923 | 47.1 | |||
| Turnout | 31,684 | 57.7 | −11.6 | ||
| Labour hold | Swing | ||||
Elections in the 1990s
| General Election 1997: Merthyr Tydfil and Rhymney | |||||
|---|---|---|---|---|---|
| Party | Candidate | Votes | % | ±% | |
| Labour | Ted Rowlands | 30,012 | 76.7 | ||
| Liberal Democrat | Duncan Anstey | 2,926 | 7.5 | +0.1 | |
| Conservative | Jonathan Morgan | 2,508 | 6.4 | +0.8 | |
| Plaid Cymru | Alun G. Cox | 2,344 | 6.0 | ||
| Independent Labour | Alan B. Cowdell | 691 | 1.8 | ||
| Referendum Party | Ron W. Hutchings | 660 | 1.7 | ||
| Majority | 27,086 | 69.2 | |||
| Turnout | 39,141 | 69.3 | |||
| Labour hold | Swing | ||||
| General Election 1992: Merthyr Tydfil and Rhymney[10] | |||||
|---|---|---|---|---|---|
| Party | Candidate | Votes | % | ±% | |
| Labour | Ted Rowlands | 31,710 | 71.6 | −3.8 | |
| Liberal Democrat | Robyn P.J. Rowland | 4,997 | 11.3 | +3.2 | |
| Conservative | Mark J. Hughes | 4,904 | 11.1 | −0.8 | |
| Plaid Cymru | Alun G. Cox | 2,704 | 6.1 | +1.4 | |
| Majority | 26,713 | 60.3 | −3.2 | ||
| Turnout | 44,315 | 75.8 | −0.3 | ||
| Labour hold | Swing | −3.5 | |||
Elections in the 1980s
| General Election 1987: Merthyr Tydfil and Rhymney | |||||
|---|---|---|---|---|---|
| Party | Candidate | Votes | % | ±% | |
| Labour | Ted Rowlands | 33,400 | 75.35 | ||
| Conservative | Nicholas McIndoe Walters | 5,270 | 11.89 | ||
| Liberal | Pravat Kumar Verma | 3,573 | 8.06 | ||
| Plaid Cymru | Janet Marion Davies | 2,085 | 4.70 | ||
| Majority | 28,130 | 63.46 | |||
| Turnout | 76.05 | ||||
| Labour hold | Swing | ||||
| General Election 1983: Merthyr Tydfil and Rhymney | |||||
|---|---|---|---|---|---|
| Party | Candidate | Votes | % | ±% | |
| Labour | Ted Rowlands | 29,053 | 67.35 | ||
| Liberal | P Owen | 6,323 | 14.66 | ||
| Conservative | R Blausten | 5,449 | 12.63 | ||
| Plaid Cymru | G Howells | 2,058 | 4.77 | ||
| Workers Revolutionary | T Gould | 256 | 0.59 | ||
| Majority | 22,730 | 52.69 | |||
| Turnout | 72.52 | ||||
| Labour hold | Swing | ||||
See also
- Merthyr Tydfil and Rhymney (National Assembly for Wales constituency)
- List of Parliamentary constituencies in Mid Glamorgan
Notes and references
- ↑ "Beyond 20/20 WDS - Table view". 2011 Electorate Figures. StatsWales. 1 December 2010. Retrieved 13 March 2011.
- ↑ Leigh Rayment's Historical List of MPs – Constituencies beginning with "M" (part 2)
- ↑ http://wales.greenparty.org.uk/news.html/2014/10/22/elspeth-parris-announced-as-ge-candidate-for-merthyr/
- ↑ http://labourlist.org/2014/12/gerald-jones-selected-as-candidate-for-merthyr-tydfil-and-rhymney/
- ↑ https://www.facebook.com/pages/Eddy-Blanche-for-Merthyr-Tydfil-Rhymney/720106281411913
- ↑ http://www.ukipwales.org.uk/our-candidates/4587404460
- ↑ http://www.libdems.org.uk/general_election_candidates#South West
- ↑ Merthyr Tydfil and Rhymney Caerphilly County Borough Council - candidates Merthyr Tydfil and Rhymney
- ↑ Merthyr Tydfil and Rhymney BBC Election - Merthyr Tydfil and Rhymney
- ↑ "Politics Resources". Election 1992. Politics Resources. 9 April 1992. Retrieved 2010-12-06.
| ||||||||||||||||||||||