Member states of the Organization of American States
All 35 independent nations of the Americas are member states of the Organization of American States (OAS).[1]
Member states
Upon foundation on 5 May 1948 there were 21 members. The later expansion of the OAS included Canada and the newly independent nations of the Caribbean.
| Highest | |
| Lowest |
| Flag | State |
Capital |
Joined |
Population |
km² |
GDP (PPP) $Million |
GDP (PPP) per capita [2] |
HDI New 2013 [3] |
Currency |
Official Language(s) |
|---|---|---|---|---|---|---|---|---|---|---|
| Argentina | Buenos Aires | 5 May 1948 | 40,117,096 | 2,780,400 | 716 | $18,600 | | Argentine peso | Spanish | |
| Bolivia | Sucre | 5 May 1948 | 10,389,913 | 1,098,581 | 55.4 | $6,130 | | Bolivian boliviano | Spanish | |
| Brazil | Brasilia | 5 May 1948 | 202,818,314 | 8,515,767 | 3,012 | $15,034 | | Brazilian real | Portuguese | |
| Chile | Santiago | 5 May 1948 | 16,634,603 | 756,096 | 386 | $21,911 | | Chilean peso | Spanish | |
| Colombia | Bogota | 5 May 1948 | 47,663,000 | 1,141,748 | 598 | $12,371 | | Colombian peso | Spanish | |
| Costa Rica | San José | 5 May 1948 | 4,667,096 | 51,100 | 64 | $13,872 | | Costa Rican colón | Spanish | |
| Cuba | Havana | 5 May 1948 | 11,163,934 | 109,886 | 212 | $18,796 | | Cuban peso | Spanish | |
| Dominican Republic | Santo Domingo | 5 May 1948 | 9,445,281 | 47,875 | 122 | $11,696 | | Dominican peso | Spanish | |
| Ecuador | Quito | 5 May 1948 | 15,777,700 | 255,595 | 165 | $10,469 | | United States dollar | Spanish | |
| El Salvador | San Salvador | 5 May 1948 | 6,340,000 | 21,040 | 45 | $7,762 | | United States dollar | Spanish | |
| Guatemala | Guatemala City | 5 May 1948 | 15,438,384 | 108,889 | 113 | $7,295 | | Guatemalan quetzal | Spanish | |
| Honduras | Tegucigalpa | 5 May 1948 | 8,385,072 | 112,088 | 33 | $4,591 | | Honduran lempira | Spanish | |
| Haiti | Port-au-Prince | 5 May 1948 | 10,413,211 | 27,065 | 13 | $1,703 | | Haitian gourde | French | |
| Mexico | Mexico City | 5 May 1948 | 119,713,203 | 1,967,138 | 2,014 | $16,463 | | Mexican peso | Spanish | |
| Nicaragua | Managua | 5 May 1948 | 6,071,045 | 121,428 | 24.39 | $4,571 | | Nicaraguan córdoba | Spanish | |
| Panama | Panama City | 5 May 1948 | 3,405,813 | 74,177 | 64 | $19,411 | | United States dollar | Spanish | |
| Paraguay | Asuncion | 5 May 1948 | 6,672,631 | 406,752 | 41 | $8,043 | | Paraguayan guaraní | Spanish | |
| Peru | Lima | 5 May 1948 | 30,475,144 | 1,285,216 | 358 | $11,775 | | Peruvian nuevo sol | Spanish | |
| United States | Washington D.C. | 5 May 1948 | 318,348,899 | 9,826,675 | 16,800 | $53,143 | | United States dollar | English | |
| Uruguay | Montevideo | 5 May 1948 | 3,286,314 | 175,016 | 62 | $19,590 | | Uruguayan peso | Spanish | |
| Venezuela | Caracas | 5 May 1948 | 28,946,101 | 916,445 | 553 | $18,194 | | Venezuelan bolívar | Spanish | |
| Barbados | Bridgetown | 1967 | 284,589 | 431 | 7.169 | $15,566 | | Barbadian dollar | English | |
| Trinidad and Tobago | Port of Spain | 1967 | 1,328,019 | 5,155 | 35.6 | $30,439 | | Trinidad and Tobago dollar | English | |
| Jamaica | Kingston | 1969 | 2,711,476 | 10,991 | 21 | $8,890 | | Jamaican dollar | English | |
| Grenada | St. George's | 1975 | 103,328 | 344 | 1.142 | $11,498 | | East Caribbean dollar | English | |
| Suriname | Paramaribo | 1977 | 534,189 | 163,820 | 4.7 | $16,226 | | Surinamese dollar | Dutch | |
| Dominica | Roseau | 1979 | 71,293 | 739 | 0.91 | $10,030 | | East Caribbean dollar | English | |
| Saint Lucia | Castries | 1979 | 166,526 | 617 | 2.02 | $10,560 | | East Caribbean dollar | English | |
| Antigua and Barbuda | St. John's | 1981 | 86,295 | 442 | 1.78 | $20,977 | | East Caribbean dollar | English | |
| Saint Vincent and the Grenadines | Kingstown | 1981 | 100,892 | 389 | 1.20 | $10,663 | | East Caribbean dollar | English | |
| Bahamas | Nassau | 1982 | 351,461 | 13,940 | 11.8 | $23,102 | | Bahamian dollar | English | |
| Saint Kitts and Nevis | Basseterre | 1984 | 51,970 | 270 | 0.97 | $20,929 | | East Caribbean dollar | English | |
| Canada | Ottawa | 1990 | 35,615,250 | 9,984,670 | 1,519 | $43,207 | | Canadian dollar | English, French | |
| Belize | Belmopan | 1991 | 312,971 | 22,965 | 2.38 | $8,442 | | Belizean dollar | English | |
| Guyana | Georgetown | 1991 | 784,894 | 214,999 | 2.70 | $6,551 | | Guyanese dollar | English | |
Non-members
The following is a list non-members of the OAS as they are dependencies of other nations. They are grouped under the states that control them. It should be noted that these territories are either those of member USA or of observers in the EU.
|
|
|
Observers

Members
Observers
-
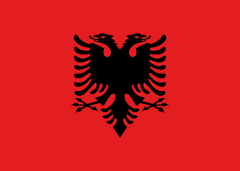 Albania
 -
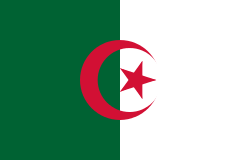 Algeria
 -
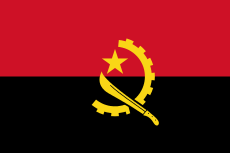 Angola
 -
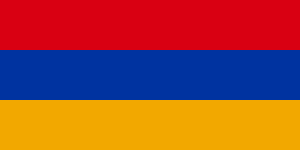 Armenia
 -
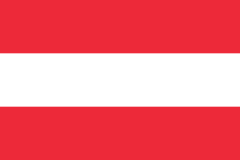 Austria
 -
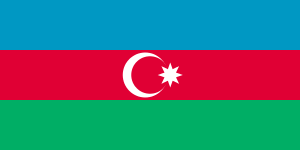 Azerbaijan
 -
.svg.png) Belgium
Belgium -
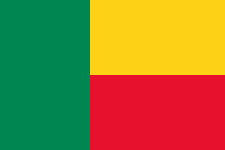 Benin
Benin -
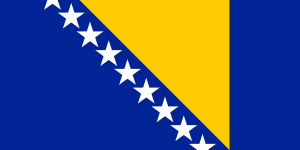 Bosnia and Herzegovina
 -
 Bulgaria
 -
 China
China -
 Croatia
 -
 Cyprus
 -
 Czech Republic
 -
 Denmark
 -
 Egypt
Egypt -
 Equatorial Guinea
 -
 Estonia
 -
 European Union
 -
 Finland
 -
 France
 -
 Georgia
 -
 Germany
 -
 Ghana
Ghana -
 Greece
 -
 Hungary
 -
 Iceland
 -
 India
India -
 Ireland
 -
 Israel
 -
 Italy
Italy -
 Japan
Japan -
 Kazakhstan
 -
 South Korea
 -
 Latvia
 -
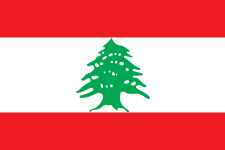 Lebanon
 -
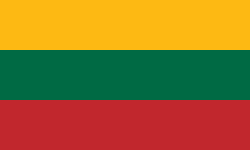 Lithuania
 -
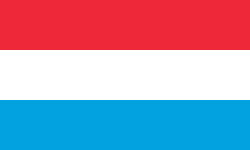 Luxembourg
 -
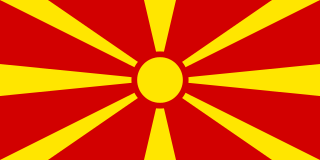 Macedonia
 -
 Malta
Malta -
 Monaco
 -
 Morocco
 -
 Netherlands
 -
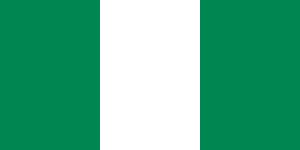 Nigeria
 -
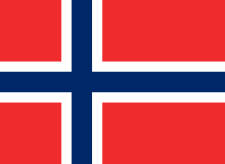 Norway
 -
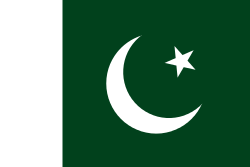 Pakistan
 -
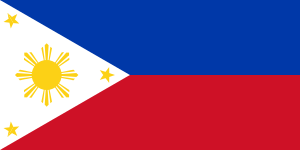 Philippines
 -
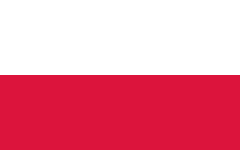 Poland
 -
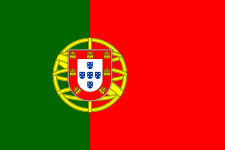 Portugal
 -
 Qatar
Qatar -
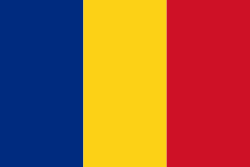 Romania
 -
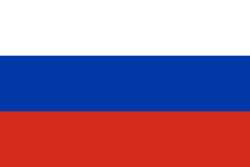 Russia
 -
 Saudi Arabia
 -
 Serbia
 -
 Slovakia
 -
 Slovenia
 -
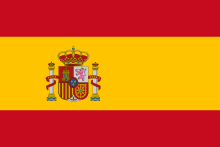 Spain
Spain -
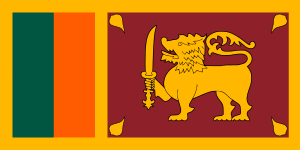 Sri Lanka
 -
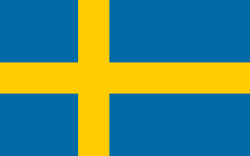 Sweden
 -
 Switzerland
 -
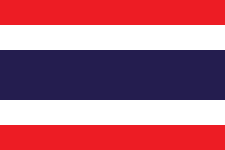 Thailand
 -
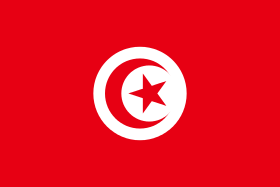 Tunisia
 -
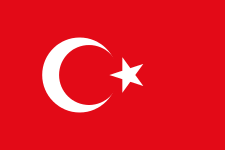 Turkey
 -
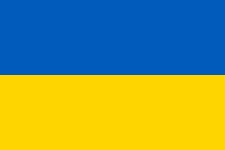 Ukraine
 -
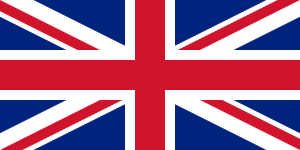 United Kingdom
 -
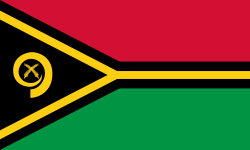 Vanuatu
 -
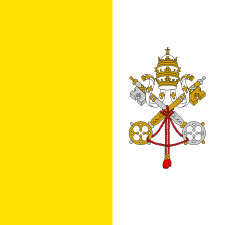 Vatican City
 -
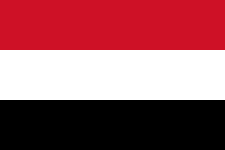 Yemen
Yemen
Footnotes
References
- ↑ "Member States". Organization of American States. Retrieved 2012-11-01.
- ↑ "World Bank". 8 July 2014.
- ↑ "International Human Development Indicators". Human Development Report 2013, The Rise of the South: Human Progress in a Diverse World. United Nations Development Programme. Retrieved 23 March 2013.