matplotlib
|
| |
|
Circular diffraction pattern using matplotlib | |
| Original author(s) | John D. Hunter |
|---|---|
| Developer(s) | Michael Droettboom, et al. |
| Stable release | 1.4.3 (17 February 2015) [±] |
| Written in | Python |
| Operating system | Cross-platform |
| Type | Plotting |
| License | matplotlib license |
| Website |
matplotlib |

matplotlib is a plotting library for the Python programming language and its numerical mathematics extension NumPy. It provides an object-oriented API for embedding plots into applications using general-purpose GUI toolkits like wxPython, Qt, or GTK+. There is also a procedural "pylab" interface based on a state machine (like OpenGL), designed to closely resemble that of MATLAB. SciPy makes use of matplotlib.
matplotlib was originally written by John D. Hunter, has an active development community,[1] and is distributed under a BSD-style license. Michael Droettboom was nominated as matplotlib's lead developer shortly before John Hunter's death in 2012.[2]
As of 26 March 2013, matplotlib 1.3.1 supports Python versions 2.6 through 3.3. Matplotlib 1.2 is the first version of matplotlib to support Python 3.x.[3]
Comparison with MATLAB
The pylab interface makes matplotlib easy to learn for experienced MATLAB users, making it a viable alternative to MATLAB as a teaching tool for numerical mathematics and signal processing.
Some of the advantages of the combination of Python, NumPy, and matplotlib over MATLAB include:
- Based on Python, a full-featured modern object-oriented programming language suitable for large-scale software development
- Free, open source, no license servers
- Native SVG support
Typically pylab is imported to bring NumPy and matplotlib into a single global namespace for the most MATLAB like syntax, however a more explicit import style, which names both matplotlib and NumPy, is the preferred coding style.[4]
Comparison with Gnuplot
Both Gnuplot and Matplotlib are mature open source projects. They both can produce enormous types of different plots. While it is hard to specify a type of figure that one can do and the other can not, they still have different advantages and disadvantages:
| Advantages | Disadvantages | |
|---|---|---|
| Matplotlib |
|
|
| Gnuplot |
|
|
Examples
Line plot
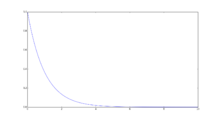
>>> import matplotlib.pyplot as plt
>>> import numpy as np
>>> a = np.linspace(0,10,100)
>>> b = np.exp(-a)
>>> plt.plot(a,b)
>>> plt.show()
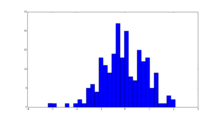
>>> from numpy.random import normal,rand
>>> x = normal(size=200)
>>> plt.hist(x,bins=30)
>>> plt.show()

>>> a = rand(100)
>>> b = rand(100)
>>> plt.scatter(a,b)
>>> plt.show()
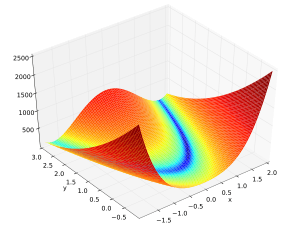
3D plot
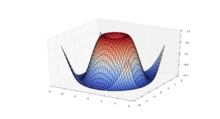
>>> from matplotlib import cm
>>> from mpl_toolkits.mplot3d import Axes3D
>>> import matplotlib.pyplot as plt
>>> import numpy as np
>>> fig = plt.figure()
>>> ax = fig.gca(projection='3d')
>>> X = np.arange(-5, 5, 0.25)
>>> Y = np.arange(-5, 5, 0.25)
>>> X, Y = np.meshgrid(X, Y)
>>> R = np.sqrt(X**2 + Y**2)
>>> Z = np.sin(R)
>>> surf = ax.plot_surface(X, Y, Z, rstride=1, cstride=1, cmap=cm.coolwarm)
>>> plt.show()
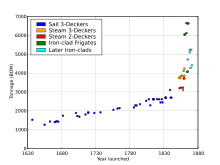
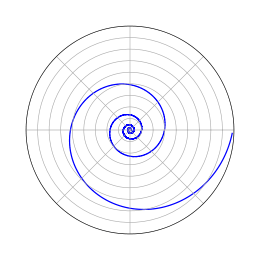
More examples

Toolkits
Several toolkits are available which extend matplotlib functionality. Some are separate downloads, others ship with the matplotlib source code but have external dependencies.[5]
- Basemap: map plotting with various map projections, coastlines, and political boundaries[6]
- Cartopy: a mapping library featuring object-oriented map projection definitions, and arbitrary point, line, polygon and image transformation capabilities.[7] (matplotlib v1.2 and above)
- Excel tools: utilities for exchanging data with Microsoft Excel
- GTK tools: interface to the GTK+ library
- Qt interface
- Mplot3d: 3-D plots
- Natgrid: interface to the natgrid library for gridding irregularly spaced data.
Related projects
- Biggles[8]
- Chaco[9]
- DISLIN
- GNU Octave
- Gnuplot-py[10]
- PLplot – Python bindings available
- PyCha[11] – libcairo implementation
- PyPlotter[12] – compatible with Jython
- Pyx[13]
- ReportLab
- Sage (mathematics software) – uses matplotlib to draw plots
- SciPy (modules plt and gplt)
- wxPython (module wx.lib.plot.py)
- Plotly - for interactive, online matplotlib and Python graphs
References
- ↑ "Matplotlib github stats". matplotlib.org.
- ↑ "Announcing Michael Droettboom as the lead matplotlib developer". matplotlib.org.
- ↑ "New in matplotlib 1.2". Retrieved 2012-11-25.
- ↑ "Matplotlib coding styles". matplotlib.org.
- ↑ "Toolkits". matplotlib.org.
- ↑ Whitaker, Jeffrey. "The Matplotlib Basemap Toolkit User's Guide (v. 1.0.5)". Matplotlib Basemap Toolkit documentation. Retrieved 24 April 2013.
- ↑ Elson, Philip. "Cartopy". Retrieved 24 April 2013.
- ↑ "Bigglessimple, elegant python plotting". biggles.sourceforge.net. Retrieved 24 November 2010.
- ↑ "Chaco". code.enthought.com.
- ↑ "Gnuplot.py on". gnuplot-py.sourceforge.net. Retrieved 24 November 2010.
- ↑ "PyCha". bitbucket.org.
- ↑ "PyPlotter".
- ↑ "PyX". pyx.sourceforge.net/.
External links
| Wikimedia Commons has media related to Made with Matplotlib. |
| ||||||