Manchester City Council election, 2011
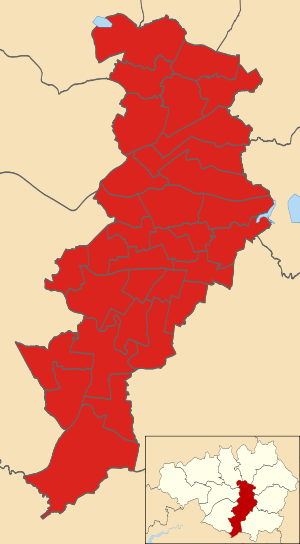
Map of the results of the 2011 Manchester council election, with
Labour in red.
Elections to Manchester City Council were held on 5 May 2011, along with the United Kingdom Alternative Vote referendum, 2011. One third of the council was up for election, with each successful candidate serving a four-year term of office, expiring in 2015. The Labour Party retained overall control of the council, managing to win every seat contested. Overall turnout was a comparatively high 31.6%, although much down on the previous year's general election turnout of 50.9%.[1]
Councillors elected in 2007 were defending their seats this year, and vote share changes are compared on this basis.
Election result
| Manchester Council Election Result 2011 |
| Party |
Seats |
Gains |
Losses |
Net gain/loss |
Seats % |
Votes % |
Votes |
+/− |
| |
Labour |
33 |
13 |
0 |
+13 |
100.0 |
62.4 |
70,580 |
+16.0% |
| |
Liberal Democrat |
0 |
0 |
11 |
-11 |
0.0 |
17.3 |
19,586 |
-14.7% |
| |
Conservative |
0 |
0 |
1 |
-1 |
0.0 |
9.0 |
10,216 |
-3.1% |
| |
Green |
0 |
0 |
0 |
0 |
0.0 |
7.6 |
8,638 |
+2.8% |
| |
BNP |
0 |
0 |
0 |
0 |
0.0 |
1.3 |
1,514 |
-1.1% |
| |
UKIP |
0 |
0 |
0 |
0 |
0.0 |
1.1 |
1,286 |
+0.2% |
| |
Independent Liberal Democrat |
0 |
0 |
1 |
-1 |
0.0 |
0.6 |
656 |
+0.6% |
| |
TUSC |
0 |
0 |
0 |
0 |
0.0 |
0.3 |
327 |
+0.2% |
| |
Independent |
0 |
0 |
0 |
0 |
0.0 |
0.1 |
153 |
-0.1% |
| |
Respect |
0 |
0 |
0 |
0 |
0.0 |
0.1 |
111 |
-0.9% |
| |
Socialist Equality |
0 |
0 |
0 |
0 |
0.0 |
0.1 |
82 |
+0.1% |
After the election, the composition of the council was as follows:[2]
| Party | Seats | ± |
|
Labour | 75 | +13 |
|
Liberal Democrat | 20 | -11 |
|
Independent Liberal Democrat | 1 | -1 |
|
Conservative | 0 | -1 |
Ward results
Asterisks denote incumbent Councillors seeking re-election. Councillors seeking re-election were elected in 2007, and results are compared to that year's polls on that basis.
Ancoats and Clayton
Ardwick
Baguley
| Baguley[1] |
| Party |
Candidate |
Votes |
% |
±% |
|
Labour Co-op |
Paul Andrews* |
1,702 |
64.6 |
+12.0 |
|
Conservative |
Ralph Ellerton |
353 |
13.4 |
-6.6 |
|
UKIP |
Christopher Cassidy |
229 |
8.7 |
N/A |
|
Liberal Democrat |
Yvonne Donaghey |
115 |
4.4 |
-5.3 |
|
Green |
Mike Dagley |
109 |
4.1 |
-3.2 |
|
TUSC |
Lynn Worthington |
74 |
2.8 |
N/A |
|
Independent |
Michael Thompson |
50 |
1.9 |
N/A |
| Majority |
1,349 |
51.2 |
|
| Turnout |
2,633 |
24.2 |
|
|
Labour hold |
Swing |
|
|
Bradford
| Bradford[1] |
| Party |
Candidate |
Votes |
% |
±% |
|
Labour |
Rosa Battle* |
2,169 |
78.4 |
+7.6 |
|
Conservative |
Sarah Bennett |
248 |
9.0 |
-0.1 |
|
Green |
Lorna Bowen |
175 |
6.3 |
+0.0 |
|
Liberal Democrat |
Emma Bean |
173 |
6.3 |
-12.5 |
| Majority |
1,921 |
69.5 |
|
| Turnout |
2,765 |
25.1 |
|
|
Labour hold |
Swing |
+10.0 |
|
Brooklands
| Brooklands[1] |
| Party |
Candidate |
Votes |
% |
±% |
|
Labour |
Sue Cooley* |
1,876 |
57.9 |
+7.6 |
|
Conservative |
Stephen Woods |
764 |
23.6 |
-9.4 |
|
UKIP |
Nathan Gilbert |
254 |
7.8 |
N/A |
|
Liberal Democrat |
Peter James Maxson |
201 |
6.2 |
-5.6 |
|
Green |
Eithne Quinn |
143 |
4.4 |
-0.4 |
| Majority |
1,112 |
34.3 |
|
| Turnout |
3,238 |
30.7 |
|
|
Labour hold |
Swing |
+6.6 |
|
Burnage
Charlestown
Cheetham
| Cheetham[1] |
| Party |
Candidate |
Votes |
% |
±% |
|
Labour |
Afzal Khan* |
3,712 |
84.4 |
+19.8 |
|
Conservative |
Samuel Jacobs |
366 |
8.3 |
-2.2 |
|
Liberal Democrat |
Nawaz Ahmed |
320 |
7.3 |
-8.5 |
| Majority |
3,346 |
76.1 |
|
| Turnout |
4,398 |
30.2 |
|
|
Labour hold |
Swing |
|
|
Chorlton
| Chorlton[1] |
| Party |
Candidate |
Votes |
% |
±% |
|
Labour |
Matthew Strong |
2,964 |
53.6 |
+13.2 |
|
Liberal Democrat |
Paul Ankers* |
1,701 |
30.7 |
-10.6 |
|
Green |
Brian Candeland |
647 |
11.7 |
-0.6 |
|
Conservative |
Mohammed Afzal |
223 |
4.0 |
-2.0 |
| Majority |
1,263 |
22.8 |
|
| Turnout |
5,535 |
50.7 |
|
|
Labour gain from Liberal Democrat |
Swing |
|
|
Chorlton Park
| Chorlton Park[1] |
| Party |
Candidate |
Votes |
% |
±% |
|
Labour |
Ian Hyde |
2,098 |
48.4 |
+25.0 |
|
Liberal Democrat |
Tony Bethell* |
1,427 |
32.9 |
-22.5 |
|
Green |
Rebecca Willmott |
493 |
11.4 |
-1.1 |
|
Conservative |
Henry Hill |
313 |
7.2 |
-1.6 |
| Majority |
671 |
15.5 |
|
| Turnout |
4,331 |
38.9 |
|
|
Labour gain from Liberal Democrat |
Swing |
|
|
City Centre
| City Centre[1] |
| Party |
Candidate |
Votes |
% |
±% |
|
Labour Co-op |
Kevin Peel |
1,048 |
36.7 |
+10.9 |
|
Independent |
Ken Dobson* |
656 |
23.0 |
N/A |
|
Liberal Democrat |
John Bridges |
459 |
16.1 |
-16.7 |
|
Conservative |
Michael Liffen |
427 |
14.9 |
-7.7 |
|
Green |
Joanne Wilkes |
268 |
9.4 |
-1.9 |
| Majority |
392 |
13.7 |
|
| Turnout |
2,858 |
21.3 |
|
|
Labour gain from Liberal Democrat |
Swing |
|
|
Crumpsall
Didsbury East
| Didsbury East[1] |
| Party |
Candidate |
Votes |
% |
±% |
|
Labour |
Andrew Simcock |
2,465 |
51.5 |
+19.3 |
|
Liberal Democrat |
Helen Fisher* |
1,598 |
33.4 |
-12.5 |
|
Conservative |
Christopher Green |
423 |
8.8 |
-4.2 |
|
Green |
Kathleen Matthews |
303 |
6.3 |
-2.6 |
| Majority |
867 |
18.1 |
|
| Turnout |
4,789 |
44.9 |
|
|
Labour gain from Liberal Democrat |
Swing |
|
|
Didsbury West
| Didsbury West[1] |
| Party |
Candidate |
Votes |
% |
±% |
|
Labour |
David Ellison |
1,686 |
44.2 |
+19.7 |
|
Liberal Democrat |
Craig Whittall |
1,172 |
30.7 |
-15.0 |
|
Conservative |
Jonathan Millard |
530 |
13.9 |
-0.4 |
|
Green |
James Alden |
424 |
11.1 |
-2.3 |
| Majority |
514 |
13.5 |
|
| Turnout |
3,812 |
36.9 |
|
|
Labour gain from Liberal Democrat |
Swing |
|
|
Fallowfield
Gorton North
Gorton South
| Gorton South[1] |
| Party |
Candidate |
Votes |
% |
±% |
|
Labour |
Peter Cookson |
2,162 |
52.3 |
+14.8 |
|
Liberal Democrat |
Simon Ashley* |
1,525 |
36.9 |
-15.2 |
|
Green |
Sean Hughes |
217 |
5.2 |
+0.8 |
|
Conservative |
Taiwo Tmo |
121 |
2.9 |
-1.3 |
|
Respect |
Marie-Angelique Bueler |
111 |
2.7 |
N/A |
| Majority |
637 |
15.4 |
|
| Turnout |
4,136 |
33.2 |
|
|
Labour gain from Liberal Democrat |
Swing |
|
|
Harpurhey
Higher Blackley
Hulme
| Hulme[1] |
| Party |
Candidate |
Votes |
% |
±% |
|
Labour |
Mary Murphy* |
1,689 |
57.4 |
-5.4 |
|
Green |
Ruth Bergan |
742 |
25.2 |
-7.4 |
|
Conservative |
Jamie Williams |
302 |
10.3 |
+4.0 |
|
Liberal Democrat |
Andy Hardwick-Moss |
211 |
7.2 |
-3.8 |
| Majority |
947 |
34.2 |
|
| Turnout |
2,944 |
24.1 |
|
|
Labour hold |
Swing |
|
|
Levenshulme
| Levenshulme[1] |
| Party |
Candidate |
Votes |
% |
±% |
|
Labour |
Aftab Ahmed |
2,210 |
52.2 |
+24.8 |
|
Liberal Democrat |
John Commons* |
1,204 |
28.4 |
-22.8 |
|
Green |
David Mottram |
627 |
14.8 |
+2.5 |
|
Conservative |
Ryan El-Idrissi |
194 |
4.6 |
-4.5 |
| Majority |
1,006 |
23.8 |
|
| Turnout |
4,235 |
37.9 |
|
|
Labour gain from Liberal Democrat |
Swing |
|
|
Longsight
| Longsight[1] |
| Party |
Candidate |
Votes |
% |
±% |
|
Labour |
Abid Chohan* |
2,855 |
72.4 |
+34.9 |
|
Liberal Democrat |
Jawaid Chaudhry |
531 |
13.5 |
-34.0 |
|
Green |
Ryan Bestford |
343 |
8.7 |
-1.4 |
|
Conservative |
Charles Bailey |
212 |
5.4 |
-0.4 |
| Majority |
2,324 |
59.0 |
|
| Turnout |
3,941 |
35.5 |
|
|
Labour gain from Liberal Democrat |
Swing |
|
|
Miles Platting and Newton Heath
Moss Side
Moston
| Moston[1] |
| Party |
Candidate |
Votes |
% |
±% |
|
Labour |
Henry Cooper* |
2,234 |
62.1 |
+6.6 |
|
Conservative |
Steven Booth |
528 |
14.7 |
-5.4 |
|
BNP |
John O'Shaughnessy |
313 |
8.7 |
N/A |
|
Liberal Democrat |
Tim Hartley |
312 |
8.7 |
-1.2 |
|
Green |
Mary Candeland |
208 |
5.8 |
1.6 |
| Majority |
1,706 |
47.5 |
|
| Turnout |
3,595 |
32.5 |
|
|
Labour hold |
Swing |
|
|
Northenden
| Northenden[1] |
| Party |
Candidate |
Votes |
% |
±% |
|
Labour |
Richard Cowell |
2,111 |
58.7 |
+14.1 |
|
Liberal Democrat |
Dave Nuttall |
1,235 |
31.2 |
-10.1 |
|
Conservative |
Phillip Page |
272 |
6.9 |
-1.6 |
|
UKIP |
Danielle Brannon |
172 |
4.3 |
N/A |
|
Green |
Chris Gibbins |
166 |
4.2 |
-1.4 |
| Majority |
876 |
22.1 |
|
| Turnout |
3,956 |
35.7 |
|
|
Labour hold |
Swing |
|
|
Old Moat
| Old Moat[1] |
| Party |
Candidate |
Votes |
% |
±% |
|
Labour |
Jeffrey Smith* |
2,311 |
65.7 |
+12.0 |
|
Liberal Democrat |
Robert Mackle |
413 |
11.7 |
-17.4 |
|
Green |
Barney Wolfram |
373 |
10.6 |
+1.7 |
|
Conservative |
Luke Springthorpe |
315 |
9.0 |
+0.6 |
|
Independent |
Yasmin Zalzala |
103 |
2.9 |
N/A |
| Majority |
1,898 |
54.0 |
|
| Turnout |
3,515 |
32.0 |
|
|
Labour hold |
Swing |
|
|
Rusholme
| Rusholme[1] |
| Party |
Candidate |
Votes |
% |
±% |
|
Labour |
Kate Chappell |
2,238 |
61.3 |
+35.9 |
|
Liberal Democrat |
Abu Chowdhury* |
883 |
24.2 |
-18.1 |
|
Green |
Richard Lane |
319 |
8.7 |
+1.1 |
|
Conservative |
Dola Miah |
212 |
5.8 |
-0.7 |
| Majority |
1,355 |
37.1 |
|
| Turnout |
3,652 |
34.1 |
|
|
Labour gain from Liberal Democrat |
Swing |
|
|
Sharston
Whalley Range
| Whalley Range[1] |
| Party |
Candidate |
Votes |
% |
±% |
|
Labour |
Aftab Razaq |
3,050 |
66.8 |
-31.8 |
|
Liberal Democrat |
Michael Chubb |
625 |
13.7 |
-36.5 |
|
Green |
Ayo Ogolo |
574 |
12.6 |
+2.9 |
|
Conservative |
Nathan Cruddas |
318 |
7.0 |
+1.9 |
| Majority |
2,425 |
53.1 |
|
| Turnout |
4,567 |
40.4 |
|
|
Labour gain from Liberal Democrat |
Swing |
|
|
Withington
Woodhouse Park
| Woodhouse Park[1] |
| Party |
Candidate |
Votes |
% |
±% |
|
Labour |
Barbara O'Neil* |
1,756 |
72.7 |
+7.4 |
|
Conservative |
Stephen McHugh |
306 |
12.7 |
-5.5 |
|
UKIP |
Pamela Shotton |
174 |
7.2 |
N/A |
|
Green |
Kathleen Molteno |
96 |
4.0 |
-3.8 |
|
Liberal Democrat |
Sarah Harding |
83 |
3.4 |
-5.4 |
| Majority |
1,450 |
60.0 |
|
| Turnout |
2,415 |
24.2 |
|
|
Labour hold |
Swing |
|
|
References
|
|---|
| | Metropolitan boroughs |
- Barnsley
- Birmingham
- Bolton
- Bradford
- Bury
- Calderdale
- Coventry
- Doncaster
- Dudley
- Gateshead
- Kirklees
- Knowsley
- Leeds
- Liverpool
- Manchester
- Newcastle upon Tyne
- North Tyneside
- Oldham
- Rochdale
- Rotherham
- Salford
- Sandwell
- Sefton
- Sheffield
- Solihull
- South Tyneside
- St Helens
- Stockport
- Sunderland
- Tameside
- Trafford
- Wakefield
- Walsall
- Wigan
- Wirral
- Wolverhampton
|
|---|
| | Unitary authorities | |
|---|
| | District councils (England) | |
|---|
| | District councils (Northern Ireland) |
- Antrim
- Ards
- Armagh
- Ballymena
- Ballymoney
- Banbridge
- Belfast
- Carrickfergus
- Castlereagh
- Coleraine
- Cookstown
- Craigavon
- Derry
- Down
- Dungannon and South Tyrone
- Fermanagh
- Larne
- Limavady
- Lisburn
- Magherafelt
- Moyle
- Newry and Mourne
- Newtownabbey
- North Down
- Omagh
- Strabane
|
|---|
| | Mayoral elections | |
|---|
| | National Assembly elections | |
|---|
| | Referendums | |
|---|
|