Manchester City Council election, 2010
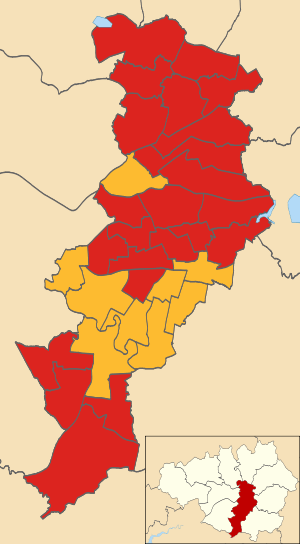
Map of the results of the 2010 Manchester council election.
Labour in red and the Liberal Democrats in yellow.
Elections to Manchester City Council were held on 6 May 2010, on the same day as the 2010 UK General Election. One-third of the council was up for election, with each successful candidate to serve a four-year term of office, expiring in 2014. Since the election there had been a further defection from the Liberal Democrats to Labour. Labour held overall control of the council, on a high turnout - owing to the general election on the same day - of 50.9%.[1]
Election result
| Manchester Council Election Result 2010 |
| Party |
Seats |
Gains |
Losses |
Net gain/loss |
Seats % |
Votes % |
Votes |
+/− |
| |
Labour |
23 |
2 |
2 |
0 |
71.9 |
46.4 |
83,258 |
+3.4% |
| |
Liberal Democrat |
9 |
2 |
2 |
0 |
28.1 |
32.0 |
57,309 |
+1.6% |
| |
Conservative |
0 |
0 |
0 |
0 |
0.0 |
12.1 |
21,712 |
-2.1% |
| |
Green |
0 |
0 |
0 |
0 |
0.0 |
4.8 |
8,589 |
-3.5% |
| |
BNP |
0 |
0 |
0 |
0 |
0.0 |
2.4 |
4,274 |
+0.5% |
| |
Respect |
0 |
0 |
0 |
0 |
0.0 |
1.0 |
1,830 |
+0.3% |
| |
UKIP |
0 |
0 |
0 |
0 |
0.0 |
0.9 |
1,658 |
+0.5% |
| |
Independent |
0 |
0 |
0 |
0 |
0.0 |
0.2 |
399 |
+0.2% |
| |
TUSC |
0 |
0 |
0 |
0 |
0.0 |
0.1 |
223 |
+0.1% |
| |
Libertarian |
0 |
0 |
0 |
0 |
0.0 |
0.0 |
55 |
+0.0% |
After the election, the composition of the council was as follows:[2]
Ward results
Ancoats and Clayton
Ardwick
| Ardwick[1] |
| Party |
Candidate |
Votes |
% |
±% |
|
Labour |
Mavis Smitheman* |
2,581 |
58.3 |
-3.8 |
|
Liberal Democrat |
Asad Osman |
1,112 |
25.1 |
+6.9 |
|
Conservative |
Andrew Paul Hartley |
463 |
10.5 |
-1.1 |
|
Green |
Patrick Thomas Sudlow |
271 |
6.1 |
-1.9 |
| Majority |
1,469 |
33.2 |
-10.8 |
| Turnout |
4,427 |
39.0 |
+21.1 |
|
Labour hold |
Swing |
-5.3 |
|
Baguley
Bradford
| Bradford[1] |
| Party |
Candidate |
Votes |
% |
±% |
|
Labour |
John Longsden* |
2,890 |
63.9 |
-3.2 |
|
Liberal Democrat |
Sarah McCulloch |
906 |
20.0 |
+6.9 |
|
Conservative |
Adam Shaw |
513 |
11.3 |
+1.1 |
|
Green |
Andrew James Bullen |
214 |
4.7 |
-4.9 |
| Majority |
1,984 |
43.9 |
-10.1 |
| Turnout |
4,523 |
42.1 |
+20.1 |
|
Labour hold |
Swing |
-5.0 |
|
Brooklands
| Brooklands[1] |
| Party |
Candidate |
Votes |
% |
±% |
|
Labour |
Sue Murphy* |
2,633 |
46.2 |
+2.0 |
|
Conservative |
Marie Raynor |
1,534 |
26.9 |
-11.5 |
|
Liberal Democrat |
Peter James Maxson |
1,061 |
18.6 |
+6.0 |
|
UKIP |
Pam Shotton |
298 |
5.2 |
+5.2 |
|
Green |
Elaine Brown |
167 |
2.9 |
-2.2 |
| Majority |
1,099 |
19.3 |
+13.5 |
| Turnout |
5,693 |
55.4 |
+26.8 |
|
Labour hold |
Swing |
+6.7 |
|
Burnage
| Burnage[1] |
| Party |
Candidate |
Votes |
% |
±% |
|
Liberal Democrat |
William David Fisher |
2,735 |
45.4 |
-19.4 |
|
Labour |
Carl Jason Austin |
2,552 |
42.4 |
+18.7 |
|
Conservative |
Peter Malcolm Schofield |
489 |
8.1 |
+1.0 |
|
Green |
Dan Collinson |
243 |
4.0 |
-0.4 |
| Majority |
183 |
3.0 |
-38.1 |
| Turnout |
6,019 |
57.6 |
+26.6 |
|
Liberal Democrat hold |
Swing |
-19.0 |
|
Charlestown
| Charlestown[1] |
| Party |
Candidate |
Votes |
% |
±% |
|
Labour |
Veronica Kirkpatrick* |
2,828 |
54.6 |
+8.6 |
|
BNP |
Stephen Moran |
802 |
15.5 |
-8.3 |
|
Conservative |
Philip Steven Donohue |
749 |
14.5 |
-0.2 |
|
Liberal Democrat |
Andrew Hardwick-Moss |
673 |
13.0 |
+6.8 |
|
Green |
Michael Prior |
127 |
2.5 |
-3.9 |
| Majority |
2,026 |
39.1 |
+16.9 |
| Turnout |
5179 |
51.2 |
+21.4 |
|
Labour hold |
Swing |
+8.4 |
|
Cheetham
| Cheetham[1] |
| Party |
Candidate |
Votes |
% |
±% |
|
Labour |
Naeem-Ul Hassan* |
3,451 |
53.8 |
+3.9 |
|
Conservative |
Imran Raza Rizvi |
1,433 |
22.3 |
+3.0 |
|
Liberal Democrat |
Liaqat Ali |
929 |
14.5 |
+2.2 |
|
Respect |
Kay Phillips |
607 |
9.5 |
-4.9 |
| Majority |
2,018 |
31.4 |
+0.9 |
| Turnout |
6,420 |
47.9 |
+18.7 |
|
Labour hold |
Swing |
+0.4 |
|
Chorlton
| Chorlton[1] |
| Party |
Candidate |
Votes |
% |
±% |
|
Liberal Democrat |
Victor Max Mark Chamberlain |
3,349 |
43.6 |
+3.9 |
|
Labour |
Amina Lone |
2,981 |
38.8 |
-6.4 |
|
Green |
Brian Arthur Candeland |
825 |
10.7 |
+1.2 |
|
Conservative |
Saira Hanif |
522 |
6.8 |
+1.3 |
| Majority |
368 |
4.8 |
-0.7 |
| Turnout |
7,677 |
72.5 |
+26.5 |
|
Liberal Democrat gain from Labour |
Swing |
+5.1 |
|
Chorlton Park
| Chorlton Park[1] |
| Party |
Candidate |
Votes |
% |
±% |
|
Liberal Democrat |
Norman Lewis* |
3,605 |
53.3 |
-0.1 |
|
Labour |
Ian Hyde |
2,193 |
32.4 |
+8.4 |
|
Conservative |
Mohammed Afzal |
524 |
7.8 |
-3.5 |
|
Green |
James Alden |
439 |
6.5 |
-4.8 |
| Majority |
1,412 |
20.9 |
-8.4 |
| Turnout |
6,761 |
63.9 |
+33.4 |
|
Liberal Democrat hold |
Swing |
-4.2 |
|
City Centre
| City Centre[1] |
| Party |
Candidate |
Votes |
% |
±% |
|
Liberal Democrat |
Elaine Boyes* |
2,080 |
40.6 |
+4.5 |
|
Labour |
Anthony McCaul |
1,610 |
31.5 |
+1.0 |
|
Conservative |
Yan Zhang |
1,106 |
21.6 |
-3.0 |
|
Green |
Iain Hepworth |
323 |
6.3 |
-2.5 |
| Majority |
470 |
9.2 |
+3.5 |
| Turnout |
5,119 |
43.0 |
+28.0 |
|
Liberal Democrat hold |
Swing |
+1.7 |
|
Crumpsall
| Crumpsall[1] |
| Party |
Candidate |
Votes |
% |
±% |
|
Labour |
Jon-Leigh Pritchard* |
3,179 |
57.9 |
+1.4 |
|
Conservative |
Shamin Raja Akhtar |
924 |
16.8 |
-2.2 |
|
Liberal Democrat |
Mo Saqib |
669 |
12.2 |
+0.9 |
|
UKIP |
Rob Willescroft |
394 |
7.2 |
+0.6 |
|
Respect |
Madaser Anwar |
321 |
7.2 |
+7.2 |
| Majority |
2,255 |
41.1 |
+3.6 |
| Turnout |
5,487 |
52.3 |
+22.3 |
|
Labour hold |
Swing |
+1.8 |
|
Didsbury East
| Didsbury East[1] |
| Party |
Candidate |
Votes |
% |
±% |
|
Liberal Democrat |
Andrew Taylor |
3,364 |
46.7 |
-5.8 |
|
Labour |
Andrew Simcock |
2,622 |
36.4 |
+9.4 |
|
Conservative |
Asad Khan |
806 |
11.2 |
-1.4 |
|
Green |
Gerry Gee |
419 |
5.8 |
-2.1 |
| Majority |
742 |
10.3 |
-15.2 |
| Turnout |
7,211 |
68.8 |
+30.8 |
|
Liberal Democrat hold |
Swing |
-7.6 |
|
Didsbury West
| Didsbury West[1] |
| Party |
Candidate |
Votes |
% |
±% |
|
Liberal Democrat |
Mark Clayton* |
3,088 |
50.2 |
+3.0 |
|
Labour |
David Clive Ellison |
1,978 |
32.2 |
+9.4 |
|
Conservative |
David Michael Bean |
1,086 |
17.7 |
+1.1 |
| Majority |
1,110 |
18.0 |
-6.4 |
| Turnout |
6,152 |
61.4 |
+33.6 |
|
Liberal Democrat hold |
Swing |
-3.2 |
|
Fallowfield
Gorton North
Gorton South
| Gorton South[1] |
| Party |
Candidate |
Votes |
% |
±% |
|
Labour |
Julie Reid |
2,737 |
45.9 |
+11.4 |
|
Liberal Democrat |
John Bridges* |
2,529 |
42.4 |
-0.4 |
|
Conservative |
William Lawrence Clapham |
426 |
7.1 |
-0.3 |
|
Respect |
Marie-Angelique Bueler |
270 |
4.5 |
+4.5 |
| Majority |
208 |
3.5 |
-4.8 |
| Turnout |
5,962 |
49.8 |
+24.6 |
|
Labour gain from Liberal Democrat |
Swing |
+5.9 |
|
Harpurhey
| Harpurhey[1] |
| Party |
Candidate |
Votes |
% |
±% |
|
Labour |
Paul Fairweather* |
3,054 |
60.0 |
+2.7 |
|
Liberal Democrat |
Andi Sidwell |
684 |
13.4 |
+1.1 |
|
BNP |
Peter Brown |
627 |
12.3 |
+12.3 |
|
Conservative |
Martin James Rosen |
587 |
11.5 |
-7.9 |
|
Green |
Arteth Jean Gray |
141 |
2.8 |
-8.2 |
| Majority |
2,370 |
46.5 |
+8.6 |
| Turnout |
5,093 |
42.1 |
+21.0 |
|
Labour hold |
Swing |
+0.8 |
|
Higher Blackley
| Higher Blackley[1] |
| Party |
Candidate |
Votes |
% |
±% |
|
Labour |
Anna Trotman* |
3,037 |
56.6 |
+12.8 |
|
Conservative |
Vivienne Inez Clarke |
820 |
15.3 |
-0.1 |
|
BNP |
Derek George Adams |
813 |
15.2 |
-12.1 |
|
Liberal Democrat |
Nicholas Renaud-Komiya |
581 |
10.8 |
+2.6 |
|
Respect |
Paul Kelly |
111 |
2.1 |
+2.1 |
| Majority |
2,217 |
41.3 |
+24.8 |
| Turnout |
5,362 |
52.0 |
+21.7 |
|
Labour hold |
Swing |
+6.4 |
|
Hulme
| Hulme[1] |
| Party |
Candidate |
Votes |
% |
±% |
|
Labour |
Nigel Joseph Murphy* |
2,445 |
45.8 |
+3.6 |
|
Liberal Democrat |
Ian James Kimpton |
1,229 |
23.0 |
+14.7 |
|
Green |
Gayle Simms O'Donnovan |
1,172 |
22.0 |
-18.0 |
|
Conservative |
Amjad Nasir |
490 |
9.2 |
-0.2 |
| Majority |
1,216 |
22.8 |
+20.6 |
| Turnout |
5,336 |
46.3 |
+24.6 |
|
Labour hold |
Swing |
-5.5 |
|
Levenshulme
| Levenshulme[1] |
| Party |
Candidate |
Votes |
% |
±% |
|
Liberal Democrat |
James Hennigan |
2,546 |
41.7 |
-14.0 |
|
Labour |
Aftab Ahmed |
2,340 |
38.3 |
+12.3 |
|
Green |
David William Mottram |
664 |
10.9 |
-1.0 |
|
Conservative |
Rob Manning |
556 |
9.1 |
+2.7 |
| Majority |
206 |
3.4 |
-26.3 |
| Turnout |
6,106 |
56.7 |
+30.0 |
|
Liberal Democrat hold |
Swing |
-13.1 |
|
Longsight
| Longsight[1] |
| Party |
Candidate |
Votes |
% |
±% |
|
Labour |
Suzanne Richards |
2,639 |
49.1 |
-12.5 |
|
Liberal Democrat |
Jawaid Iqbal Chaudhry |
2,101 |
39.1 |
+12.7 |
|
Conservative |
Tahir Mahmood Khan |
351 |
6.5 |
+1.8 |
|
Respect |
Martin Lambert |
282 |
5.2 |
+5.2 |
| Majority |
538 |
10.0 |
-25.3 |
| Turnout |
5,373 |
52.9 |
+17.6 |
|
Labour hold |
Swing |
-12.6 |
|
Miles Platting and Newton Heath
Moss Side
| Moss Side[1] |
| Party |
Candidate |
Votes |
% |
±% |
|
Labour |
Roy Blake Walters* |
3,681 |
65.5 |
-2.5 |
|
Liberal Democrat |
Ahmed Samatar |
1,160 |
20.6 |
+10.1 |
|
Conservative |
William Stobart |
362 |
6.4 |
-0.7 |
|
Green |
Nigel James Woodcock |
306 |
5.4 |
-3.2 |
|
Independent |
Colette Williams |
109 |
1.9 |
+1.9 |
| Majority |
2,521 |
44.9 |
-12.8 |
| Turnout |
5,618 |
48.9 |
+24.3 |
|
Labour hold |
Swing |
-6.3 |
|
Moston
| Moston[1] |
| Party |
Candidate |
Votes |
% |
±% |
|
Labour |
Rita Tavernor* |
2,701 |
44.0 |
-5.5 |
|
Liberal Democrat |
Tim Hartley |
1,768 |
28.8 |
+16.1 |
|
Conservative |
Steven Booth |
836 |
13.6 |
-16.3 |
|
BNP |
Tony Trebilcock |
765 |
12.5 |
+12.5 |
|
Green |
Mosab Musbahi |
74 |
1.2 |
-6.7 |
| Majority |
933 |
15.2 |
-4.4 |
| Turnout |
6,144 |
56.0 |
+27.4 |
|
Labour hold |
Swing |
-10.8 |
|
Northenden
| Northenden[1] |
| Party |
Candidate |
Votes |
% |
±% |
|
Liberal Democrat |
Mary Di Mauro |
2,503 |
42.2 |
-1.6 |
|
Labour |
Richard James Cowell* |
2,478 |
41.8 |
-1.8 |
|
Conservative |
Steve Whittaker |
546 |
9.2 |
+1.0 |
|
BNP |
Sarah Anne Barnes |
233 |
3.9 |
+3.9 |
|
UKIP |
Michael Kevin Conlan |
166 |
2.8 |
+2.8 |
| Majority |
25 |
0.4 |
+0.2 |
| Turnout |
5,926 |
54.4 |
+20.7 |
|
Liberal Democrat gain from Labour |
Swing |
+0.1 |
|
Old Moat
| Old Moat[1] |
| Party |
Candidate |
Votes |
% |
±% |
|
Labour |
Suzannah Mary Reeves |
2,531 |
43.8 |
-6.7 |
|
Liberal Democrat |
Rob Mackle |
2,216 |
38.3 |
+3.9 |
|
Conservative |
Shaden Jaradat |
489 |
8.5 |
+1.1 |
|
Green |
Rowan William Smith |
410 |
7.1 |
-0.6 |
|
Independent |
Yasmin Zalzala |
133 |
2.3 |
+2.3 |
| Majority |
315 |
5.5 |
-10.6 |
| Turnout |
5,779 |
54.6 |
+27.8 |
|
Labour hold |
Swing |
-5.3 |
|
Rusholme
| Rusholme[1] |
| Party |
Candidate |
Votes |
% |
±% |
|
Labour |
Rabnawaz Akbar |
2,259 |
44.1 |
+16.9 |
|
Liberal Democrat |
Tanvir Akhtar |
1,885 |
36.8 |
-5.9 |
|
Conservative |
Dola Miah |
466 |
9.1 |
-2.3 |
|
Green |
Justine Hall |
342 |
6.7 |
+0.5 |
|
TUSC |
Nahella Ashraf |
95 |
1.9 |
+1.9 |
|
Respect |
Ali Shelmani |
73 |
1.4 |
+1.4 |
| Majority |
374 |
7.3 |
-8.3 |
| Turnout |
5,120 |
51.3 |
+25.6 |
|
Labour gain from Liberal Democrat |
Swing |
+11.4 |
|
Sharston
| Sharston[1] |
| Party |
Candidate |
Votes |
% |
±% |
|
Labour Co-op |
Hugh Barrett* |
2,335 |
45.6 |
-1.6 |
|
Conservative |
Gregory Barrie Davis |
933 |
18.2 |
-14.5 |
|
Liberal Democrat |
Francesca Bliss |
930 |
18.2 |
+6.6 |
|
BNP |
Bernard Todd |
371 |
7.2 |
+7.2 |
|
UKIP |
Robert Edward Burke |
283 |
5.5 |
+5.5 |
|
Independent |
Jimmy McCullough |
157 |
3.1 |
+3.1 |
|
Green |
Luke Smith |
114 |
2.2 |
-6.2 |
| Majority |
1,402 |
27.4 |
+13.7 |
| Turnout |
5,123 |
44.4 |
+23.3 |
|
Labour hold |
Swing |
+6.4 |
|
Whalley Range
| Whalley Range[1] |
| Party |
Candidate |
Votes |
% |
±% |
|
Labour |
Mary Rose Watson* |
3,137 |
46.5 |
+16.8 |
|
Liberal Democrat |
Mohammed Sajjad |
2,330 |
34.6 |
-4.7 |
|
Green |
Mary Rosalind Candeland |
556 |
8.2 |
-0.7 |
|
Conservative |
Sophia Fox-Miles |
552 |
8.2 |
-13.9 |
|
Respect |
Mohammed Zulfikar |
166 |
2.5 |
+2.5 |
| Majority |
807 |
12.0 |
+2.4 |
| Turnout |
6,741 |
61.4 |
+20.9 |
|
Labour hold |
Swing |
+10.7 |
|
Withington
| Withington[1] |
| Party |
Candidate |
Votes |
% |
±% |
|
Liberal Democrat |
Simon David Wheale* |
2,849 |
51.4 |
-6.3 |
|
Labour Co-op |
Chris Paul |
1,558 |
28.1 |
+5.0 |
|
Conservative |
Shumaila Malik |
600 |
10.8 |
+1.7 |
|
Green |
Laura Alice Bannister |
534 |
9.6 |
-0.6 |
| Majority |
1,291 |
23.3 |
-11.2 |
| Turnout |
5,541 |
50.6 |
+30.0 |
|
Liberal Democrat hold |
Swing |
-5.6 |
|
Woodhouse Park
By-elections between 2010 and 2011
| Hulme By-Election 4 November 2010[3] |
| Party |
Candidate |
Votes |
% |
±% |
|
Labour |
Amina Lone |
1,031 |
60.6 |
+14.8 |
|
Green |
Deyika Nzeribe |
451 |
26.5 |
+4.5 |
|
Liberal Democrat |
Grace Baynham |
151 |
8.9 |
-14.1 |
|
Conservative |
Will Stobart |
67 |
3.9 |
-5.3 |
| Majority |
580 |
34.1 |
+11.3 |
| Turnout |
1,700 |
10.9 |
-35.4 |
|
Labour hold |
Swing |
+5.1 |
|
| Baguley By-Election 20 January 2011[3] |
| Party |
Candidate |
Votes |
% |
±% |
|
Labour |
Tracey Rawlins |
996 |
70.8 |
+23.7 |
|
Conservative |
Ralph Ellerton |
160 |
11.4 |
-4.8 |
|
UKIP |
Christopher Cassidy |
76 |
5.4 |
-1.4 |
|
Liberal Democrat |
Yvonne Donaghey |
52 |
3.7 |
-20.8 |
|
BNP |
Bernard Todd |
52 |
3.7 |
+3.7 |
|
Green |
Mike Dagley |
51 |
3.6 |
-0.8 |
|
Independent |
Honor Donnelly |
19 |
1.4 |
+1.4 |
| Majority |
836 |
59.5 |
+36.9 |
| Turnout |
1,406 |
12.9 |
-32.0 |
|
Labour hold |
Swing |
+14.2 |
|
References