Manchester City Council election, 2008
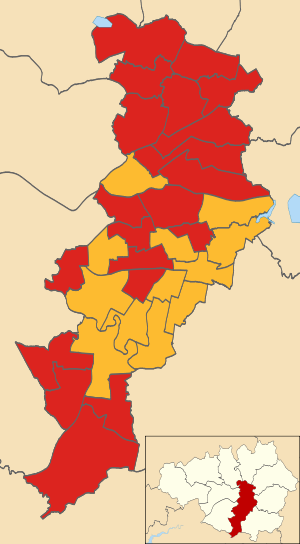
Map of the results of the 2008 Manchester council election.
Labour in red and the Liberal Democrats in yellow.
Elections to Manchester City Council took place on 1 May 2008. One third of the council was up for election[1] - every ward of the city returned one councillor at this election out of the three councillors a ward in the city has.
Four national political parties - the Conservative Party, Labour, Liberal Democrats and the Green Party - each stood a candidate in every ward in this election. There were candidates from other political parties standing in some of the wards, but there were no independent candidates standing for election this year in the city.
The Labour party retained overall control of the council. The Green party lost their only seat in Hulme to Labour and the Conservatives failed to gain their first elected councillor, though became the third party on the council due to having one councillor through an earlier defection. The Liberal Democrats, who'd suffered two defections since the last election - firstly the aforementioned Tory defection, and another to Labour - gained 2 councillors (in Miles Platting & Newton Heath and Northenden) but lost one (in Longsight) to Labour.
Voting took place between 7am and 10pm on Thursday 1 May 2008 and counting took place that night at the Town Hall. Overall turnout fell slightly to 27%.[2][3]
Election result
| Manchester Council Election Result 2008 |
| Party |
Seats |
Gains |
Losses |
Net gain/loss |
Seats % |
Votes % |
Votes |
+/− |
| |
Labour |
19 |
2 |
2 |
0 |
59.4 |
43.0 |
39,300 |
-2.4% |
| |
Liberal Democrat |
13 |
2 |
1 |
+1 |
40.6 |
30.4 |
27,773 |
-1.4% |
| |
Conservative |
0 |
0 |
0 |
0 |
0.0 |
14.2 |
12,999 |
+3.2% |
| |
Green |
0 |
0 |
1 |
-1 |
0.0 |
8.3 |
7,602 |
-0.1% |
| |
BNP |
0 |
0 |
0 |
0 |
0.0 |
1.9 |
1,765 |
+0.8% |
| |
Respect |
0 |
0 |
0 |
0 |
0.0 |
0.7 |
655 |
+0.1% |
| |
Left List |
0 |
0 |
0 |
0 |
0.0 |
0.7 |
612 |
+0.7% |
| |
UKIP |
0 |
0 |
0 |
0 |
0.0 |
0.4 |
371 |
-0.7% |
| |
Socialist Alternative |
0 |
0 |
0 |
0 |
0.0 |
0.3 |
295 |
+0.0% |
After the election, the composition of the council was:[1]
Ward results
Below is a list of the 32 individual wards with the candidates standing in those wards and the number of votes the candidates acquired. The winning candidate per ward is in bold.
Ancosts and Clayton
Ardwick
| Ardwick[2][3] |
| Party |
Candidate |
Votes |
% |
±% |
|
Labour |
Tom O'Callaghan* |
1,180 |
62.1 |
+4.7 |
|
Liberal Democrat |
Mohammed Sajjad |
346 |
18.2 |
-6.6 |
|
Conservative |
Claire Babington |
221 |
11.6 |
+4.3 |
|
Green |
Andrew Speke |
152 |
8.0 |
-2.6 |
| Majority |
836 |
44.0 |
+11.4 |
| Turnout |
1,899 |
17.9 |
-3.6 |
|
Labour hold |
Swing |
+5.6 |
|
Baguley
Bradford
| Bradford[2][3] |
| Party |
Candidate |
Votes |
% |
±% |
|
Labour |
Neil Swannick* |
1,467 |
67.1 |
-3.7 |
|
Liberal Democrat |
Chris Jenkinson |
286 |
13.1 |
-0.7 |
|
Conservative |
Rod Keller |
224 |
10.2 |
+1.1 |
|
Green |
Andrew Bullen |
209 |
9.6 |
+3.3 |
| Majority |
1,181 |
54.0 |
-3.0 |
| Turnout |
2,186 |
22.0 |
-0.3 |
|
Labour hold |
Swing |
-1.5 |
|
Brooklands
Burnage
| Burnage[2][3] |
| Party |
Candidate |
Votes |
% |
±% |
|
Liberal Democrat |
John Cameron* |
2,096 |
64.8 |
+10.5 |
|
Labour |
Tom Murphy |
768 |
23.7 |
-12.3 |
|
Conservative |
Peter Schofield |
228 |
7.1 |
+1.3 |
|
Green |
Angela Tibke |
142 |
4.4 |
+0.5 |
| Majority |
1,328 |
41.1 |
+22.8 |
| Turnout |
3,234 |
31.0 |
-1.0 |
|
Liberal Democrat hold |
Swing |
+11.4 |
|
Charlestown
| Charlestown[2][3] |
| Party |
Candidate |
Votes |
% |
±% |
|
Labour |
Mark Hackett* |
1,328 |
46.0 |
-13.0 |
|
BNP |
Stephen Moran |
687 |
23.8 |
+23.8 |
|
Conservative |
Gareth Brown |
425 |
14.7 |
-1.3 |
|
Green |
Michael Prior |
186 |
6.4 |
+0.7 |
|
Liberal Democrat |
Alexandra Reynolds-Cocroft |
178 |
6.2 |
-4.1 |
|
UKIP |
Catherine Ritchie |
84 |
2.9 |
-6.2 |
| Majority |
641 |
22.2 |
-20.7 |
| Turnout |
2,888 |
29.8 |
+2.0 |
|
Labour hold |
Swing |
-18.4 |
|
Cheetham
| Cheetham[2][3] |
| Party |
Candidate |
Votes |
% |
±% |
|
Labour |
Martin Pagel* |
1,735 |
49.9 |
-14.7 |
|
Conservative |
Wajid Ali |
673 |
19.3 |
+8.8 |
|
Respect |
Kay Phillips |
502 |
14.4 |
+14.4 |
|
Liberal Democrat |
Sham Raja |
429 |
12.3 |
-3.5 |
|
Green |
Luke Smith |
141 |
4.1 |
-5.1 |
| Majority |
1,062 |
30.5 |
-18.3 |
| Turnout |
3,480 |
29.2 |
-2.3 |
|
Labour hold |
Swing |
-11.7 |
|
Chorlton
Chorlton Park
| Chorlton Park[2][3] |
| Party |
Candidate |
Votes |
% |
±% |
|
Liberal Democrat |
Bernie Ryan |
1,693 |
53.4 |
-2.0 |
|
Labour Co-op |
John Hacking |
763 |
24.0 |
+0.6 |
|
Green |
Kathryn Brownbridge |
359 |
11.3 |
-1.2 |
|
Conservative |
Christopher Green |
358 |
11.3 |
+2.5 |
| Majority |
930 |
29.3 |
-2.7 |
| Turnout |
3,173 |
30.5 |
-0.5 |
|
Liberal Democrat hold |
Swing |
-1.3 |
|
City Centre
| City Centre[2][3] |
| Party |
Candidate |
Votes |
% |
±% |
|
Liberal Democrat |
Marc Ramsbottom* |
568 |
36.1 |
+3.3 |
|
Labour |
Anthony McCaul |
479 |
30.5 |
+4.7 |
|
Conservative |
Rob Adlard |
386 |
24.6 |
+2.0 |
|
Green |
Peter Birkinshaw |
139 |
8.8 |
-2.5 |
| Majority |
89 |
5.7 |
-1.4 |
| Turnout |
1,572 |
15.0 |
-1.0 |
|
Liberal Democrat hold |
Swing |
-0.7 |
|
Crumpsall
Didsbury East
| Didsbury East[2][3] |
| Party |
Candidate |
Votes |
% |
±% |
|
Liberal Democrat |
David Sandiford* |
2,050 |
52.5 |
+6.6 |
|
Labour |
Andrew Simcock |
1,053 |
27.0 |
-5.2 |
|
Conservative |
Louise Quigley |
492 |
12.6 |
-0.4 |
|
Green |
Gerry Gee |
310 |
7.9 |
-1.0 |
| Majority |
997 |
25.5 |
+11.8 |
| Turnout |
3,905 |
38.0 |
-1.1 |
|
Liberal Democrat hold |
Swing |
+5.9 |
|
Didsbury West
| Didsbury West[2][3] |
| Party |
Candidate |
Votes |
% |
±% |
|
Liberal Democrat |
Graham Shaw* |
1,283 |
47.2 |
+1.5 |
|
Labour |
Jenny Lennox |
620 |
22.8 |
-1.7 |
|
Conservative |
David Bean |
451 |
16.6 |
+2.3 |
|
Green |
James Alden |
281 |
10.3 |
-3.1 |
|
UKIP |
Robert Gutfreund-Walmsley |
81 |
3.0 |
+0.9 |
| Majority |
663 |
24.4 |
+3.2 |
| Turnout |
2,716 |
27.8 |
-1.4 |
|
Liberal Democrat hold |
Swing |
+1.6 |
|
Fallowfield
Gorton North
| Gorton North[2][3] |
| Party |
Candidate |
Votes |
% |
±% |
|
Liberal Democrat |
Jackie Pearcey* |
1,468 |
48.7 |
-3.6 |
|
Labour |
John Hughes |
1,156 |
38.3 |
-2.4 |
|
Conservative |
Jane Percival |
242 |
8.0 |
+4.2 |
|
Green |
Karl Wardlaw |
150 |
5.0 |
+1.8 |
| Majority |
312 |
10.3 |
-1.3 |
| Turnout |
3,016 |
27.5 |
-4.1 |
|
Liberal Democrat hold |
Swing |
-0.6 |
|
Gorton South
| Gorton South[2][3] |
| Party |
Candidate |
Votes |
% |
±% |
|
Liberal Democrat |
Charles Glover* |
1,262 |
42.8 |
-9.3 |
|
Labour |
Julie Reid |
1,017 |
34.5 |
-3.0 |
|
Left List |
Sue McPherson |
292 |
9.9 |
+9.9 |
|
Conservative |
William Clapham |
217 |
7.4 |
+3.2 |
|
Green |
Deborah Clarke |
164 |
5.6 |
+1.2 |
| Majority |
245 |
8.3 |
+3.9 |
| Turnout |
2,952 |
25.2 |
-1.7 |
|
Liberal Democrat hold |
Swing |
-3.1 |
|
Harpurhey
Higher Blackley
Hulme
Levenshulme
Longsight
| Longsight[2][3] |
| Party |
Candidate |
Votes |
% |
±% |
|
Labour |
Luthfur Rahman |
2,005 |
61.6 |
+14.1 |
|
Liberal Democrat |
Liaqat Ali* |
858 |
26.4 |
-21.1 |
|
Green |
Spencer Fitz-Gibbon |
237 |
7.3 |
-2.8 |
|
Conservative |
Daniel Valentine |
153 |
4.7 |
-0.3 |
| Majority |
1,147 |
35.3 |
+25.3 |
| Turnout |
3,253 |
31.4 |
+0.0 |
|
Labour gain from Liberal Democrat |
Swing |
+17.6 |
|
Miles Platting and Newton Heath
Moss Side
Moston
| Moston[2][3] |
| Party |
Candidate |
Votes |
% |
±% |
|
Labour |
Paul Murphy* |
1,551 |
49.5 |
-6.0 |
|
Conservative |
Gareth Morris |
936 |
29.9 |
+9.8 |
|
Liberal Democrat |
Timothy Hartley |
398 |
12.7 |
+2.8 |
|
Green |
Tom Redford |
246 |
7.9 |
+3.7 |
| Majority |
615 |
19.6 |
-15.8 |
| Turnout |
3,131 |
28.6 |
-0.6 |
|
Labour hold |
Swing |
-7.9 |
|
Northenden
Old Moat
Rusholme
| Rusholme[2][3] |
| Party |
Candidate |
Votes |
% |
±% |
|
Liberal Democrat |
Paul Shannon* |
1,090 |
42.7 |
+0.4 |
|
Labour |
Atiha Chaudry |
693 |
27.2 |
+1.8 |
|
Left List |
Nahella Ashraf |
320 |
12.5 |
-5.7 |
|
Conservative |
Dola Miah |
291 |
11.4 |
+4.9 |
|
Green |
Penny Collins |
158 |
6.2 |
-1.4 |
| Majority |
397 |
15.6 |
-1.3 |
| Turnout |
2,552 |
25.7 |
-5.0 |
|
Liberal Democrat hold |
Swing |
-0.7 |
|
Sharston
Whalley Range
| Whalley Range[2][3] |
| Party |
Candidate |
Votes |
% |
±% |
|
Liberal Democrat |
John Grant* |
1,683 |
39.3 |
-10.9 |
|
Labour |
Amina Lone |
1,271 |
29.7 |
-5.3 |
|
Conservative |
Fawad Hussain |
945 |
22.1 |
+17.0 |
|
Green |
Mary Candeland |
381 |
8.9 |
-0.8 |
| Majority |
412 |
9.6 |
-5.5 |
| Turnout |
4,280 |
40.5 |
+1.5 |
|
Liberal Democrat hold |
Swing |
-8.1 |
|
Withington
| Withington[2][3] |
| Party |
Candidate |
Votes |
% |
±% |
|
Liberal Democrat |
Brendon Jones |
1,267 |
57.7 |
-3.0 |
|
Labour |
Leif Jerram |
508 |
23.1 |
+0.6 |
|
Green |
Felicity Paris |
223 |
10.2 |
+0.5 |
|
Conservative |
Zoe Slater |
199 |
9.1 |
+2.0 |
| Majority |
759 |
34.5 |
-3.7 |
| Turnout |
2,197 |
20.6 |
-0.9 |
|
Liberal Democrat hold |
Swing |
-1.8 |
|
Woodhouse Park
By-elections between 2008 and 2010
| Didsbury West By-Election 29 January 2009[4] |
| Party |
Candidate |
Votes |
% |
±% |
|
Liberal Democrat |
Lianne Caroline Williams |
1439 |
55.6 |
+8.4 |
|
Labour |
David Clive Ellison |
638 |
24.7 |
+1.9 |
|
Conservative |
David Michael Bean |
336 |
13.0 |
-3.6 |
|
Green |
Geoff Evans |
173 |
6.7 |
-3.6 |
| Majority |
801 |
31.0 |
+6.6 |
| Turnout |
2,586 |
26.1 |
-1.7 |
|
Liberal Democrat hold |
Swing |
+3.2 |
|
| Moston By-Election 9 April 2009[4] |
| Party |
Candidate |
Votes |
% |
±% |
|
Labour |
Rita Anne Tavernor |
1,353 |
38.7 |
-10.8 |
|
BNP |
Derek George Adams |
815 |
23.3 |
+23.3 |
|
Liberal Democrat |
Timothy John Hartley |
696 |
19.9 |
+7.2 |
|
Conservative |
Phil Donohue |
558 |
16.0 |
-13.9 |
|
Green |
Karl Wardlaw |
74 |
2.1 |
-5.8 |
| Majority |
538 |
15.4 |
-4.2 |
| Turnout |
2,586 |
26.1 |
-1.7 |
|
Labour hold |
Swing |
-17.0 |
|
References