Manchester City Council election, 2006
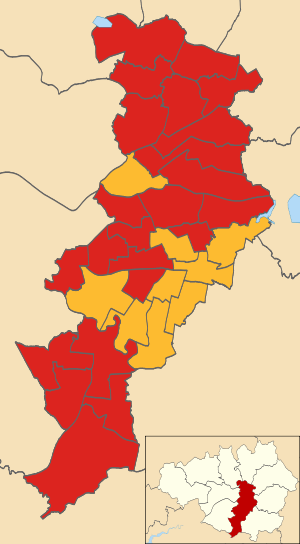
Map of the results of the 2006 Manchester council election.
Labour in red and the Liberal Democrats in yellow.
Elections to Manchester City Council were held on 4 May 2006. One third of the council was up for election, with each successful candidate to serve a four-year term of office, expiring in 2010. The council stayed under Labour Party control, strengthened by four gains from the Liberal Democrats.[1][2]
Election result
| Manchester Council Election Result 2006[2] |
| Party |
Seats |
Gains |
Losses |
Net gain/loss |
Seats % |
Votes % |
Votes |
+/− |
| |
Labour |
23 |
4 |
0 |
+4 |
71.9 |
44.8 |
41,039 |
+4.9% |
| |
Liberal Democrat |
9 |
0 |
4 |
-4 |
28.1 |
31.6 |
28,929 |
-2.3% |
| |
Conservative |
0 |
0 |
0 |
0 |
0.0 |
10.5 |
9,649 |
-2.2% |
| |
Green |
0 |
0 |
0 |
0 |
0.0 |
9.3 |
8,493 |
-1.0% |
| |
UKIP |
0 |
0 |
0 |
0 |
0.0 |
1.2 |
1,128 |
+1.0% |
| |
Independent |
0 |
0 |
0 |
0 |
0.0 |
0.9 |
833 |
+0.4% |
| |
BNP |
0 |
0 |
0 |
0 |
0.0 |
0.7 |
641 |
+0.3% |
| |
Respect |
0 |
0 |
0 |
0 |
0.0 |
0.7 |
615 |
-0.3% |
| |
Socialist Alternative |
0 |
0 |
0 |
0 |
0.0 |
0.2 |
214 |
+0.2% |
| |
Independent Liberal |
0 |
0 |
0 |
0 |
0.0 |
0.0 |
11 |
+0.0% |
After the election, the composition of the council was:[3]
Ward results
Below is a list of the 32 individual wards with the candidates standing in those wards and the number of votes the candidates acquired. The winning candidate per ward is in bold.
Ancoats and Clayton
| Ancoats and Clayton[1][2] |
| Party |
Candidate |
Votes |
% |
±% |
|
Labour |
Jim Battle* |
1,463 |
48.3 |
+2.2 |
|
Liberal Democrat |
Daniel James Valentine |
1,235 |
40.7 |
-0.2 |
|
Conservative |
Christine Joan Birchenough |
136 |
4.5 |
-0.6 |
|
Green |
Richard Francis Keatley |
126 |
4.2 |
-0.5 |
|
Independent |
John Hulse |
71 |
2.3 |
-1.2 |
| Majority |
228 |
7.6 |
+2.0 |
| Turnout |
3,031 |
32.9 |
-5.1 |
|
Labour hold |
Swing |
+1.2 |
|
Ardwick
| Ardwick[1][2] |
| Party |
Candidate |
Votes |
% |
±% |
|
Labour |
Mavis Smitheman* |
1,248 |
61.4 |
+15.7 |
|
Liberal Democrat |
Mohammad Alam Panwar |
405 |
19.9 |
-7.5 |
|
Green |
Christopher David Charlton |
216 |
10.6 |
-2.4 |
|
Conservative |
Tadeusz Sochacki |
163 |
8.0 |
+0.9 |
| Majority |
843 |
41.5 |
+23.2 |
| Turnout |
2,032 |
21.7 |
-2.7 |
|
Labour hold |
Swing |
+11.6 |
|
Baguley
Bradford
Brooklands
Burnage
| Burnage[1][2] |
| Party |
Candidate |
Votes |
% |
±% |
|
Liberal Democrat |
Rodney Alan Isherwood* |
1,460 |
47.5 |
-10.4 |
|
Labour |
Frank Oliver Duffy |
1,169 |
38.0 |
+12.7 |
|
Conservative |
Dorothy Helen Keller |
252 |
8.2 |
-0.5 |
|
Green |
Elindsay James |
149 |
4.8 |
-3.2 |
| Majority |
291 |
9.5 |
-23.1 |
| Turnout |
3,073 |
29.8 |
-10.3 |
|
Liberal Democrat hold |
Swing |
-11.5 |
|
Charlestown
| Charlestown[1][2] |
| Party |
Candidate |
Votes |
% |
±% |
|
Labour |
Eric Hobin* |
1,435 |
54.3 |
-4.8 |
|
Conservative |
Vivienne Inez Clarke |
388 |
14.7 |
-1.5 |
|
Liberal Democrat |
Ann Rodgers |
348 |
13.2 |
-11.5 |
|
UKIP |
Catherine Andrea Ritchie |
312 |
11.8 |
+11.8 |
|
Green |
Helen Sarah Dolan |
159 |
6.0 |
+6.0 |
| Majority |
1,047 |
39.6 |
+5.2 |
| Turnout |
2,642 |
29.2 |
-5.2 |
|
Labour hold |
Swing |
-1.6 |
|
Cheetham
| Cheetham Ward |
| Party |
Candidate |
Votes |
% |
±% |
|
Labour |
Naeem Ul Hassam |
1,707 |
45.6 |
+0.8 |
|
Liberal Democrat |
Qassim Afzal |
1,608 |
43.0 |
+5.9 |
|
Green |
Jacqueline Smith |
235 |
6.3 |
+6.3 |
|
Conservative |
Kim Elvin Glasspole |
191 |
5.1 |
+2.4 |
| Majority |
99 |
2.6 |
-5.1 |
| Turnout |
3,741 |
36.2 |
-11.0 |
|
Labour hold |
Swing |
-2.5 |
|
Chorlton
Chorlton Park
| Chorlton Park[1][2] |
| Party |
Candidate |
Votes |
% |
±% |
|
Liberal Democrat |
Norman Lewis* |
1,724 |
54.7 |
+0.7 |
|
Labour |
Yogesh Virmani |
797 |
25.3 |
+6.4 |
|
Green |
Kathryn Mary Brownbridge |
399 |
12.7 |
-1.1 |
|
Conservative |
Rodney Keller |
229 |
7.3 |
+0.0 |
| Majority |
927 |
29.4 |
+5.6 |
| Turnout |
3,149 |
32.1 |
-10.9 |
|
Liberal Democrat hold |
Swing |
-2.8 |
|
City Centre
| City Centre[1][2] |
| Party |
Candidate |
Votes |
% |
±% |
|
Liberal Democrat |
Elaine Boyes |
531 |
38.0 |
+0.5 |
|
Labour Co-op |
Chris Paul |
374 |
26.8 |
-0.8 |
|
Conservative |
James Jacob Gilchrist Berry |
311 |
22.3 |
+7.1 |
|
Green |
Birgit Vollm |
181 |
13.0 |
-2.0 |
| Majority |
157 |
11.2 |
+1.3 |
| Turnout |
1,397 |
16.4 |
-2.4 |
|
Liberal Democrat hold |
Swing |
+0.6 |
|
Crumpsall
| Crumpsall[1][2] |
| Party |
Candidate |
Votes |
% |
±% |
|
Labour |
Jon-Leigh Pritchard* |
1,667 |
49.6 |
+4.6 |
|
Liberal Democrat |
Sham Raja |
738 |
21.9 |
+2.2 |
|
Conservative |
Adrian Paul Glasspole |
476 |
14.2 |
-4.3 |
|
UKIP |
Ernest Robert Willescroft |
259 |
7.7 |
+7.7 |
|
Green |
Justine Michelle Hall |
223 |
6.6 |
-10.1 |
| Majority |
929 |
27.6 |
+2.4 |
| Turnout |
3,363 |
33.8 |
-8.0 |
|
Labour hold |
Swing |
+1.2 |
|
Didsbury East
| Didsbury East[1][2] |
| Party |
Candidate |
Votes |
% |
±% |
|
Liberal Democrat |
Anthony Thomas Parkinson* |
1,809 |
45.3 |
-2.4 |
|
Labour |
Geoffrey Bridson |
1,369 |
34.3 |
+2.9 |
|
Green |
Richard Edgar Gee |
459 |
11.5 |
+3.4 |
|
Conservative |
Peter Malcolm Schofield |
359 |
9.0 |
-3.7 |
| Majority |
440 |
11.0 |
-5.3 |
| Turnout |
3,996 |
39.1 |
-9.3 |
|
Liberal Democrat hold |
Swing |
-2.6 |
|
Didsbury West
| Didsbury West[1][2] |
| Party |
Candidate |
Votes |
% |
±% |
|
Liberal Democrat |
Richard Mark Clayton |
1,189 |
42.9 |
+0.1 |
|
Labour |
David Clive Ellison |
692 |
25.0 |
+4.6 |
|
Conservative |
Peter Girvan Hilton |
485 |
17.5 |
+2.3 |
|
Green |
George Stanislaw Czernuszka |
329 |
11.9 |
-4.2 |
|
UKIP |
Robert Gutfreund-Walmsley |
76 |
2.7 |
-2.9 |
| Majority |
497 |
17.9 |
-4.5 |
| Turnout |
2,771 |
28.0 |
-8.4 |
|
Liberal Democrat hold |
Swing |
-2.2 |
|
Fallowfield
| Fallowfield[1][2] |
| Party |
Candidate |
Votes |
% |
±% |
|
Labour |
Mike Amesbury |
1,357 |
46.4 |
+4.1 |
|
Liberal Democrat |
John-Paul Wilkins* |
1,086 |
37.2 |
+0.6 |
|
Conservative |
Cedric Beniston |
171 |
5.9 |
-3.8 |
|
Green |
Susan Somerville |
168 |
5.7 |
-5.7 |
|
BNP |
Joseph Gerard Marjella Finnon |
140 |
4.8 |
+4.8 |
| Majority |
271 |
9.3 |
+3.5 |
| Turnout |
2,922 |
28.1 |
-2.4 |
|
Labour gain from Liberal Democrat |
Swing |
+1.7 |
|
Gorton North
| Gorton North[1][2] |
| Party |
Candidate |
Votes |
% |
±% |
|
Labour |
Nilofar Siddiqi |
1,244 |
39.7 |
+0.1 |
|
Liberal Democrat |
Bernadette Newing* |
1,132 |
36.1 |
-11.0 |
|
Independent |
Allan James Grafton |
465 |
14.8 |
+14.8 |
|
Conservative |
Patricia Ann Ainscough |
144 |
4.6 |
-3.5 |
|
Green |
Rachel Michelle Wilson |
78 |
2.5 |
-2.8 |
|
Independent |
David Colin Jones |
72 |
2.3 |
+2.3 |
| Majority |
112 |
3.6 |
-3.9 |
| Turnout |
3,135 |
31.4 |
-1.9 |
|
Labour gain from Liberal Democrat |
Swing |
+5.5 |
|
Gorton South
| Gorton South[1][2] |
| Party |
Candidate |
Votes |
% |
±% |
|
Liberal Democrat |
John Richard Bridges* |
1,375 |
47.8 |
-7.6 |
|
Labour |
Julie Reid |
1,031 |
35.8 |
+8.3 |
|
Green |
David William Mottram |
246 |
8.5 |
-1.0 |
|
Conservative |
Raymond Kenyon |
226 |
7.9 |
+0.4 |
| Majority |
344 |
12.0 |
-15.9 |
| Turnout |
2,878 |
26.9 |
-4.6 |
|
Liberal Democrat hold |
Swing |
-7.9 |
|
Harpurhey
| Harpurhey[1][2] |
| Party |
Candidate |
Votes |
% |
±% |
|
Labour |
Paul Fairweather* |
1,420 |
55.3 |
-0.3 |
|
Liberal Democrat |
Gareth David Aubrey |
320 |
12.5 |
-11.5 |
|
UKIP |
Roger Porter Bullock |
312 |
12.1 |
+12.1 |
|
Conservative |
Ian Beswick |
302 |
11.8 |
-2.4 |
|
Green |
Darren Jason Flynn |
215 |
8.4 |
+8.4 |
| Majority |
1,100 |
42.8 |
+11.2 |
| Turnout |
2,569 |
22.1 |
-4.8 |
|
Labour hold |
Swing |
+5.6 |
|
Higher Blackley
Hulme
| Hulme[1][2] |
| Party |
Candidate |
Votes |
% |
±% |
|
Labour |
Nigel Joseph Murphy |
816 |
37.9 |
+1.8 |
|
Liberal Democrat |
Oliver West |
576 |
26.7 |
+7.6 |
|
Green |
Steven Jonathan Durrant |
539 |
25.0 |
-12.4 |
|
Conservative |
Paul Anthony Kierman |
96 |
4.6 |
-2.7 |
|
Independent |
Christine Anne Boscott-Shermerdine |
53 |
2.5 |
+2.5 |
|
Independent |
Captain Cae Os |
43 |
2.0 |
+2.0 |
|
UKIP |
Peter David Reeve |
20 |
0.9 |
+0.9 |
|
Independent Liberal |
Charles Anthony Lyn-Lloyd |
11 |
0.5 |
+0.5 |
| Majority |
240 |
11.1 |
+9.8 |
| Turnout |
2,154 |
24.1 |
-1.5 |
|
Labour hold |
Swing |
-2.9 |
|
Levenshulme
| Levenshulme[1][2] |
| Party |
Candidate |
Votes |
% |
±% |
|
Liberal Democrat |
Alexander Cowan* |
1,402 |
50.1 |
-3.1 |
|
Labour |
Dermot Sean Zafar |
779 |
27.9 |
+3.8 |
|
Green |
Peter Norman Thompson |
399 |
14.3 |
-2.1 |
|
Conservative |
William Moore |
217 |
7.8 |
+1.5 |
| Majority |
623 |
22.3 |
-6.9 |
| Turnout |
2,797 |
28.4 |
-4.1 |
|
Liberal Democrat hold |
Swing |
-3.4 |
|
Longsight
| Longsight[1][2] |
| Party |
Candidate |
Votes |
% |
±% |
|
Labour |
Maryam Fazeela Khan |
1,687 |
54.6 |
+24.4 |
|
Liberal Democrat |
Mohammed Sajjad* |
774 |
25.1 |
-19.2 |
|
Green |
Hassan Ukairo |
444 |
14.4 |
-1.7 |
|
Conservative |
Zahir Ali |
182 |
5.9 |
-3.5 |
| Majority |
913 |
30.0 |
+15.4 |
| Turnout |
3,087 |
32.3 |
-6.0 |
|
Labour gain from Liberal Democrat |
Swing |
+21.8 |
|
Miles Platting and Newtown Heath
Moss Side
| Moss Side[1][2] |
| Party |
Candidate |
Votes |
% |
±% |
|
Labour |
Roy Blake Walters* |
1,734 |
63.7 |
+3.6 |
|
Liberal Democrat |
Mohammad Hamza Butt |
509 |
18.7 |
+1.1 |
|
Green |
Robin Goater |
235 |
8.6 |
+0.2 |
|
Independent |
Reverend Juggla |
129 |
4.7 |
-2.8 |
|
Conservative |
Raymond Talbot Wattenbach |
116 |
4.3 |
-2.1 |
| Majority |
1,225 |
45.0 |
+2.4 |
| Turnout |
2,723 |
27.8 |
-0.0 |
|
Labour hold |
Swing |
+1.2 |
|
Moston
| Moston[1][2] |
| Party |
Candidate |
Votes |
% |
±% |
|
Labour |
Bill Risby* |
1,774 |
53.1 |
-5.2 |
|
Conservative |
Anthony Gerard Pinder |
755 |
22.6 |
-2.7 |
|
Liberal Democrat |
Timothy John Hartley |
506 |
15.2 |
+3.1 |
|
Green |
Rose Ann Cameron |
303 |
9.0 |
+9.0 |
| Majority |
1,019 |
30.5 |
-2.6 |
| Turnout |
3,338 |
31.2 |
-6.1 |
|
Labour hold |
Swing |
-1.2 |
|
Northenden
| Northenden[1][2] |
| Party |
Candidate |
Votes |
% |
±% |
|
Labour |
Richard James Cowell* |
1,431 |
46.9 |
+2.2 |
|
Liberal Democrat |
Martin Clive Eakins |
1,092 |
35.8 |
+15.7 |
|
Conservative |
Nathan James Cruddas |
391 |
12.8 |
-5.2 |
|
Green |
Lance David Crookes |
136 |
4.5 |
-12.6 |
| Majority |
339 |
11.1 |
-13.5 |
| Turnout |
3,050 |
29.3 |
-3.6 |
|
Labour hold |
Swing |
-6.7 |
|
Old Moat
| Old Moat[1][2] |
| Party |
Candidate |
Votes |
% |
±% |
|
Labour |
Brian Harrison* |
1,567 |
54.4 |
+5.0 |
|
Liberal Democrat |
Tina Maache |
773 |
26.9 |
-0.4 |
|
Green |
Robin-Ella Davies |
317 |
11.0 |
-1.4 |
|
Conservative |
Daniel Rossall Valentine |
221 |
7.7 |
-3.2 |
| Majority |
794 |
27.6 |
+5.4 |
| Turnout |
2,878 |
29.2 |
-3.2 |
|
Labour hold |
Swing |
+2.7 |
|
Rusholme
| Rusholme[1][2] |
| Party |
Candidate |
Votes |
% |
±% |
|
Liberal Democrat |
Lynne Williams* |
1,157 |
39.9 |
-16.0 |
|
Labour |
John Byrne |
804 |
27.7 |
-0.8 |
|
Respect |
Nahella Ashraf |
615 |
21.2 |
+21.2 |
|
Green |
Penelope Irene Collins |
188 |
6.5 |
-2.9 |
|
Conservative |
Barbara Mary Goodall |
135 |
4.7 |
-1.4 |
| Majority |
353 |
12.2 |
-15.1 |
| Turnout |
2,899 |
31.5 |
-6.5 |
|
Liberal Democrat hold |
Swing |
-7.6 |
|
Sharston
Whalley Range
| Whalley Range[1][2] |
| Party |
Candidate |
Votes |
% |
±% |
|
Labour |
Mary Rose Watson |
1,637 |
46.1 |
+17.4 |
|
Liberal Democrat |
Joy Ruth Winder* |
1,158 |
32.6 |
-6.6 |
|
Green |
Mary Rosalind Candeland |
466 |
13.1 |
+0.6 |
|
Conservative |
Matthew Graham Cox |
289 |
8.1 |
-11.5 |
| Majority |
479 |
13.5 |
+2.9 |
| Turnout |
3,550 |
34.5 |
-9.3 |
|
Labour gain from Liberal Democrat |
Swing |
+12.0 |
|
Withington
| Withington[1][2] |
| Party |
Candidate |
Votes |
% |
±% |
|
Liberal Democrat |
Simon David Wheale |
1,064 |
47.8 |
-10.6 |
|
Labour |
Delores Elizabeth Long |
613 |
27.6 |
+9.0 |
|
Green |
Sarah Stuart |
340 |
15.3 |
+0.9 |
|
Conservative |
Andrew Christopher Perfect |
207 |
9.3 |
+0.7 |
| Majority |
451 |
20.3 |
-19.5 |
| Turnout |
2,224 |
22.3 |
-8.4 |
|
Liberal Democrat hold |
Swing |
-9.8 |
|
Woodhouse Park
By-elections between 2006 and 2007
| Gorton South By-Election 19 October 2006[4] |
| Party |
Candidate |
Votes |
% |
±% |
|
Liberal Democrat |
Charles Glover |
1,588 |
49.3 |
+1.5 |
|
Labour |
Julie Reid |
1,208 |
37.5 |
+1.7 |
|
BNP |
Derek Adams |
185 |
5.7 |
+5.7 |
|
Green |
David Mottram |
151 |
4.7 |
-3.8 |
|
Conservative |
Daniel Valentine |
90 |
2.8 |
-5.1 |
| Majority |
380 |
11.8 |
-0.2 |
| Turnout |
3,222 |
29.9 |
+3.0 |
|
Liberal Democrat hold |
Swing |
-0.1 |
|
References