Loughborough (UK Parliament constituency)
| Loughborough | |
|---|---|
|
County constituency for the House of Commons | |
|
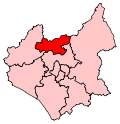
Boundary of Loughborough in Leicestershire. | |
|
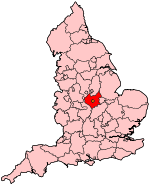
Location of Leicestershire within England. | |
| County | Leicestershire |
| Electorate | 77,884 (December 2010)[1] |
| Major settlements | Loughborough |
| Current constituency | |
| Created | 1885 |
| Member of parliament | Nicky Morgan (Conservative) |
| Number of members | One |
| Created from | North Leicestershire |
| Overlaps | |
| European Parliament constituency | East Midlands |
Loughborough is a constituency[n 1] in Leicestershire represented in the House of Commons of the UK Parliament since 2010 by Nicky Morgan, a Conservative.[n 2]
Boundaries
The constituency comprises the towns of Loughborough and Shepshed, the villages of Barrow upon Soar, Hathern, Sileby and Quorn and a number of smaller villages in the Wolds. It borders the constituencies of North West Leicestershire, Charnwood, Rutland and Melton and Rushcliffe.
Latest boundary review
According with the Boundary Commission's Fifth Periodic Review of Westminster constituencies Parliament made only minor changes to the existing constituency boundaries. The 2010-modified constituency has electoral wards:
- Barrow and Sileby West, Loughborough Ashby, Loughborough Dishley and Hathern, Loughborough Garendon, Loughborough Hastings, Loughborough Lemyngton, Loughborough Nanpantan, Loughborough Outwoods, Loughborough Shelthorpe, Loughborough Southfields, Loughborough Storer, Quorn and Mountsorrel Castle, Shepshed East, Shepshed West, Sileby, and The Wolds Villages.
History
Loughborough was originally part of a larger constituency, Leicestershire, which was split into two districts in the Reform Act of 1832.
In the Redistribution of Seats Act of 1885 Leicestershire was divided into five parts, Eastern (Melton), Mid [or] (Loughborough), Western (Bosworth) and Southern (Harborough), each returning one member, the last part was a borough constituency for Leicester which returned two MPs.
In 1983 the Leicestershire coalfield, an area loyal to Labour, was removed from the constituency and replaced by much of the Soar Valley, a rural area that tended to vote Conservative. Opencast coal mining is still relevant to the west of the seat only at Measham, one of the few high-profile excavations planned by Coalfield Resources PLC (formerly UK Coal). In 1995 the Soar Valley was moved to the newly created Charnwood constituency approximately reinstating the old version of the seat.
The last time that Loughborough was not represented by an MP from a governing political party was prior to the February 1974 general election, making the constituency somewhat of a bellwether.
Members of Parliament
| Election | Member[2] | Party | |
|---|---|---|---|
| 1885 | Sir Edward Johnson-Ferguson, 1st Baronet | Liberal | |
| 1886 | Edwin de Lisle | Conservative | |
| 1892 | Sir Edward Johnson-Ferguson, 1st Baronet | Liberal | |
| 1900 | Sir Maurice Levy, 1st Baronet | Liberal | |
| 1918 | Oscar Guest | Liberal | |
| 1922 | Edward Spears | National Liberal | |
| 1924 | Frank Rye | Conservative | |
| 1929 | George Ernest Winterton | Labour | |
| 1931 | Lawrence Kimball | Conservative | |
| 1945 | Mont Follick | Labour | |
| 1955 | John Desmond Cronin | Labour | |
| 1979 | Stephen Dorrell | Conservative | |
| 1997 | Andy Reed | Labour Co-operative | |
| 2010 | Nicky Morgan | Conservative | |
Elections
Elections in the 2010s
| General Election 2015: Loughborough [3] | |||||
|---|---|---|---|---|---|
| Party | Candidate | Votes | % | ±% | |
| Labour | Matthew O'Callaghan[4] | ||||
| Conservative | Nicky Morgan[5] | ||||
| Liberal Democrat | Stephen Coltman[6] | ||||
| UKIP | Bill Piper[7] | ||||
| Green | Matt Sisson[8] | ||||
| General Election 2010: Loughborough[9][10] | |||||
|---|---|---|---|---|---|
| Party | Candidate | Votes | % | ±% | |
| Conservative | Nicky Morgan | 21,971 | 41.6 | +4.3 | |
| Labour Co-op | Andy Reed | 18,227 | 34.5 | -6.7 | |
| Liberal Democrat | Mike Willis | 9,675 | 18.3 | +0.4 | |
| BNP | Kevan Stafford | 2,040 | 3.9 | - | |
| UKIP | John Foden | 925 | 1.8 | -0.6 | |
| Majority | 3,744 | 7.1 | |||
| Turnout | 52,838 | 68.2 | +5.2 | ||
| Conservative gain from Labour Co-op | Swing | +5.5 | |||
Elections in the 2000s
The 2005 general election saw Andy Reed returned with a decreased majority after his share of the vote dropped by 8.3%. Loughborough was the 126th target seat of the Conservative Party and their share of the vote increased slightly but the Liberal Democrats had the largest increase. The swing of 5.0% from Labour to Conservative was higher than the national swing of 3.0% and turnout was above average.
| General Election 2005: Loughborough | |||||
|---|---|---|---|---|---|
| Party | Candidate | Votes | % | ±% | |
| Labour Co-op | Andy Reed | 19,098 | 41.4 | −8.3 | |
| Conservative | Nicky Morgan | 17,102 | 37.1 | +1.8 | |
| Liberal Democrat | Graeme Smith | 8,258 | 17.9 | +5.1 | |
| UKIP | Bernard Sherratt | 1,094 | 2.4 | +0.3 | |
| Veritas | John McVay | 588 | 1.3 | N/A | |
| Majority | 1,996 | 4.3 | −10.1 | ||
| Turnout | 46,140 | 63.8 | +0.6 | ||
| Labour Co-op hold | Swing | −5.0 | |||
| General Election 2001: Loughborough | |||||
|---|---|---|---|---|---|
| Party | Candidate | Votes | % | ±% | |
| Labour Co-op | Andy Reed | 22,016 | 49.7 | +1.2 | |
| Conservative | Neil Lyon | 15,638 | 35.3 | −2.4 | |
| Liberal Democrat | Julie Simons | 5,667 | 12.8 | +1.0 | |
| UKIP | John Bigger | 933 | 2.1 | N/A | |
| Majority | 6,378 | 14.4 | +3.5 | ||
| Turnout | 44,254 | 63.2 | −12.7 | ||
| Labour Co-op hold | Swing | +1.8 | |||
Elections in the 1990s
| General Election 1997: Loughborough | |||||
|---|---|---|---|---|---|
| Party | Candidate | Votes | % | ±% | |
| Labour Co-op | Andy Reed | 25,448 | 48.6 | +8.8 | |
| Conservative | Ken Andrews | 19,736 | 37.7 | −9.1 | |
| Liberal Democrat | D. Brass | 6,190 | 11.8 | +0.6 | |
| Referendum Party | R.P. Gupta | 991 | 1.9 | N/A | |
| Majority | 5,712 | 10.9 | |||
| Turnout | 52,365 | 75.9 | −2.6 | ||
| Labour Co-op gain from Conservative | Swing | ||||
| General Election 1992: Loughborough[11] | |||||
|---|---|---|---|---|---|
| Party | Candidate | Votes | % | ±% | |
| Conservative | Stephen Dorrell | 30,064 | 50.7 | -4.0 | |
| Labour | Andy Reed | 19,181 | 32.4 | +7.9 | |
| Liberal Democrat | AW Stott | 8,953 | 15.1 | -4.6 | |
| Green | I Sinclair | 817 | 1.4 | +0.3 | |
| Natural Law | P Reynolds | 233 | 0.4 | +0.4 | |
| Majority | 10,883 | 18.4 | -11.9 | ||
| Turnout | 59,248 | 78.5 | -0.7 | ||
| Conservative hold | Swing | -5.9 | |||
Elections in the 1980s
| General Election 1987: Loughborough | |||||
|---|---|---|---|---|---|
| Party | Candidate | Votes | % | ±% | |
| Conservative | Stephen Dorrell | 31,931 | 54.7 | +1.8 | |
| Labour | C.J. Wrigley | 14,283 | 24.5 | +1.1 | |
| SDP–Liberal Alliance (Social Democratic) | R.G. Fox | 11,499 | 19.7 | −2.5 | |
| Green | R.P. Gupta | 656 | 1.1 | N/A | |
| Majority | 17,648 | 30.2 | +0.7 | ||
| Turnout | 58,369 | 79.2 | +1.5 | ||
| Conservative hold | Swing | ||||
| General Election 1983: Loughborough | |||||
|---|---|---|---|---|---|
| Party | Candidate | Votes | % | ±% | |
| Conservative | Stephen Dorrell | 29,056 | 52.9 | +4.9 | |
| Labour | Mike Jones | 12,876 | 23.4 | −16.2 | |
| SDP–Liberal Alliance (Social Democratic) | J.R. Frears | 12,189 | 22.2 | +11.5 | |
| Ecology | D.G. Whitebread | 591 | 1.1 | +0.1 | |
| BNP | John Peacock | 228 | 0.4 | N/A | |
| Majority | 16,180 | 29.5 | +21.1 | ||
| Turnout | 54,940 | 77.7 | −3.5 | ||
| Conservative hold | Swing | ||||
Elections in the 1970s
| General Election 1979: Loughborough | |||||
|---|---|---|---|---|---|
| Party | Candidate | Votes | % | ±% | |
| Conservative | Stephen Dorrell | 29,788 | 48.0 | +6.5 | |
| Labour | John Desmond Cronin | 24,589 | 39.6 | +2.4 | |
| Liberal | R. Palmer | 6,650 | 10.7 | −8.2 | |
| Ecology | D. G. Whitebread | 595 | 1.0 | N/A | |
| National Front | John Peacock | 484 | 0.8 | -1.4 | |
| Majority | 5,199 | 8.4 | |||
| Turnout | 62,106 | 81.2 | +2.7 | ||
| Conservative gain from Labour | Swing | ||||
| General Election October 1974: Loughborough | |||||
|---|---|---|---|---|---|
| Party | Candidate | Votes | % | ±% | |
| Labour | John Desmond Cronin | 22,869 | 41.5 | +2.9 | |
| Conservative | R.M. York | 20,521 | 37.2 | −0.2 | |
| Liberal | M. Bennett | 10,409 | 18.9 | −5.1 | |
| National Front | K. Sanders | 1,215 | 2.2 | N/A | |
| More Prosperous Britain | H. Smith | 125 | 0.2 | N/A | |
| Majority | 2,348 | 4.3 | +3.1 | ||
| Turnout | 55,139 | 78.5 | −5.8 | ||
| Labour hold | Swing | ||||
| General Election February 1974: Loughborough | |||||
|---|---|---|---|---|---|
| Party | Candidate | Votes | % | ±% | |
| Labour | John Desmond Cronin | 22,643 | 38.6 | −6.8 | |
| Conservative | R.M. York | 21,846 | 37.4 | −6.9 | |
| Liberal | M. Bennett | 14,096 | 24.0 | +13.7 | |
| Majority | 697 | 1.2 | +0.2 | ||
| Turnout | 58,685 | 84.3 | +5.4 | ||
| Labour hold | Swing | ||||
| General Election 1970: Loughborough | |||||
|---|---|---|---|---|---|
| Party | Candidate | Votes | % | ±% | |
| Labour | John Desmond Cronin | 22,806 | 45.4 | −4.8 | |
| Conservative | R. Elton | 22,272 | 44.3 | +7.3 | |
| Liberal | J.M. Mokrzycki | 5,185 | 10.3 | −2.6 | |
| Majority | 534 | 1.0 | −12.2 | ||
| Turnout | 50,263 | 78.9 | −3.4 | ||
| Labour hold | Swing | ||||
Elections in the 1960s
| General Election 1966: Loughborough | |||||
|---|---|---|---|---|---|
| Party | Candidate | Votes | % | ±% | |
| Labour | John Desmond Cronin | 22,935 | 50.2 | +2.5 | |
| Conservative | R. Elton | 16,911 | 37.0 | −1.2 | |
| Liberal | B.S. Stratford | 5,875 | 12.9 | −1.3 | |
| Majority | 6,024 | 13.2 | +3.7 | ||
| Turnout | 45,721 | 82.3 | −1.6 | ||
| Labour hold | Swing | ||||
| General Election 1964: Loughborough | |||||
|---|---|---|---|---|---|
| Party | Candidate | Votes | % | ±% | |
| Labour | John Desmond Cronin | 22,081 | 47.7 | +0.5 | |
| Conservative | J.L. Leatham | 17,671 | 38.2 | −0.8 | |
| Liberal | G.R.S Stevenson | 6,558 | 14.2 | +0.4 | |
| Majority | 4,410 | 9.5 | +1.3 | ||
| Turnout | 46,310 | 83.9 | −0.1 | ||
| Labour hold | Swing | ||||
Elections in the 1950s
| General Election 1959: Loughborough | |||||
|---|---|---|---|---|---|
| Party | Candidate | Votes | % | ±% | |
| Labour | John Desmond Cronin | 21,496 | 47.2 | −7.7 | |
| Conservative | C.G. Waite | 17,749 | 39.0 | −6.1 | |
| Liberal | R.E. Hancock | 6,303 | 13.8 | N/A | |
| Majority | 3,747 | 8.2 | −1.5 | ||
| Turnout | 45,548 | 84.0 | +1.6 | ||
| Labour hold | Swing | ||||
| General Election 1955: Loughborough | |||||
|---|---|---|---|---|---|
| Party | Candidate | Votes | % | ±% | |
| Labour | John Desmond Cronin | 24,044 | 54.9 | −2.1 | |
| Conservative | M.V. Argyle | 19,781 | 45.1 | +2.1 | |
| Majority | 4,263 | 9.7 | −4.3 | ||
| Turnout | 43,825 | 82.4 | −3.5 | ||
| Labour hold | Swing | ||||
| General Election 1951: Loughborough | |||||
|---|---|---|---|---|---|
| Party | Candidate | Votes | % | ±% | |
| Labour | Mont Follick | 25,894 | 57.0 | −0.5 | |
| Conservative | P.G. Spencer | 19,571 | 43.0 | +0.5 | |
| Majority | 6,323 | 13.9 | −1.1 | ||
| Turnout | 45,465 | 85.9 | −1.1 | ||
| Labour hold | Swing | ||||
| General Election 1950: Loughborough | |||||
|---|---|---|---|---|---|
| Party | Candidate | Votes | % | ±% | |
| Labour | Mont Follick | 25,921 | 57.5 | +4.2 | |
| Conservative | S. F. Middup | 19,196 | 42.5 | +11.2 | |
| Majority | 6,725 | 15.0 | −7.0 | ||
| Turnout | 87.0 | +12.3 | |||
| Labour hold | Swing | ||||
Elections in the 1940s
| General Election 1945: Loughborough | |||||
|---|---|---|---|---|---|
| Party | Candidate | Votes | % | ±% | |
| Labour | Dr. Mont Follick | 21,152 | 53.3 | +12.7 | |
| Conservative | Maj. Lawrence Kimball | 12,401 | 31.3 | −11.4 | |
| Liberal | Maj. Charles Alleyne Lidbury | 6,121 | 15.4 | −1.3 | |
| Majority | 8,751 | 22.0 | |||
| Turnout | 74.7 | −2.7 | |||
| Labour gain from Conservative | Swing | ||||
Elections in the 1930s
| General Election 1935: Loughborough | |||||
|---|---|---|---|---|---|
| Party | Candidate | Votes | % | ±% | |
| Conservative | Lawrence Kimball | 15,396 | 42.7 | −18.0 | |
| Labour | George Ernest Winterton | 14,653 | 40.6 | +1.3 | |
| Liberal | Walter Meakin | 6,003 | 16.7 | N/A | |
| Majority | 743 | 2.1 | −19.3 | ||
| Turnout | 77.4 | −4.4 | |||
| Conservative hold | Swing | ||||
| General Election 1931: Loughborough | |||||
|---|---|---|---|---|---|
| Party | Candidate | Votes | % | ±% | |
| Conservative | Lawrence Kimball | 22,310 | 60.7 | +27.8 | |
| Labour | George Ernest Winterton | 14,458 | 39.3 | −0.7 | |
| Majority | 7,852 | 21.4 | |||
| Turnout | 81.8 | −3.4 | |||
| Conservative gain from Labour | Swing | ||||
Elections in the 1920s
| General Election 1929: Loughborough | |||||
|---|---|---|---|---|---|
| Party | Candidate | Votes | % | ±% | |
| Labour | George Ernest Winterton | 14,854 | 40.0 | +5.1 | |
| Conservative | Frank Gibbs Rye | 12,210 | 32.9 | −7.0 | |
| Liberal | Frank Gladstone Hines | 10,044 | 27.1 | +1.9 | |
| Majority | 2,644 | 7.1 | |||
| Turnout | 85.2 | +1.5 | |||
| Labour gain from Conservative | Swing | ||||
| General Election 1924: Loughborough | |||||
|---|---|---|---|---|---|
| Party | Candidate | Votes | % | ±% | |
| Conservative | Frank Rye | 11,114 | 39.9 | +8.4 | |
| Labour | George Ernest Winterton | 9,751 | 34.9 | +2.4 | |
| Liberal | Edward Spears | 7,040 | 25.2 | −10.8 | |
| Majority | 1,363 | 5.0 | |||
| Turnout | 83.7 | +6.8 | |||
| Conservative gain from Liberal | Swing | ||||
| General Election 1923: Loughborough | |||||
|---|---|---|---|---|---|
| Party | Candidate | Votes | % | ±% | |
| Liberal | Edward Spears | 8,937 | 36.0 | N/A | |
| Labour | George Ernest Winterton | 8,064 | 32.5 | N/A | |
| Conservative | Frank Rye | 7,805 | 31.5 | N/A | |
| Majority | 873 | 3.5 | |||
| Turnout | 76.9 | ||||
| Liberal hold | Swing | ||||
| General Election 1922: Loughborough | |||||
|---|---|---|---|---|---|
| Party | Candidate | Votes | % | ±% | |
| National Liberal | Edward Spears | Unopposed | N/A | N/A | |
| National Liberal hold | Swing | N/A | |||
Elections in the 1910s
| General Election 1918: Loughborough | |||||
|---|---|---|---|---|---|
| Party | Candidate | Votes | % | ±% | |
| Liberal | Oscar Guest | 11,918 | 65.1 | +12.8 | |
| Labour | Herbert William Hallam | 6,381 | 34.9 | −12.8 | |
| Majority | 5,537 | 30.2 | +25.6 | ||
| Turnout | 59.8 | −30.4 | |||
| Liberal hold | Swing | ||||
| General Election December 1910: Loughborough | |||||
|---|---|---|---|---|---|
| Party | Candidate | Votes | % | ±% | |
| Liberal | Sir Maurice Levy | 6,488 | 52.3 | −0.6 | |
| Conservative | Neville Woodford Smith-Carington | 5,916 | 47.7 | +0.6 | |
| Majority | 572 | 4.6 | −1.2 | ||
| Turnout | 90.2 | −2.6 | |||
| Liberal hold | Swing | ||||
| General Election January 1910: Loughborough | |||||
|---|---|---|---|---|---|
| Party | Candidate | Votes | % | ±% | |
| Liberal | Sir Maurice Levy | 6,760 | 52.9 | −4.6 | |
| Conservative | Neville Woodford Smith-Carington | 6,007 | 47.1 | +5.6 | |
| Majority | 753 | 5.8 | −11.2 | ||
| Turnout | 92.8 | +2.7 | |||
| Liberal hold | Swing | ||||
Elections in the 1900s
| General Election 1906: Loughborough | |||||
|---|---|---|---|---|---|
| Party | Candidate | Votes | % | ±% | |
| Liberal | Maurice Levy | 6,803 | 57.5 | +7.2 | |
| Conservative | W. B. Du Pré | 5,023 | 42.5 | −7.2 | |
| Majority | 1,780 | 15.0 | +14.4 | ||
| Turnout | 90.1 | +5.0 | |||
| Liberal hold | Swing | ||||
| General Election 1900: Loughborough | |||||
|---|---|---|---|---|---|
| Party | Candidate | Votes | % | ±% | |
| Liberal | Maurice Levy | 4,897 | 50.3 | −1.7 | |
| Conservative | Hussey Packe | 4,830 | 49.7 | +1.7 | |
| Majority | 67 | 0.6 | −3.4 | ||
| Turnout | 85.1 | −3.4 | |||
| Liberal hold | Swing | ||||
Elections in the 1890s
| General Election 1895: Loughborough | |||||
|---|---|---|---|---|---|
| Party | Candidate | Votes | % | ±% | |
| Liberal | Jabez Johnson-Ferguson | 4,732 | 52.0 | −2.1 | |
| Conservative | R. L. Tooth | 4,360 | 48.0 | +2.1 | |
| Majority | 372 | 4.0 | −4.2 | ||
| Turnout | 88.5 | +2.5 | |||
| Liberal hold | Swing | ||||
| General Election 1892: Loughborough | |||||
|---|---|---|---|---|---|
| Party | Candidate | Votes | % | ±% | |
| Liberal | Jabez Johnson-Ferguson | 4,715 | 54.1 | +4.9 | |
| Conservative | Edwin de Lisle | 3,994 | 45.9 | −4.9 | |
| Majority | 721 | 8.2 | |||
| Turnout | 86.0 | −0.1 | |||
| Liberal gain from Conservative | Swing | ||||
Elections in the 1880s
| General Election 1886: Loughborough | |||||
|---|---|---|---|---|---|
| Party | Candidate | Votes | % | ±% | |
| Conservative | Edwin de Lisle | 4,075 | 50.8 | +7.0 | |
| Liberal | Jabez Johnson-Ferguson | 3,940 | 49.2 | −7.0 | |
| Majority | 135 | 1.6 | |||
| Turnout | 86.1 | −4.4 | |||
| Conservative gain from Liberal | Swing | ||||
| General Election 1885: Loughborough | |||||
|---|---|---|---|---|---|
| Party | Candidate | Votes | % | ±% | |
| Liberal | Jabez Johnson-Ferguson | 4,733 | 56.2 | N/A | |
| Conservative | Montagu Curzon | 3,693 | 43.8 | N/A | |
| Majority | 1,040 | 12.4 | N/A | ||
| Turnout | 90.5 | ||||
See also
Notes and references
- Notes
- References
- ↑ "Electorate Figures - Boundary Commission for England". 2011 Electorate Figures. Boundary Commission for England. 4 March 2011. Retrieved 13 March 2011.
- ↑ Leigh Rayment's Historical List of MPs – Constituencies beginning with "L" (part 4)
- ↑ http://ukpollingreport.co.uk/2015guide/Loughborough/
- ↑ http://electionresults.blogspot.co.uk/2013/04/loughborough-2015.html
- ↑ http://electionresults.blogspot.co.uk/2013/04/loughborough-2015.html
- ↑ http://www.libdems.org.uk/general_election_candidates
- ↑ http://ukpollingreport.co.uk/2015guide/loughborough/
- ↑ http://loughborough.greenparty.org.uk/news/2014/12/15/matt-sisson-selected-as-parliamentary-candidate-for-loughborough/
- ↑ Loughborough, UKPollingReport
- ↑ "BBC NEWS – Election 2010 – Loughborough". BBC News.
- ↑ "Politics Resources". Election 1992. Politics Resources. 9 April 1992. Retrieved 6 Dec 2010.
Sources
- UK Genealogy Archives - History
- BBC News: Loughborough constituency - History and Boundaries
- Andy Reed MP | Loughborough Constituency - Boundaries
- British Parliamentary Election results 1983-97 - Elections (1983–1992)
- UK General Elections since 1832 - Elections (1951–1979)
- McCalmont, Frederick Haynes, Stenton Michael, Vincent, John Russell. McCalmont's parliamentary poll book: British election results. (ISBN 0-85527-000-4)
- F. W. S. Craig. British Parliamentary Election Results 1950-1973. (ISBN 0-900178-07-8)
- F. W. S. Craig. British Parliamentary Election Results 1918-1949. (ISBN 0-900178-01-9)
External links
- BBC News: Voters 'concerned' at crime rise
- Labour in Loughborough
- Loughborough Conservatives
- Loughborough Liberal Democrats
- Map showing original Loughborough constituency (1895)